1. Introduction
Pakistan is a developing country which, despite existing environmental protection, continues to face serious environmental challenges. Environmental sustainability refers to stabilizing the relationship between the human beings and the natural world. In recent years, packaging has become an important topic in sustainable development (Naeem and Ahmed Reference Naeem and Ahmed2023).
Extensive research has been conducted to promote the circular economy and the use of bio-based packaging that are less harmful to the environment. Typically, disposable packaging materials (DPMs) are single-use items mainly used for sales, storage and in food service industry (Tallentire and Steubing Reference Tallentire and Steubing2020). Green, or sustainable, packaging utilizes materials and processes that reduce energy consumption and environmental impact. However, in less developed countries such as Pakistan, awareness of its benefits - and the environmental risks of non-degradable materials such as plastic remains limited (Galafassi et al. Reference Galafassi, Nizzetto and Volta2019). In Pakistan, recycling and waste management are mostly informal, with little emphasis on green packaging. Consumers often prioritize affordability over environmental concerns, and public awareness of environmental issues is inconsistent. Organizations have limited interest in environmental journalism, despite Pakistan being one of the most environmentally vulnerable countries (Chhachhar et al. Reference Chhachhar, Arain and Chandio2020). The lack of implementation of environmental protection laws in the packaging production sector in Pakistan, along with our previous research on monitoring the modern carbon fraction in disposable packaging in Europe (Aziz Gill et al. Reference Aziz Gill, Michczyńska, Michczyński and Piotrowska2024b), motivated us to analyze packaging samples from Pakistan.
Market efficiency and economic viability are critical factors. Ideally, renewable energy should be used throughout the entire life cycle, from sourcing to recycling. To maximize material and energy efficiency, sustainable packaging should predominantly employ recyclable or renewable materials, adhere to eco-friendly production methods, and minimize waste (Spence Reference Spence2021). On the other hand, the production and recycling of DPMs on an industrial scale is one of the main sources of CO2 emission, causing global hazards. However, these emissions can be reduced by using renewable resources in packaging materials (Rodin et al. Reference Rodin, Lindorfer, Boehm and Vieira2020). Producing new paper from wastepaper materials requires less energy and emits fewer greenhouse gases compared to producing the same amount of paper from virgin materials (Merrild et al. Reference Merrild, Damgaard and Christensen2008).
The renewability of the materials can be determined by measuring the bio-based carbon content in a sample, with the radiocarbon method allowing differentiation between fossil and bio-based materials (Krajcar Bronić et al. Reference Krajcar Bronić, Barešić, Horvatinčić and Sironić2017). Depending on the uptake time of 14CO2 in the atmosphere, bio-mass material contains a particular amount of 14C, whereas fossil material does not contain it anymore, as the half-life of 14C is 5700 years (Kutschera Reference Kutschera2019). Typically, paper package materials are produced from the cellulose fiber and the coating material (thin plastic film such as polyethylene (LDPE – fossil-fuel-based plastic), or polylactic acid (PLA – bio-based plastic), or waxes (both fossil-derived synthetic waxes and natural waxes such as beeswax or carnauba wax)) to avoid food absorption. For coating, typically low-density polyethylene (LDPE) is used, which is a fossil-fuel plastic. However, both paper and plastic lining are recyclable (Bonifer et al. Reference Bonifer, Tanninen and Leminen2024; Foteinis Reference Foteinis2020; Mitchell et al. Reference Mitchell, Vandeperre, Dvorak, Kosior, Tarverdi and Cheeseman2014; Van der Harst and Potting Reference Van der Harst and Potting2013), but it is challenging to determine the bio-based carbon in total material.
It is worth noting that Pakistan has estimated 5% forest cover and its growth rate is 1.1% (Nazir and Ahmad Reference Nazir and Ahmad2018). Therefore, the paper industry in this country relies on agricultural raw materials such as wheat and rice straw, bagasse, and cotton linters (Khan et al. Reference Khan, Rehman, Khan, Khan, Ali and Ahmad2024). An important part of the raw material is waste paper, which is imported mainly from the USA, European Union, the United Arab Emirates and Saudi Arabia. Wood pulp is imported primarily from the USA, China, the Persian Gulf, and Scandinavian countries (Un comtrade database; Volza). Pulp comes primarily from coniferous trees (pine, spruce), while the wood itself is harvested primarily from thinning (trees approximately 20 years old) and waste from mature trees (tree tops with an average age of 40–50 years). Local wood pulp production relies primarily on fast-growing plantation species (Eucalyptus camaldulensis, Melia dubia), with the optimal age for harvesting trees being 4–6 years.
Numerous standards concerning bio-based carbon content, founded on radiocarbon analysis, are applicable according to the kind of samples. Mainly, three standards, EN 16785-1, ASTM D6866, and EN 16640, are used for the bio-based carbon determination. ASTM 6866 determines Bio-based carbon as a percentage of total organic carbon (bio-based+fossil-based). Whereas, EN 16640 expresses bio-based carbon as a percentage of total carbon (bio-based+fossil-based+inorganic carbon) (Bio-based. 2021). In Poland EN 16640 2017 standard applies, and our measurements were carried out in accordance with this standard. In this research, packaging materials from Pakistan were analyzed for bio-based carbon determination using liquid scintillation counting (LSC) and accelerator mass spectrometry (AMS) techniques. This research was based on the intercomparison between laboratories, techniques and also investigating inter-sample variations through sub-sampling. Additionally, the study aimed to evaluate whether the visually observed layered structure of the investigated samples corresponds to differences in 14C concentration, and consequently, whether it is possible to reliably determine the overall bio-based carbon content of the bulk material. The analyses were performed at Gliwice 14C and the Mass Spectrometry Laboratory within the Institute of Physics – Centre for Science and Education, SUT, Poland, as well as at the Centro Nacional de Aceleradores (CNA) Seville, Spain. This research was inspired by our previous research performed on packaging samples from Poland collected from different companies (Aziz Gill et al. Reference Aziz Gill, Michczyńska, Michczyński and Piotrowska2024b). Producers and marketers will benefit from this study by gaining a better understanding of the importance of green packaging in improving ecological sustainability.
2. Materials
In this research, the concentration of the 14C isotope in seven different kinds of disposable packaging samples for daily use from Pakistan was determined using both LSC and AMS techniques for the radiocarbon detection. Samples were collected from the local markets in Karachi in October 2022, and included paper plates, cups, boxes, baking paper, and wooden cutlery packaging materials.
Figure 1 presents photographs of the analyzed samples, showing the different material layers. In sample DPK-1 (paper cups), the inside layer was more waterproof compared to the outside surface, whereas the middle layer was composed of cellulose fibers. DPK-2 (brown paper plates), initially, consisted of three layers. Before combustion, the aluminum foil was removed (easily detachable). The rest of the two layers consisted of fibrous material, but the top layer had some colored design (pigmentation), whereas the bottom outside surface was thick and without pigmentation. DPK-3 (baking paper) consist of a single paper layer (probably silicon coated). DPK-4 (white paper plates) consisted of two different layered materials. The inside surface was waterproof and bit harder, while the middle layer wasn’t. DPK-5 (white-brown paper plates) consisted of two different layers. The bottom brown layer consisted of more cellulose fiber material. Sample DPK-6 consists of wooden cutlery (spoons). Basic microscopic analysis revealed that they were made from an exotic hardwood with large annual growth rings. The wood contained heartwood and sapwood. The spoons examined were made from a fast-growing tree, and judging by the number of visible annual growth rings within each spoon, the tree had been growing for at least 20 years. DPK-7 (paper boxes) consisted of two different layers. The inside surface was waterproof, while the middle layer was not. Except for wooden spoons, different proportions of waterproof material were used in various parts of the samples during production.
Disposable packaging samples used for analyses. Sample DPK-1 is characterized by a distinct three-layer structure. The DPK-2 sample was likely manufactured using recycled cardboard, the printed side of which (different prints for different plates) was coated with a layer of aluminum. Samples DPK-4, DPK-5, and DPK-7 have a two-layer structure. They consist of a waterproof layer (inside surface) and a cardboard layer (middle layer). Sample DPK-6 consists of wooden cutlery (spoons); marks were added to better visualize the annual growth rings and the heartwood/sapwood boundary.

It should be noted that separating the waterproof layer was the most difficult task when dividing the materials into layers. Waterproof layers are usually applied to the packaging materials during the lamination process. This makes them strongly bonded to the paper and difficult to separate. This applies to both coatings made of PE and bio-coatings made of PLA (polylactic acid). Despite our best efforts and the use of specialized forceps, the waterproof layer was always sampled together with a very thin layer of adjacent paper.
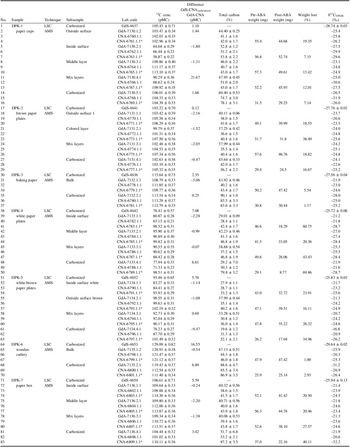
For LSC measurements (lab. code GdS), the samples were analyzed as bulk (carbonized) materials, whereas AMS measurements (lab. code GdA for Gliwice Radiocarbon Laboratory and CNA for Seville Radiocarbon Laboratory) were carried out on two stages of measurements. In the first stage, a small subsample of each material, as a bulk was selected from a random part of the sample, while in the second stage, tests were conducted on several layers of the samples. Layers were separated by cutting or detaching precisely using forcep, a laboratory instrument. Except for baking paper and wooden cutlery, all DPM samples were examined as outside surface, inside surface, middle layer and mix layers. The detailed sample categories are described in Table 1.
Results of the 14C concentration together with comparison of Gliwice and Seville results (presented as a difference between 14C concentration measured in Gliwice and Seville laboratories GdS-CNAcarbonized and GdA-CNA), total carbon content, pretreatment yields for ABA pretreatment and δ13C values.

Table 1. Long description
The table presents data on radiocarbon measurements and sample characteristics from different laboratories. It includes columns for sample number, sample type, technique, subsample, lab code, 14C concentration, difference in 14C concentration, total carbon, pre-ABA weight, post-ABA weight, weight loss, and delta 13C values. The table has 83 rows and 14 columns. Each row provides detailed information for a specific sample, including the lab code, 14C concentration in pMC, the difference in 14C concentration between Gliwice and Seville laboratories, total carbon percentage, pre-ABA and post-ABA weights in milligrams, weight loss percentage, and delta 13C values. The samples are categorized by different techniques and subsamples, such as carbonized, bulk, outside surface, inside surface, middle layer, and mix layers.
* Samples with ABA pretreatment.
3. Methodology
3.1. Accelerator mass spectrometry (AMS) measurements
3.1.1. Preparation and analysis of samples at Gliwice 14C and Mass Spectrometry Laboratory
Samples were analyzed at Gliwice 14C and Mass Spectrometry Laboratory without chemical pretreatment, following the procedure described in our previous research (Aziz Gill et al. Reference Aziz Gill, Michczyńska, Michczyński and Piotrowska2024b). Briefly, due to sample heterogeneity, analyses were carried out according to the layer structure. Samples for AMS measurements included outer, inner, and mixed layers, a bulk sample taken from a random part of the material, and an additional carbonized sample prepared specifically for LSC measurements (see 3.2)ef. A small subsample was taken from the charred material.
Graphitization of the samples was performed using the VarioMicroCube Elemental Analyzer coupled with the automated graphitization equipment (AGE-3) system by IonPlus AG (Němec et al. Reference Němec, Wacker and Gäggeler2010; Wacker et al. Reference Wacker, Němec and Bourquin2010b). The Elemental Analyzer was used to combust approximately 1mg of material, sealed in tin boat capsules, to generate CO2 gas. The produced CO2 gas was graphitized in the presence of H2 and Fe. The resulting graphite was pressed into target holder and sealed with an aluminum ball.
The 14C/12C and 13C/12C ratios were measured using AMS. The 14C/12C ratio was determined with the MIni CArbon DAting System (MICADAS) accelerator mass spectrometer (Synal et al. Reference Synal, Stocker and Suter2007), with BATS software applied for data evaluation (Wacker et al. Reference Wacker, Christl and Synal2010a). Anthracite and phthalic acid were used as background materials, while Oxalic Acid II (NBS/SRM 4990C) served as the standard for normalization.
3.1.2. Preparation and analysis at the Centro Nacional de Aceleradores (CNA), Seville, Spain
As part of her research internship, the first author also analyzed packaging samples at the Centro Nacional de Aceleradores (CNA). The samples came from the same batches of packaging analyzed in Gliwice. Additionally, samples charred at the Gliwice Laboratory were analyzed.
The measurements were performed for samples with and without chemical pretreatment. The acid-base-acid (ABA) method was applied for sample pretreatment at room temperature. In the first step, samples were washed with 0.5M HCl for 24 hr, followed by 0.1M NaOH for 24 hr and finally with HCl for 50 min. After each wash, samples were neutralized and dried at 80 ºC. The sample weights before and after pretreatment are presented in Table 1.
Samples, paper cup (DPK-1) and brown paper plates (DPK-2), consist of printed surface. In order to remove the contaminations caused by ink, Soxhlet extraction was additionally performed for samples CNA-6761.1.1 and CNA-6773.1.1. using hexane, acetone and ethanol for 20 min, the cleaned materials were later used for dating (Arévalo et al. Reference Arévalo, Martínez and García2015a, Reference Arévalo, Martínez, García, Maldonado and León2015b).
Approximately 2 mg of the carbonized material and about 4mg of other samples were graphitized using the same Swiss-designed AGE system as in Gliwice, which couples an Elemental Analyzer (EA, Vario Micro-Cube, Elementar) directly to the graphitization line (Němec et al. Reference Němec, Wacker and Gäggeler2010; Wacker et al. Reference Wacker, Christl and Synal2010a, Reference Wacker, Němec and Bourquin2010b). Samples were wrapped in tin foil and loaded into the elemental analyzer (EA) for combustion. They were then graphitized using the AGE system. The 14C/12C and 13C/12C ratios were measured using the MICADAS accelerator mass spectrometer, following the same procedure used at the Gliwice laboratory. (Arévalo et al. Reference Arévalo, Martínez, García, Maldonado and León2015b; Synal et al. Reference Synal, Stocker and Suter2007).
3.2. Liquid scintillation counting (LSC) measurements
The benzene synthesis method was used for the LSC technique, as described in detail by (Aziz Gill et al. Reference Aziz Gill, Michczyńska, Michczyński, Werle and Ferdyn-Grygierek2024a, Reference Aziz Gill, Michczyńska, Michczyński and Piotrowska2024b). The bulk samples were carbonized directly, without any chemical pretreatment, under limited oxygen access. Approximately 24 g of each sample was combusted in a steel reactor covered with a small, perforated lid to minimize oxygen access. The material was charred in a muffle furnace at 700 ºC for approximately 10 minutes, then cooled and ground to a fine powder for further analysis. The obtained carbonized sample was used for LSC and AMS measurements.
Benzene was synthesized through the following steps: carbide synthesis of carbonized material with lithium metal at 700 ºC, hydrolysis (acetylene preparation), and trimerization of acetylene under controlled pressure in the presence of chromium catalyst preheated at 600 ºC for 30 min. The obtained benzene was purified by removing water molecules with sodium metal. Atmospheric radon was removed by storing the sample in a freezer at –15 ºC for approximately one month, considering the 3.8-day half-life of radon. LSC measurements were carried out using a Quantulus 1220TM liquid scintillation β spectrometer (Jędrzejowski et al. Reference Jędrzejowski, Michczyńska, Michczyński, Kłusek and Tudyka2023; Pawlyta et al. Reference Pawlyta, Pazdur, Rakowski, Miller and Harkness1997).
3.3. δ13C measurements by isotope ratio mass spectrometry (IRMS)
The relative ratio of stable carbon isotopes (δ13C, expressed as 13C/12C) was determined using IRMS measurements for calculating the standardized isotope fractionation correction. Samples were combusted in Simax tubes with approximately 300 mg of CuO at 560 ºC for about 12 hr under proper sealing conditions. The obtained CO2 was purified and transferred by a gas syringe to septa-sealed vials filled with high-purity helium. The following standards were used: ANU-sucrose (IAEA-CH-6, ∼3 mg), NBS-22 (oil, ∼5 µL) and WZS (an internal standard from lake sediment, ∼2 µg) (Ustrzycka Reference Ustrzycka2020). The IsoPrime 100 spectrometer, connected to the Gilson-271 auto sampler MultiFlow system, was used for δ13C measurements (Agnihotri et al. Reference Agnihotri, Kumar, Prasad, Sharma, Bhatia and Arya2014; Aziz Gill et al. Reference Aziz Gill, Michczyńska, Michczyński, Piotrowska and Ustrzycka2023; Multiflow Reference Multiflow2012).
4. Results and discussion
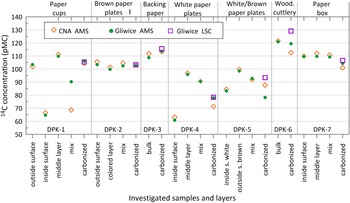
In this research, seven DPMs samples were prepared and analyzed in three radiocarbon laboratories using two different measurement techniques. The results of 14C isotope concentration obtained by LSC, AMS at Gliwice 14C and Mass Spectrometry Laboratory and AMS at CNA Radiocarbon Laboratory, are listed in Table 1. Graphical representation of the results is shown in Figure 2.
Interlaboratory comparison of the 14C isotope concentration in disposable packaging materials. Measurements are presented for samples without chemical pretreatment.

The 14C concentrations of the samples are reported in percent modern carbon (pMC) (Stuiver and Polach Reference Stuiver and Polach1977). For the LSC technique, δ13C values were measured using the IRMS method. Meanwhile, the δ13C values reported in Table 1 for the AMS measurements are only indicative, as they were obtained using MICADAS, therefore include the effect of isotopic fractionation during the graphitization process and AMS measurements. All δ13C values are reported in per mil (‰) relative to the VPDB standard.
Measurements showed that all tested single-use packaging samples were produced (at least partially) from contemporary biomass. Four out of six paper material samples exhibited a 14C concentration greater than 100 pMC, consistent with values reported for packaging materials in (Aziz Gill et al. Reference Aziz Gill, Michczyńska, Michczyński, Werle and Ferdyn-Grygierek2024a, Reference Aziz Gill, Michczyńska, Michczyński and Piotrowska2024b; Huels et al. Reference Huels, Pensold and Pigorsch2017). The white paper plates (DPK-4) and white-brown paper plates (DPK-5) showed 14C concentration ranging from 60.87 ± 0.28 to 99.82 ± 0.31 pMC and from 78.23 ± 0.27 to 102.19 ± 0.32 pMC, respectively.
Good agreement was obtained between AMS measurements performed in the laboratories in Gliwice and Seville. The differences were below 3 pMC (the ASTM D6866 standard, equivalent to EN 16640, accounts for sample heterogeneity and recommends an absolute uncertainty of 3% for determining bio-based carbon content). An exception was observed for carbonized samples. Carbonization, applied as the first step of chemical preparation for radiocarbon measurements using the liquid scintillation counting (LSC) technique, did not prove to be an effective homogenization method for samples DPK-4 to DPK-7. This may indicate that the obtained material should have been more thoroughly homogenized prior to AMS measurements. It should be noted that, except for sample DPK-6 (wooden spoons), the LSC results fall within the range of 14C concentrations obtained for individual layers. The higher LSC result for sample DPK-6 may be due to the use of a spoon originating from a different tree than that used for AMS measurements. It is difficult to determine the exact year of formation of the bio-based component. Assuming the bio-based component was created in the year 2021, the reference value (REF) is taken as 100 pMC, and the bio-based based carbon content is equal to the measured 14C concentration in each sample (CIO 2022; Hua et al. Reference Hua, Turnbull, Santos, Rakowski, Ancapichún, De Pol-Holz, Hammer, Lehman, Levin and Miller2022). This assumption may only be valid for the outside brown surface of the DPK-5 (white-brown plate sample). The smallest variation in 14C concentrations between layers was observed for samples DPK-2 and DPK-7, corresponding to paper plates (originally coated with aluminum) and a folding box, respectively. In the remaining packaging samples, clear differences between individual layers were observed.
When analyzing individual layers, the lowest 14C concentrations were found in the waterproof layers (denoted as the inside surface) for samples DPK-1 (paper cups), DPK-4 (white paper plates), and DPK-5 (white–brown paper plates). These results indicate that the lamination layers were made from fossil-based materials. Since the lamination process does not allow separation of the foil from the paper, the obtained values should be treated as averages of the foil and the adjacent paper.
For sample DPK-2 (brown paper plates), the upper layer (colored layer, directly beneath the aluminum layer) shows only a slightly lower 14C concentration than the underlying layer. This reduction may be caused by printing ink, which contains both natural and synthetic pigments and binders. A similar effect of printing ink may explain the lower 14C concentration in the outside surface compared to the middle layer for sample DPK-1.
Measurements performed for wooden spoons yielded values ranging from 129.09 ± 0.82 (GdS-4653) to 111.40 ± 0.34 pMC (CNA-6801.1.1*), consistent with values reported in (Aziz Gill et al. Reference Aziz Gill, Michczyńska, Michczyński, Werle and Ferdyn-Grygierek2024a, Reference Aziz Gill, Michczyńska, Michczyński and Piotrowska2024b; Krajcar Bronić et al. Reference Krajcar Bronić, Barešić and Horvatinčić2015). Calibration of these results using the post-bomb atmospheric calibration curves NH1 and NH3 (due to the unknown origin of the wood, both zones were considered) yielded two possible age ranges in each case: 1962 (14.3%) or 1978–1980 (81.1%) for GdS-4653, and 1958 (7.0%) or 1995–1997 (88.4%) for CNA-6801.1.1*. The more probable range is 1978–1997. This suggests that the analyzed spoons originated from tree rings formed over a period of approximately 15–20 years, which is consistent with preliminary observations of the wood structure.
The δ13C values ranged from −32.19‰ to −20.64‰, consistent with previously reported ranges (Santos et al. Reference Santos, Macario, Jou, Oliveira, Cardoso, Diaz, Anjos and Alves2019; Telloli et al. Reference Telloli, Rizzo, Canducci and Bartolomei2019).
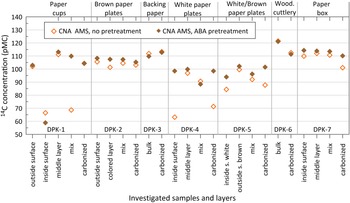
Figure 3 shows the effect of ABA pretreatment on the 14C concentration results for samples measured in the Seville laboratory. It is observed that in most samples, the 14C concentrations increased after ABA pretreatment (Fig. 3), suggests the removal of carbon fractions depleted in 14C concentration, which may include fossil-derived material. The same trend is also visible in carbon content—see Table 1. Table 1 presents also the weight loss of the samples after ABA pretreatment, which ranged from 1% to 69.86%, depending on the presence of a waterproof plastic coating. The lowest weight loss was observed in wooden cutlery samples, while the highest weight loss occurred in the inside surface-layer and carbonized samples. In this regard, the low 14C concentrations obtained from the inside surfaces of the samples confirm the presence of a thin fossil-based plastic coating.
Influence of ABA pretreatment on measured 14C concentration.

Figure 3. Long description
Panel A: A scatter plot showing the influence of ABA pretreatment on measured 14C concentration in paper cups. The horizontal axis represents different samples and layers, while the vertical axis represents 14C concentration in pMC. Data points are marked with two different symbols representing CNA AMS, no pretreatment and CNA AMS, ABA pretreatment. Panel B: A scatter plot showing the influence of ABA pretreatment on measured 14C concentration in brown paper plates. The horizontal axis represents different samples and layers, while the vertical axis represents 14C concentration in pMC. Data points are marked with two different symbols representing CNA AMS, no pretreatment and CNA AMS, ABA pretreatment. Panel C: A scatter plot showing the influence of ABA pretreatment on measured 14C concentration in backing paper. The horizontal axis represents different samples and layers, while the vertical axis represents 14C concentration in pMC. Data points are marked with two different symbols representing CNA AMS, no pretreatment and CNA AMS, ABA pretreatment. Panel D: A scatter plot showing the influence of ABA pretreatment on measured 14C concentration in white paper plates. The horizontal axis represents different samples and layers, while the vertical axis represents 14C concentration in pMC. Data points are marked with two different symbols representing CNA AMS, no pretreatment and CNA AMS, ABA pretreatment. Panel E: A scatter plot showing the influence of ABA pretreatment on measured 14C concentration in white/brown paper plates. The horizontal axis represents different samples and layers, while the vertical axis represents 14C concentration in pMC. Data points are marked with two different symbols representing CNA AMS, no pretreatment and CNA AMS, ABA pretreatment. Panel F: A scatter plot showing the influence of ABA pretreatment on measured 14C concentration in wood cutlery. The horizontal axis represents different samples and layers, while the vertical axis represents 14C concentration in pMC. Data points are marked with two different symbols representing CNA AMS, no pretreatment and CNA AMS, ABA pretreatment. Panel G: A scatter plot showing the influence of ABA pretreatment on measured 14C concentration in paper box. The horizontal axis represents different samples and layers, while the vertical axis represents 14C concentration in pMC. Data points are marked with two different symbols representing CNA AMS, no pretreatment and CNA AMS, ABA pretreatment.
The colored components of sample CNA-6761.1.1 from DPK-1 and sample CNA-6773.1.1 from DPK-2 were subjected to Soxhlet extraction. No changes in either mass or coloration were observed, indicating the stability and resistance of these materials to the extraction process.
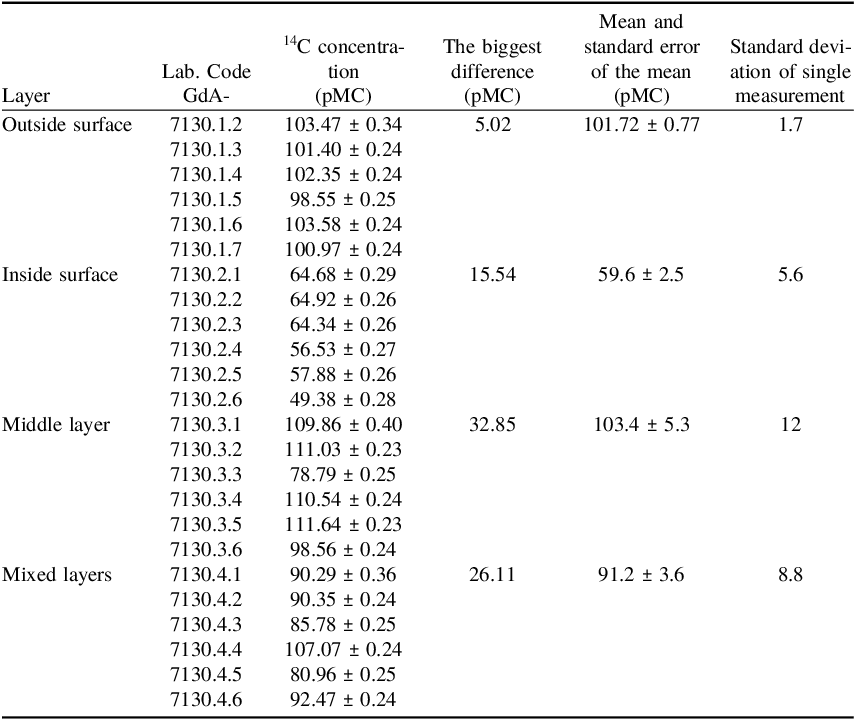
Measurements for sample DPK-1 showed the largest variability, both between the separated layers and between laboratories for the sample “mix” (a mixture of separated layers in random mass proportions). This sample also exhibited the largest difference in 14C concentration measured in the Seville laboratory between samples subjected to ABA pretreatment and those without pretreatment (see Fig. 3)., For this reason, this sample was selected for additional homogeneity tests aimed at assessing the consistency of repeated measurements for different subsamples taken from the separated layers, which are consist of outside surface, inside surface, middle layer and mixed layers. The results are presented in Table 2.
Results of the material homogeneity test within the separated layers for sample DPK-1. The table also includes GdA measurement results previously presented in Table 1.

Table 2. Long description
A table comparing carbon-14 concentrations across different layers of a sample. The table has 4 rows and 6 columns. Column headers are Lab. Code, 14C concentration (pMC), The biggest difference (pMC), Mean and standard error of the mean (pMC), and Standard deviation of single measurement. Row labels are Outside surface, Inside surface, Middle layer, and Mixed layers. Each row contains multiple entries with specific values for each column. The table provides detailed measurements and variations in carbon-14 concentrations for different layers of the sample.
Homogeneity tests were performed on a single paper cup sample. The obtained results indicate heterogeneity within the individual layers, which may be influenced by the binding material.
14C concentration measurements, used to determine the percentage of bio-based content, form the basis for obtaining BIO certification by producers of biofuels, bioplastics, and disposable packaging. Such analyses have also been the subject of numerous scientific studies. For example, Haverly et al. Reference Haverly, Fenwick, Patterson and Slade2019 and Baranyika et al. Reference Baranyika, Piotrowska, Kłusek, Michczyński and Pawlyta2022 addressed biofuels, while (Varga et al. Reference Varga, Molnar, Varricchio, Carcione, Detti and Bartalini2024) focused on bioplastics.
Haverly et al. Reference Haverly, Fenwick, Patterson and Slade2019 reported smaller interlaboratory variability than that observed in our study, whereas Baranyika et al. Reference Baranyika, Piotrowska, Kłusek, Michczyński and Pawlyta2022 and Varga et al. Reference Varga, Molnar, Varricchio, Carcione, Detti and Bartalini2024 found smaller discrepancies between different measurement techniques (LSC and AMS). This is likely because fuels are more homogeneous, as are bioplastics, which are melted during the production process.
In contrast, our study involved solid samples and revealed significant interlayer variability. Moreover, measurements performed on the DPK-1 sample showed substantial inhomogeneities within a single sample.
Due to the multi-layer structure of the tested samples, it is not possible to reliably determine the percentage of bio-based carbon in them. Instead, it is only possible to estimate the production period of the bio-components used in the outside surface and middle layers, or to define the range of years during which the trees from which the tested wooden cutlery was produced were growing.
Determination of the biobased carbon content in the investigated samples would require knowledge of the mass of individual layers and precise separation of the water-resistant layer. With the lamination technique used, such separation is very difficult.
The study also demonstrated that the absolute error of 3% proposed in ASTM D6866 for determining bio-based carbon content may be insufficient in the case of multilayer materials. At the same time, the collected subsamples, distributed for measurements between two laboratories, showed good interlaboratory agreement.
5. Conclusion
This study determined the bio-based carbon content in disposable packaging materials from Pakistan using radiocarbon (14C) analysis. Paper cups, plates, baking paper, boxes, and wooden cutlery were analyzed by both LSC and AMS methods in two independent laboratories—Gliwice (Poland) and Seville (Spain).
All tested materials contained modern biogenic carbon, confirming their primarily renewable origin. Lower 14C concentrations observed in the inside surfaces of some samples indicate the presence of fossil-derived waterproof coatings, while wooden cutlery showed the highest 14C concentrations (>120 pMC).
The interlaboratory comparison demonstrated the consistency between laboratories and between analytical techniques. High differences in some results are due to the high inhomogeneity of the samples.
The study demonstrated that the absolute error of 3% proposed in ASTM D6866 for determining bio-based carbon content may be insufficient in the case of multilayer materials.
These results contribute to strengthening the analytical basis for international certification of bio-based materials and support the broader implementation of sustainable packaging solutions in developing countries.
Acknowledgments
Internship of the first author in Seville laboratory has been supported by NAWA STER program, Project No. 32/014/NWD21/2001-04.