I. INTRODUCTION
Synthetic manganese oxide with its outstanding physicochemical properties and structural flexibility is one of the most attractive inorganic material having applications in biosensors, catalysis, ion exchange, cathode materials for rechargeable batteries, and in supercapacitors.Reference Ramesh, Chen, Chen, Liu, Wang and Han1–Reference Zhang, Qiao, Hu and Zhou8 The varied functionalities of MnO2 are due to its existence in different crystallographic forms, such as α, β, γ, δ, and λ forms. The various polymorphs differ from each other in the spatial arrangement of the basic MnO6 octahedra. The δ phase is a two-dimensional-layered compound; λ form has a three-dimensional (3D) spinel structure; and α, β, and γ forms consist of one-dimensional (1D) tunnels with X × X octahedral cross sections (X = 1, 2, 3, or 4) in their structure.
Lately, there has been an increasing interest in the synthesis of MnO2 nanostructures due to the fact that the optical and electronic properties of MnO2 nanostructures rely on their size, morphology, and crystallographic forms. Nanorods, nanobelts, nanowires, nanotubes, nanofibers, and nanoneedles of MnO2 have been prepared using different synthesis methods, such as sol–gel, reflux, coprecipitation, solid state chemical reaction, electrodeposition, template-assisted treatment, and hydrothermal treatment.Reference Sugantha, Ramakrishnan, Hermann, Warmsingh and Ginley9–Reference Xu, Liu, Ma, Qiao and Yuan17 Thin films of MnO2 have also been prepared.Reference Xia, Xiao, Lai and Lu18, Reference Ul Islam, Islam and Khan19 Each form when used for a specific application has its own advantages, such as battery electrodes, photocatalysts, supercapacitors, fuel cells, etc.
Hydrothermal route is one of the most extensively used methods to prepare nanostructured MnO2 with controlled morphologies. Wang and Li,Reference Wang and Li20 for example, reported the synthesis of single crystal β-MnO2 nanorods, and after simple addition of ammonium sulfate to the same reaction system, they were able to produce single crystal α-MnO2 nanowires. Song et al.Reference Song, Zhao and Zheng21 reported the synthesis of α-MnO2 urchins consisting of 150- to 200-nm-wide nanorods using sodium dodecyl sulfate as surfactant. By adjusting the volume of 1.0 M HCl solution, Zhou et al.Reference Zhou, Zhang, Wei, Zhao, Wang and Feng22 synthesized hollow urchins, columnar nanorod clusters, tetragonal nanotube clusters, and tetragonal nanorod clusters of α-MnO2. However, in most of the previously reported hydrothermal routes for the synthesis of MnO2, control over size and morphology was achieved either under highly acidic conditionsReference Zhang and Mu23–Reference Yu, Zhang, Wang, Wang and Ma30 or through the use of surfactants.Reference Song, Zhao and Zheng21, Reference Wu, Zhang, Ma, Li, Sun, Du and Yang31 The acidic medium seems to increase the reaction kinetics for phase transformation. Liu et al.,Reference Liu, Zhang, Zhang and Qian25 for instance, considered that a strong nitric acid solution was necessary for the synthesis of α-MnO2 nanowires and nanorods, as MnO2 was not formed at a reaction temperature of 120 °C in the absence of HNO3. Xu et al.Reference Xu, Kong, Zhou and Li24 prepared α-MnO2 hollow spheres and hollow urchins using H2SO4, and Umek et al.Reference Umek, Gloter, Pregelj, Dominko, Jagodic, Jaglicic, Zimina, Brzhezinskaya, Potocnik, Filipic, Levstik and Arcon29 synthesized 3D hierarchical α-MnO2 nanotubes using concentrated H2SO4. Among the nonacid hydrothermal routes, Cheng et al.Reference Cheng, Zhao, Song, Li, Ma, Chen and Shen3 reported the synthesis of β-MnO2 nano/microstructures via hydrothermal decomposition of Mn(NO3)2 solution, autoclaved, and heated at 160–180 °C for 3–72 h, Wang and LiReference Wang and Li32 used a comproportionation reaction between MnSO4 and KMnO4 to prepare in good yield, single crystal α-MnO2 nanorods of 20- to 80-nm diameter, Subramanian et al.Reference Subramanian, Zhu, Vajtai, Ajayan and Wei33 synthesized nanorods and plate-like morphologies of α-MnO2 by the hydrothermal treatment of MnSO4 and KMnO4 aqueous solutions, and Li et al.Reference Li, Pan, Chen and Li34 prepared α-MnO2 nanorods stabilized with water molecules and NH4+ species. However, development of an acid- and organic-free hydrothermal route with a simultaneous control over the phase and morphology of MnO2 nanostructures is still desirable, both from environmental and future applications point of view.
In an attempt to prepare MnO2 nanostructures under neutral conditions, we report the synthesis of urchin-like γ-MnO2, comprising radially aligned nanowires, and their subsequent phase transformation to α-MnO2 nanowires via a mild hydrothermal route. Here, pH of solution was not changed by the use of mineral acids. The effect of synthesis temperature and reaction time on the growth and morphology of MnO2 nanostructures have been investigated. The method is simple and the growth of MnO2 in different crystalline forms can be controlled by varying the reaction time.
II. EXPERIMENTAL
All reagents used were of analytical grade and used as received. In a typical synthesis, 1 g MnSO4.H2O and 1.5 g KClO3 powders were mixed in 70-mL distilled water and magnetically stirred until a clear solution of the two was obtained. The solution was transferred to a 100-mL Teflon-lined stainless steel digestion bomb, sealed and heated in an oven to 160 °C for 16–24 h, and then allowed to cool to room temperature in the oven. The black powder product was collected via suction filtration, washed thoroughly with distilled water, and dried under vacuum at 80 °C overnight.
Powder x-ray diffraction (XRD) patterns of the as-prepared samples were collected using a Rigaku Geiger flux diffractometer (Rigaku, Tokyo, Japan) with Cu Kα radiation (λ = 1.5406 Å). The size and morphology of the final products were determined from the scanning electron microscopy (SEM) images taken with JEOL JSM-5910 (JEOL, Tokyo, Japan). Energy dispersive x-ray (EDX) analysis was used to confirm the composition of the final products and the presence of any other metallic ions such as potassium. Fourier transform infrared spectroscopy (FTIR) transmittance spectra of the powders in KBr pellets were recorded in the range of 400–4000 cm−1 using NICOLET 6700 (Thermo Electron Co., Waltham, MA). The thermal properties of the samples were studied using simultaneous thermogravimetric and differential scanning calorimetric analyses (TG-DSC) using SDT-Q600 (New Castle, DE). Samples were heated at a constant rate of 20 °C/min to 1000 °C in a flow of nitrogen. For electrochemical characterization of γ-MnO2 urchins, the working electrode was prepared by mixing 80 wt% of the as-prepared γ-MnO2 powder with 15 wt% graphite and 5 wt% polytetrafluroethylene as a binder. A few drops of ethanol were also added to this mixture to make it more homogeneous. Stainless steel grids of 200 mesh size were used as current collector to fabricate the working electrode (1.0 × 1.0 cm2). The mixtures were pressed onto stainless steel grids by applying a load of 6 ton and then dried at 100 °C. Electrochemical measurements were carried out in a three-electrode beaker-type cell at 20 °C. A graphite rod of the same area as the working electrode and a saturated calomel electrode were used as the counter and reference electrodes, respectively. Measurements were made in 1.0 M Na2SO4 aqueous electrolyte using a potentiostat/galvanostat (model-2051, Amel, Milan, Italy).
III. RESULTS AND DISCUSSION
A. Structural and compositional analysis
Figure 1 shows the XRD patterns of the samples synthesized at 160 °C for 16 and 24 h. All the reflections in the XRD pattern of the product obtained after hydrothermal treatment for 16 h were indexed to the pure orthorhombic γ-phase of MnO2 consistent with the Joint Committee on Powder Diffraction Standards (JCPDS) 14-0644 (a = 6.36 Å, b = 10.15 Å, c = 4.09 Å). When the reaction time was extended to 24 h, all the XRD reflections were indexed to a pure tetragonal phase of α-MnO2 consistent with JCPDS 44-0144 (a = 9.956 Å, b = 2.860 Å). No other peaks related to impurity phases like β-MnO2 were observed showing that different polymorphs of MnO2 can be obtained via this method by extending the hydrothermal dwell time. The process involved in the formation of γ-MnO2 and its transformation to α-MnO2 can be formulated as:


Powder x-ray diffraction (XRD) pattern of the as-prepared (a) γ-MnO2 and (b) α-MnO2 nanowires.

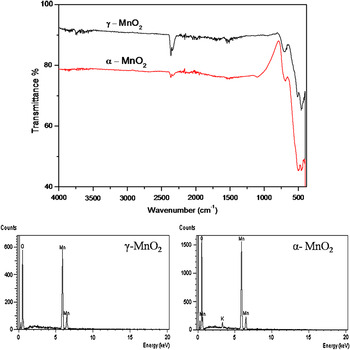
The chemical composition and purity of the as-prepared MnO2 was further investigated by FTIR and EDX analyses. In the FTIR spectra shown in Fig. 2, the absorption bands at 450, 513, and 702 cm−1 were assigned to the vibration of Mn–O bond. The absorption bands centered at 2361 cm−1 are due to the absorbed water and carbon dioxide.Reference Li, Chu, Liu and Dong5, Reference Zhang, Qiao, Hu and Zhou8 The composition as determined from EDX analysis revealed that only oxygen and manganese elements were present in γ-MnO2, whereas for α-MnO2 nanowires, 1.2 at.% potassium was also detected. K+ ions are considered to be the ideal cations to stabilize the 2 × 2 tunnel structure of synthetic α-MnO2.Reference Li, Rong, Xie, Huang and Feng35 Therefore, it may be suggested that the time-dependant incorporation of potassium cations lead to the transformation from γ- to α-phase.
Fourier transform infrared spectra and energy dispersive x-ray spectroscopy analysis of as-prepared MnO2 nanowires.

B. Morphological studies
SEM was used to examine the particle size and morphology of the samples. The representative low and high magnification SEM images of α- and γ-MnO2 nanowires are shown in Fig. 3. As shown in Fig. 3(a), radially aligned nanowires making up urchin-like microspheres with sphere diameter in the range of 4–5 μm were obtained after a reaction time of 16 h. The high magnification SEM images in Figs. 3(b) and 3(c) reveal that the urchin-like structures were composed of uniform nanowires with diameters in the range of 40–70 nm and lengths of several micrometers. After the reaction time was prolonged to 24 h, the spherical urchin-like morphology was lost and the product obtained consisted of loose, reoriented nanowires instead of pointing outward in a sphere [Figs. 2(d) and 2(f)]. It may also be noticed that some of the adjacent nanowires are joined together with their diameters lying in the range of 80–130 nm. In the formation of hollow α-MnO2 urchins, it has been suggested that the crystallites located at the inner cores due to their high surface energies get dissolve easily and nanorods located on the outer surface then acts as nucleation sites for the subsequent crystallization.Reference Li, Rong, Xie, Huang and Feng35 The loose structure of α-MnO2 nanowires and their increased diameters in our case indicate a similar dissolution–recrystallization process of the core particles in urchin-like structure. With the increase in reaction time, the inner core of the urchins gets dissolved and the outer nanowires then grow in size at the expense of core particles via Ostwald ripening.Reference Li, Rong, Xie, Huang and Feng4, Reference Xu, Kong, Zhou and Li24 Hence, the morphological changes seem associated with phase change, resulting in reorientation of the nanowires along with an increase in wire diameter. The growth mechanism of γ-MnO2 urchins is discussed later in “Evolution process based on SEM and XRD.”
Low and high magnification scanning electron microscopy (SEM) images of (a)–(c) γ-MnO2 and (d, e) α-MnO2 nanowires.

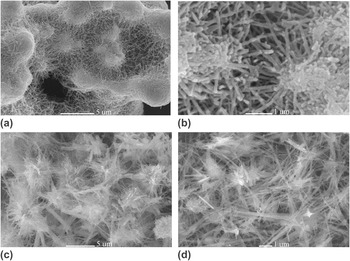
The SEM images in Fig. 4 show the effect of temperature on the morphology of MnO2 prepared at different temperatures and a constant holding time of 16 h. The low magnification SEM image of MnO2 obtained at 130 °C shows a network of shorter MnO2 nanowires, knotted together at their ends with diameters in the range of 30–50 nm [Figs. 4(a) and 4(b)]. The product obtained at a synthesis temperature of 190 °C has mainly a fibrous morphology along with a few microrods [Figs. 4(c) and 4(d)].
Low and high magnification SEM images of MnO2 synthesized at (a, b) 130 °C and (c, d) 190 °C.

C. Thermal analysis
Thermal stability and phase evolution of MnO2 was investigated by TG-DSC measurements as shown in Fig. 5. Except for the amount of mass loss, both γ- and α-MnO2 samples showed similar TG analysis curves. Three distinct endothermic peaks at 130, 590, and 875 °C were observed. The mass loss up to 130 °C is due to the loss of physisorbed water. A linear decrease in mass with increase in temperature from 150 to 450 °C is attributed to the loss of structural water. The weight loss for γ- and α-MnO2 in this temperature range was 1.1 and 4.4%, respectively. The two other major mass losses at 590 and 875 °C were due to the evolution of lattice oxygen resulting in the decomposition of MnO2, first to Mn2O3 and then to Mn3O4 according to the following equationsReference Hashem36:


Thermogravimetry and differential scanning calorimetry curves of γ- and α-MnO2 synthesized at 160 °C.

D. Evolution process based on SEM and XRD
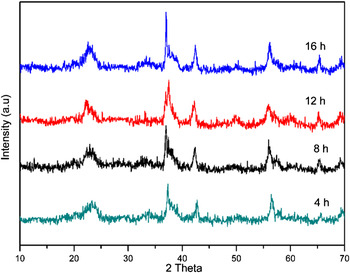
The formation mechanism of MnO2 nanowires was investigated by observing the effect of reaction time on the phase and morphology of the as-prepared products. The samples thus obtained were characterized by XRD and SEM analyses. Figure 6 shows the XRD patterns of the products obtained after 4, 8, 12, and 16 h, and the corresponding SEM images are shown in Fig. 7. XRD reflections show that the γ-phase of MnO2 was formed after a reaction time of 4 h and extending the reaction time to 16 h has little effect on the crystallinity of the final product. The broad and weak reflections indicate that the 1 × 2 tunnel structure in the γ-MnO2 was poorly developed. It is known that under hydrothermal conditions, the symmetrical 2 × 2 tunnel structure is more stable than the unsymmetrical 1 × 2 structure. The 1 × 2 tunnel structure of γ-MnO2 therefore collapse and the more stable 2 × 2 tunnel structure of α-MnO2 is formed. A similar phase transformation from γ- to α-MnO2 has been reported in literature.Reference Wei, Konishi, Zhou, Sugihara and Arakawa6, Reference Li, Zhou, Zhou, Shen and Chen16, Reference Jia, Yuping, Hui, Xiaogang and Shunhua37 From the SEM images in Fig. 7, it can be seen that a strong correlation exist between the hydrothermal dwell time and the resulting nanostructure. The initial products of the reaction lasted for 4 h consisted of lamellar structures. Some thin belt-like and needle-like structures protruding from the edges of these lamellae can be observed in Fig. 6(a). Extending the reaction time to 8 and 12 h resulted in an increase in the density of nanowires along with the loss of lamellar structure. Further extending the reaction time to 16 h leads to the formation of individual nanowires, self-assembled into urchin-like spheres [Fig. 7(d)]. These results suggest that the growth of MnO2 nanowires proceeds through the rolling-broken-growth mechanism, previously proposed for the growth of 1D and 3D MnO2 nanostructures synthesized via hydrothermal route.Reference Wu, Xie, Wang, Yang and Li38–Reference Wang and Li40 During hydrothermal synthesis, the MnOx units, which first appear in the solution, undergo a condensation process to form lamellar γ-MnO2. Under elevated hydrothermal pressure and temperature, the thin lamellae tend to curl and, in the course of time, split into nanowires. K+ ions may be responsible during the following hydrothermal process for the phase transformation because no additional H+ or OH–1 were added. K+ ions can act like a template in forming and stabilizing the 2 × 2 tunnel structure of α-MnO2.Reference Shen, Suib and O’Young41 In the following hydrothermal process, the shorter nanowires redissolve and the larger ones grow in sizes via Ostwald ripening as discussed earlier.
XRD patterns of the products obtained at different reaction times.

SEM images of the products obtained after (a) 4 h, (b) 8 h, (c) 12 h, and (d) 16 h of reaction times.

E. Electrochemical tests of γ-MnO2 urchins
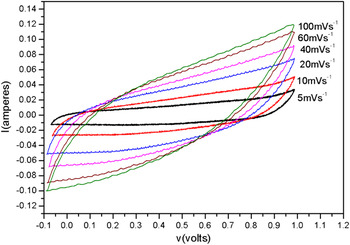
Preliminary studies on the electrochemical characteristics of γ-MnO2 urchins were evaluated by cyclic voltammetry in a three-electrode cell. The cyclic voltammograms in 1.0 M Na2SO4 solution in the voltage range of –0.1 to 1.0 V are shown in Fig. 8. Typical rectangle-like voltammograms at various scan rates from 5 to 100 mVs–1 is indicative of the good pseudocapacitive behavior of the γ-MnO2 urchins. No obvious redox peaks were observed in the working potential range, showing that the electrode is charged and discharged at a pseudo-constant rate over the entire cycle. Although an increase in scan rates up to 100 mVs–1 slightly distorts the capacitance–voltage (CV) curves, the good electrochemical capacitive performance is still evident. The specific capacitance was calculated from the CV curves using the equation, C = I/mV, where m is the mass of γ-MnO2 in the working electrode, V is the potential scan rate, and I is the current response, obtained by integrating area of the CV curves in Fig. 8. At a scan rate of 5 mVs–1, the urchins exhibit a specific capacitance of 225 F·g−1 and at a scan rate of 100 mVs–1, the specific capacitance decreases to 152 F·g−1. This decrease in specific capacitance with increase in scan rate is typical for MnO2 materials and is attributed to reduced accessibility of the sodium cations for the active electrode material at higher scan rates. Maintaining about 67% of its capacitance upon increase in scan rate from 5 to 100 mVs–1 indicates the good rate capability of γ-MnO2 urchins. Further detailed investigations of the capacitive behavior of the prepared MnO2 nanostructures are in progress.
Cyclic voltammograms of γ-MnO2 urchins at various scan rates in 1.0 M Na2SO4 solution.

IV. CONCLUSIONS
By controlling the reaction time and temperature, various morphologies of MnO2 were prepared through a mild hydrothermal method. The initially formed lamellar MnO2 gradually transformed to nanowires assembled in urchin-like shapes and then on prolonged reaction times finally give rise to lose nanowires, accompanied by crystal type transformation from γ- to α-MnO2. Results indicate that the various morphologies evolved through the rolling of the lamellar MnO2 and a subsequent phase transformation from γ- to α-phase with the incorporation of K+ ions. This mild approach may provide a convenient route for the synthesis of MnO2 nanowires to be used in catalysis and electrochemical capacitors.
ACKNOWLEDGMENTS
The authors thank Central Diagnostic Laboratories (CDL), Pakistan Institute of Nuclear Science and Technology, for providing the TG-DSC facility. Financial support from the Higher Education Commission of Pakistan for Ph.D. fellowship (Y. Khan) is highly acknowledged.