Since The American Voter it has been argued that voters rely on party identification and impressions about candidate image when deciding how to vote, whilst ideology, values or opinions on specific policies play at most a muted role. There is indeed considerable evidence that partisanship shapes voters’ political views. A growing body of studies stemming originally from the 1960sFootnote 1 and re-energized more recentlyFootnote 2 demonstrates the centrality of partisanship in shaping issue/policy preferences,Footnote 3 issue-proximity,Footnote 4 issue salience,Footnote 5 government performanceFootnote 6 and perceptions of the economy.Footnote 7 However, partisanship can itself be thought of as endogenous. It seems unlikely that people randomly attach themselves to parties.
In the British context, social background attributes such as class were at one time assumed to anchor partisan orientations,Footnote 8 but they have lost their power to shape party preferences in a depolarized party system in which relevant choices are no longer provided.Footnote 9 They thus provide neither strong predictive power nor a mechanism for understanding why people gravitate to different political parties. In recent decades, however, various authors have argued that it is possible to identify core political values that are coherent and stable in which individuals hold fundamental and enduring attitudes towards general moral and political principles like equality.Footnote 10 It is argued that such values inform preferences across a wide range of specific issues. For Feldman, these enduring core beliefs can partly account for an individual’s attitudes towards the more transient political issues of the day.Footnote 11 This occurs because values provide a heuristic that can be applied to a set of political decisions. As ‘cognitive misers’,Footnote 12 voters need only assess the relevance of the core value to such decisions rather than draw upon political attitudes to particular issues on which information is often costly to obtain.
If people hold fundamental and enduring attitudes towards economic and political principles, such as equality, that influence their attitudes towards political issues, it is also likely that these values can shape their partisanship. Such central elements of political belief systems can be expected to influence party preferences as voters update their partisan identities to correspond with their values: if values ‘predispose us to favor one particular political or religious ideology over another’,Footnote 13 it is plausible that they can predispose people to favor one political party over another. Consistent with this idea, when opinions on political issues are measured via multiple indicators of core values they have been shown to have powerful effects on party choice in cross-sectional analyses.Footnote 14
These observed patterns of association do not in themselves establish whether values influence party choice or vice versa. If someone has a commitment to limited government they are likely to find parties of the right appealing and move in that direction over time, while someone who believes in big government should find parties of the left appealing. Party support should be updated to fit with core values.Footnote 15 Equally, however, partisanship could provide a cue that shifts responses on values over time, with Labour supporters becoming, for example, more pro-redistribution, and Conservative partisans more opposed to redistribution if the parties themselves shift in those directions.
If, as we shall argue, core values are stable aspects of voters’ political belief systems, they should lead to vote switching in response to perceived movements by parties either towards or away from valued goals. Given that perfect equilibrium is unlikely to exist at any point in time – electoral politics is not a system preserved in aspic – the tension between core values and party signals provides an incentive to switch from one party to another, closer to a voter’s core values. What we propose is thus not precisely analogous to the thermostatic modelFootnote 16 of a responsive electorate, in which the average expressed policy preference shifts in the opposite direction to government policy. Instead we propose that voters will sort themselves by switching their party preference in response to such party movements.Footnote 17
The only study we know of that examines these dynamics of values and partisanship directly is that of Goren,Footnote 18 who examined a range of core principles in a multi-dimensional analysis of US panel surveys and found that partisanship had a stronger influence than core values in cross-lagged models. Goren’s analysis suggests that, as in the Michigan model, partisanship is ‘the unmoved mover’ of values. However, he studies US voters, and previous studies have suggested that partisanship has a stronger influence, at least on policy preferences, in the USA than in Britain.Footnote 19 There is also a long-standing debate on the extent to which partisanship is as distinct from vote preference in Britain as it is in the USA,Footnote 20 which could also explain why its relative influence might differ. We return to these issues in the discussion.
In the rest of the article we develop and test the argument that core values dynamically shape partisanship rather than vice versa. We proceed by first examining the nature of core values in the British context and why these values are likely to be more influential than partisanship. We also consider the extent of this disproportionate influence across political contexts and for different groups of voters. The empirical analysis examines the association between values and partisanship by following respondents over sixteen years across multiple survey waves throughout the 1990s and 2000s to establish which has the stronger effect: core values or party identification. We show that in both polarized and depolarized electoral contexts core values drive partisanship and there is no significant reciprocal effect. Likewise, core values have strong effects on partisanship across the age structure: for both young and old, values matter for partisanship, but not vice versa. This pattern also holds across diverse sectors of the electorate: not just among the affluent and highly educated, but amongst those who are typically less involved in politics, such as the poor and less educated. Core values thus appear to provide a generalized decision heuristic that limits preference shaping by parties and can provide a source of political stability or change.
Core Values in the British Context
Rokeach argued that political ideologies are ‘fundamentally reducible, when stripped to their barest, to opposing value orientations concerning the political desirability or undesirability of freedom and equality in all their ramifications’.Footnote 21 Consistent with this idea, analyses of attitudes in Britain have repeatedly found that opinions on issues such as income redistribution, government intervention and the collective provision of public goods are associated along such lines of freedom versus equality. The notion of core beliefs and values has been introduced to make sense of these patterns.Footnote 22 These core beliefs are not the same as an overarching left–right ideology, as views on economic equality typically have little empirical connection to those on social and cultural issues. The latter involve distinct and often conflicting moral principles.
In the period we are examining, and for several decades previously, the axis of division in British politics is very much about redistribution, government intervention and free enterprise. In other words, it is about economic and political equalityFootnote 23 in which ‘the basic logic of party competition in Britain remained similar to that which held in the 1950s […] a predominantly left-right dimension of competition’.Footnote 24 The Labour Party has generally advocated leftist, redistributive positions, while the Conservative Party has a long-standing reputation for holding more right-wing, free market positions.Footnote 25 These values have been central to British political debate and public responses to it for decades. But are they likely to be shaped by the party, or vice versa?
Core political values are thought to develop early in the adult life cycle and to persist over time, transcending the influence of short-term political events and party changes. If values are stable there is less room for them to be influenced by partisanship. Conversely, the greater stability of values compared with partisanship should provide a basis for updating partisanship in response to political changes. In other words, influence should run from values to party, not vice versa. A first step is therefore to examine the stability of values and partisanship. A second is to examine whether core political values influence the updating of party identification or vice versa.
Hypothesis 1: (a) core values should be more stable than partisanship, and (b) the cross-lagged effects of core values on partisanship should be stronger than vice versa.
We also examine potential conditioning influences on the relationship between values and partisanship.
Contextual Variation
In the United States, panel-based research on the temporal inter-relationship between political attitudes and partisanship has examined this relationship in varying contexts. Carsey and Layman look at the effect of issue saliency on the relationship between attitudes and partisanship,Footnote 26 and show that issues have more impact when they are salient.Footnote 27 Dancey and Goren demonstrate the impact of media attention in accentuating the strength of updating between issues and partisanship,Footnote 28 while Highton and Kam find that issue polarization influences the direction of influence in updating beliefs: issue convergence appears to weaken the effect of issues on partisanship as it strips away the relevance of issue positions to party choice.Footnote 29
In the British case, the main parties ideologically converged in the mid/late 1990s,Footnote 30 and converged in their social composition.Footnote 31 This suggests that the impact of issues on partisanship should weaken in a more depolarized context. Milazzo et al. find that the effects of issues on partisanship declined over time as the British party system depolarized.Footnote 32 However, most of these studies examine attitudes towards potentially transient political issues of the day rather than underlying values. To the degree that core values are more central elements of political belief systems than partisanship, they should function as heuristics that provide a basis of party choice even when parties are not polarized. Coefficients may generally be of weaker magnitude, but the strength of influence of core values relative to that of partisanship should persist.
Most of the period covered by the British Household Panel Study (BHPS) has been characterized by similarity between the main parties in their respective positions on inequality and redistribution, as ‘New Labour’ muddied the waters between itself and the Conservatives and thus weakened the distinctiveness of their signals to voters.Footnote 33 However, the period before 1997 was marked by larger differences between the main parties. The 1997 election represented a step change in perceptions of party convergence.Footnote 34 To examine the contextual robustness of the relative impact of values on partisanship we can therefore compare models for the period before the 1997 election with those for 1997 onwards. Although we might expect to see generally weaker effects in the latter, depolarized context, core values should still be relatively more stable and have relatively stronger cross-lagged effects than partisanship.
Hypothesis 2: in both more and less polarized contexts (a) core values should be more stable than partisanship and (b) the cross-lagged effects of core values on partisanship should be stronger than vice versa.
Variation by Voter Characteristics
Younger and Older Voters
Central to an understanding of the relative centrality of values and partisanship to political beliefs is the timing of their emergence in someone’s political understanding. If attitudes are well formed – as indicated by their stability – at an earlier point in adult political socialization they are more likely to influence the adoption of attitudes formed at a later point.Footnote 35 If partisanship precedes and influences someone’s values we would expect to see evidence of its cognitive presence earlier in the life cycle. If values influence partisanship then we would expect them to stabilize earlier and condition responses to partisan cues.
Hypothesis 3: (a) core values should be more stable than partisanship at an earlier age, and (b) the cross-lagged effects of core values on partisanship should be stronger than vice versa.
More or Less Educated Voters
If core values are widespread and meaningful we would expect them to be consequential for partisanship throughout the electorate. Both ‘sophisticated’ and ‘unsophisticated’ voters should hold values independently of partisan cues. So although we could expect the less politically aware to have less stable core values than the more aware,Footnote 36 those values are still likely to be relatively more stable than, and influential on, partisanship than vice versa. Not only can political sophisticates be expected to bring their partisan attachments into line with their values, so can the politically unsophisticated. We test this by using educational level as a proxy for political sophistication to examine the relative impact of core values and partisanship among politically informed and uninformed voters.Footnote 37
Hypothesis 4: The (a) stability and (b) strength of the cross-lagged effects of core values on partisanship will be stronger than vice versa regardless of level of education.
The Rich and the Poor
In addition to their appeal to the less politically involved, we might also expect core values that concern, specifically, inequality and redistribution to provide a heuristic that shapes the political preferences of voters across income levels. Income inequality is likely to make these core values relevant to political preference formation via a desire for redistribution by the poor, and endorsement of the free market and opposition to redistribution by the wealthy. Redistribution taps into the concerns of both rich and poor, even if in opposing ways.Footnote 38 It is perhaps not surprising then that analyses using very similar instruments to the core values operationalized here find stable and persisting divisions between income groups on redistribution, even when the parties themselves have depolarized on these issues.Footnote 39
Hypothesis 5: The (a) stability and (b) strength of the cross-lagged effects of core values on partisanship will be stronger than vice versa across income levels.
Method
Data
As we are interested in the long-term relationship between an individual’s party identification and their core values, we use panel data that tracks individual-level changes over a long time period. For this we use data from the BHPS, an annual face-to-face, stratified random sample survey of occupants of British households that began in 1991.Footnote 40 In addition to numerous questions on the socio-economic status of households and individuals, the BHPS asks about respondents’ partisanship. The survey also includes a six-item socialist/laissez faire scale of core values developed by Heath et al.Footnote 41 in seven waves between 1991 and 2007.Footnote 42 This extensive time coverage gives us the opportunity to analyze the individual-level dynamics of core values and party identification across a lengthy period in British politics.
The BHPS contains respondents from England, Scotland, Wales and Northern Ireland, but we restrict our sample to respondents domiciled in England. The ‘two-party-plus’ system pitting Labour against the Conservatives with the Liberal Democrats as the main minor party operates in pure form only in England. Elsewhere, parties focused on nationalist concerns make the choice set more complex. The number of observations is also reduced for model estimation purposes by only including respondents who took part in at least three waves.Footnote 43 This leaves 7,582 respondents, 80 per cent of whom took part in the first wave of the panel in 1991.
Measuring Core Political Values
The labels ‘left’ and ‘right’ (or ‘liberal’ and ‘conservative’) can be employed as shortcuts that help citizens connect their underlying ideological/value predisposition to specific policy preferences.Footnote 44 Similarly, political parties and commentators use these labels to describe whole packages of policies.Footnote 45 However, it is unclear how respondents interpret such labels, so we do not measure them by asking people whether they are ‘left wing’ or ‘right wing’,Footnote 46 but instead use six observed indicators that refer to examples of either a left- or right-wing value position. In this we follow, for example, Ansolabehere et al. who use multiple survey items to measure latent dimensions of values and beliefs, and demonstrate their predictive validity for vote choice in US presidentialFootnote 47 and congressionalFootnote 48 elections.
Heath and his colleagues developed and validated a scale to measure core values by drawing up a list of items designed to cover the main theoretical components of the core ‘socialist versus laissez faire’ value domain.Footnote 49 To measure socialist/laissez-faire values they designed items to measure collectivism and individualism, government intervention and free enterprise, and economic and political equality while maintaining acceptable levels of inter-item reliability. These items were asked in an agree/disagree format with five response categories. Since the aim was to design scales that could be used over a period of many years, the items did not address topical policy issues, but were framed as questions about general principles that could be asked in future studies when the specific political issues of the day might have changed. Most items were designed specifically for the scale. This six-item scale was consequently included in multiple waves of the BHPS, in which respondents were asked whether they agreed or disagreed (strongly agree 1; agree 2, neither agree nor disagree 3; disagree 4; strongly disagree 5)Footnote 50 with the following statements:
A. Ordinary people get their fair share of the nation’s wealth (reversed)
B. Major public services and industries ought to be in state ownership
C. There is one law for the rich and one for the poor
D. Private enterprise is the best way to solve Britain’s economic problems (reversed)
E. It is Government’s responsibility to provide a job for everyone who wants one
F. Strong trade unions are needed to protect employees working conditions and wages
Measuring Party Identification
In each wave respondents received the following question battery: ‘Generally speaking, do you think of yourself as a supporter of any one political party?’ Respondents who answer ‘yes’ are asked ‘which one’. Respondents who answer ‘no’ are asked two follow-up questions that first ask if they think of themselves as ‘a little closer to one political party than to the others’. If they still reply ‘no’, they are asked ‘if there was a General Election tomorrow, which political party do you think you would be most likely to support’. In keeping with much of the literature,Footnote 51 we only consider as partisans those who responded ‘yes’ to the first two questions, excluding respondents who only express support for a party in the event of an election. At each time point, respondents are assigned to the following: (1) Labour, (2) Conservative, or (3) not supporting any of the major parties. This latter category includes 43 per cent of the respondents: 9 per cent identify with the Liberal Democrats, 1 per cent with any of the other smaller parties and 33 per cent have no party identity. As shown in Appendix 1, analyses distinguishing Liberal Democrats produce substantively the same results.
Measurement of Conditioning Variables and Controls
Numerous analyses of British Election Survey (BES) data suggest that a range of socio-demographic characteristics are important for capturing individual differences in both party support and values,Footnote 52 and we model partisanship and values as a function of these observed individual attributes. Age is coded as categorical, dividing respondents into six categories (15–24, 25–34, 35–44, 45–54, 55–64, 65+) to allow comparison of effects across age groups. Income is measured as total individual annual income from wages and transfers. We use income quintiles for each panel wave, dividing the respondents into five groups from the bottom to the top 20 per cent annual income.Footnote 53 Education is coded as the respondent’s highest qualification achieved. We recoded the original thirteen-category variable to a six-category education variable with the following highest qualifications: 1. no qualifications, 2. less than O-levels, 3. O-levels/GCSE, 4. A-levels, 5. other degree (for example, teaching or nursing) and 6. university degree. Other socio-demographic controls included in the BHPS include gender, social class and housing status. Social class is measured using the European Socio-economic classification.Footnote 54 Besides using detailed occupational codes (based on ISCO88), it uses an individual’s supervisory status and (for employers) number of employees to determine class positions. Housing status distinguishes between homeowners, mortgage holders, private renters and those in social housing.
Analysis
Although political values can be thought of as lying on a continuum, typically measured via additive Likert scales, we focus our primary analysis on their qualitative character. It is common to talk of left versus right, and these constructs are likely to cluster responses to individual items accordingly. In the same way that we can examine whether people update their partisanship by, for example, moving from being a Labour to a Conservative partisan, we can examine whether people move from being left-wing to being right-wing in their value positions from one time point to the next. Since we also treat choice of party as nominal and are primarily interested in switching between left- and right-wing political choices, this approach allows direct comparisons of the strength of effects of values on partisanship. For the cross-lagged analysis, in particular, this degree of measurement equivalence provides important information for interpreting the relative strength of their effects.
For this purpose we use latent class analysis (LCA), a categorical data reduction method analogous to factor analysis.Footnote 55 The main feature of LCA is the ability to investigate relationships among categorical or ordinal variables assuming local independence between these indicators. This can be undertaken for the six value items to reveal their latent structure, and also for the partisanship measure. Numerous previous analyses of the dynamics of party identification have found measurement error to be endemic.Footnote 56 We can therefore specify ‘true’ partisan identification as a latent variable measured imperfectly by observed individual choices. This results in a single-indicator latent variable model in which partisan identification, the indicator, is measured on multiple occasions.Footnote 57
LCA Estimation
Our latent class model of the latent value position of respondent i can be expressed as:

where P(y i) is the probability of a specific observed response pattern of the six indicator variables j y i = (y 1i ,..., y 6i).Footnote 58π jc represents the probability of respondent i being in one of the discrete latent classes C (c = 1,2,3), and the local independence assumption is met by P(y i), as the specific response to each single survey item by each respondent (y i) solely depends on the latent class into which a respondent is classified once measurement error is taken into account.Footnote 59 Each of our six indicators is linked to the latent value δ I via conditional probabilities, which are comparable to factor loadings in a factor analysis. The conditional probabilities of the model and the distributions of the three latent classes – leftist, centrist and rightist – on the six-item additive index score are reported in Appendix 3, which also presents further information on the LCA analysis. The latent classes distinguish between the value positions very effectively. For example, 94 per cent of respondents who were classified as left leaning agreed that ‘public services ought to be state owned’, while 63 per cent of those classified as right leaning disagreed with this statement. The remaining items have similar conditional probabilities depending on the classification of respondents. The modal category for each classification is always correct.
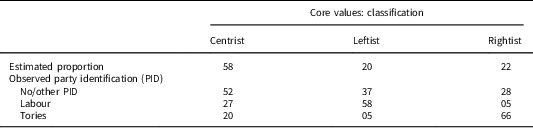
Table 1 presents the mean distribution of political values across these three different classes. It can be seen that 58 per cent of the respondents of the BHPS are classified as centrist, about 20 per cent have coherent leftist values, and 22 per cent rightist political values. Table 1 also reports the proportion of party identifiers in each of the latent classes. It shows that the values classification is able to distinguish the partisanship of each class very effectively. The modal category of each latent class is as expected. For example, 58 per cent of leftists are also Labour partisans, while only 5 per cent support the Conservative Party. The clear ideological distinction of partisans is also obvious for those with right-wing values. Those classified as centrist are most likely not to have a party identification or to support a smaller party.
Latent values and partisanship (percent)

Modeling the Dynamics of Partisanship and Values
We use cross-lagged models to analyze the dynamics of partisanship and values. These allow us to simultaneously estimate (1) the effect of previous partisanship on current values while controlling for previous values and (2) the effect of previous value positions on partisanship, while controlling for previous partisanship. As we employ discrete categories – leftist versus rightist values, Labour versus Conservative partisanship – we use maximum likelihood estimation in a series of multi-nominal logit models. The final cross-lagged model of values and partisanship (both treated as categorical latent variables) can be summarized as follows:


where PID i in Model 2 is the observed party identification of respondent i, which is conditioned on the observed response pattern of the six value position indicators j y i = (y 1i ,..., y 6i) and covariates x i,0 on the initial state of partisanship. This model specifies the nominal-level variable measuring latent party support θ i,t, to be a function of partisanship as reported by the BHPS respondent PID it and a level of measurement error that is assumed to be time invariant for reasons of identification ($P{\rm (}PID_{{it}} {\rm \,\mid\,} \theta _{t} )$ ). The value position of a respondent i is measured by the latent variable δ it, described in Model 1 above. The central parts of Models 2 and 3 are the transition probabilities (partisanship: $P{\rm (}\theta _{t} {\rm \,\mid\,} \theta _{{t{\minus}1}} ){\hbox{;}}\, $
 values: $P{\rm (}\delta _{t} {\rm \,\mid\,} \delta _{{t{\minus}1}} )$
 ) that account for the stability of our two dependent variables and most importantly the estimated cross-lagged effects of values on partisanship ($P{\rm (}\theta _{t} {\rm \,\mid\,} \delta _{{t{\minus}1}} )$
 ) and partisanship on values ($P{\rm (}\delta _{t} {\rm \,\mid\,} \theta _{{t{\minus}1}} )$
 ). As the models show, we control for relevant covariates x i0 predicting a person’s (latent) partisanship (θ 0) and values (δ 0) when they first enter the panel.
Results
The Dynamics of Partisanship and Core Values
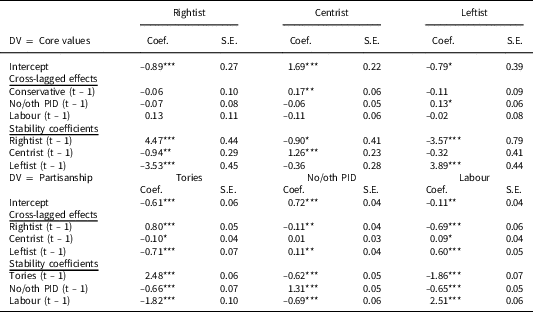
First we examine and compare the levels of stability of partisanship and core values, testing Hypothesis 1a. Models estimating these coefficients are presented in Table 2. These use effect coding which, unlike dummy coding, uses ones, zeros and minus ones to convey all of the necessary information on group membership (for example, party support and core values). This allows us to directly compare the effects of all categories rather than having to set one of the categories as the reference point. In this model, both latent variables are dependent (at time t) and independent variables (at time t − 1) simultaneously.
Cross-lagged models: estimates of transition probabilities

Source: BHPS 1991–2007.
Note: the model includes the effects of socio-demographic covariates on initial partisanship and core values when respondents entered the panel. The coefficients are reported in Appendix 4. Effect coding. * p < 0.05; **p < 0.01; *** p < 0.001
The stability coefficients are shown in the top half of Table 2. These are the lagged effect of partisanship on current partisanship and the lagged effect of core values on current values. We find that, consistent with Hypothesis 1a, values are about twice as stable as partisanship.
Table 2 also displays the cross-lagged effects on the updating of the two dependent variables. With the exception of two cases, party identification does not affect core values, whereas (as predicted in Hypothesis 1b) core values have strong, consistent and significant effects on changes in partisanship. The direction is as expected: right-wing respondents are more likely to identify with the Conservatives in the next wave and less likely to identify with Labour, and vice versa.
Core Political Values and Partisanship in Polarized and Depolarized Contexts
To test whether these results are consistent across political contexts we split the panel into two periods. The first period includes three panel waves from 1991–1995 and covers the Conservative government. The second time period includes the four panel waves between 1997–2007 when ‘New’ Labour was in government and the two main parties converged ideologically, whether measured using manifesto data,Footnote 60 expert surveysFootnote 61 or public perceptions.Footnote 62
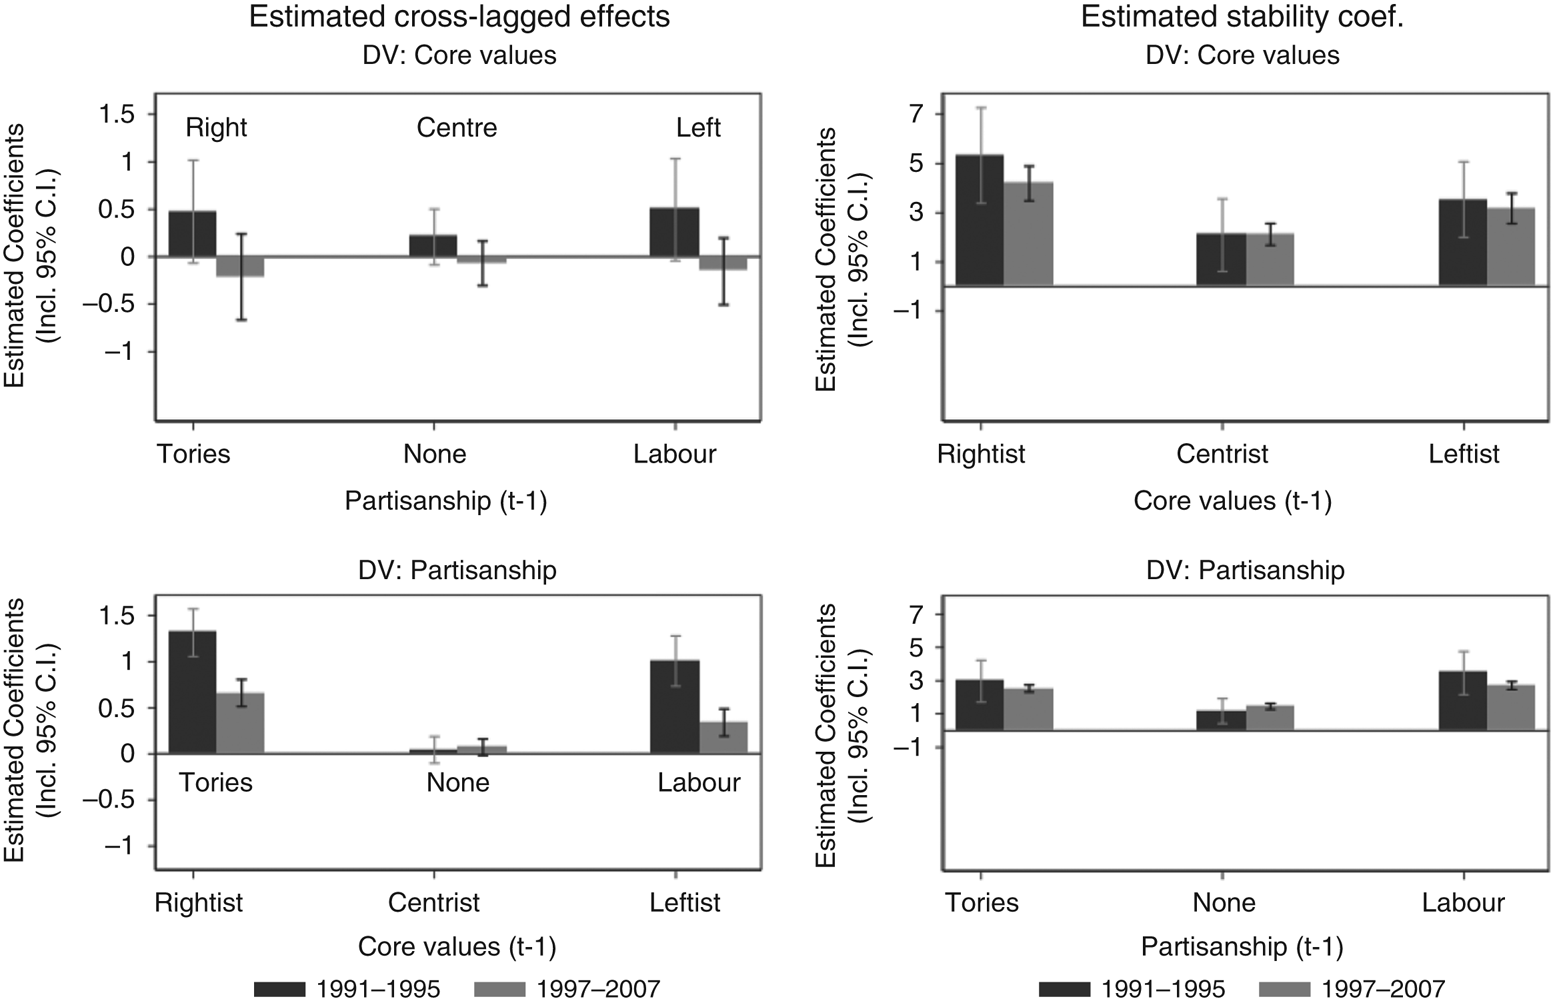
The findings are summarized in Figure 1, which plots logit coefficients and corresponding 95 per cent confidence intervals of stability and cross-lagged models for the earlier (black bars) and later periods (gray bars).Footnote 63 The two panels on the left plot the cross-lagged effects, comparing the size of the effect for the two periods for core values (upper panel) and partisanship (lower panel), while the panels on the right plot the stability coefficients for core values (upper panel) and partisanship (lower panel). For this and the following figures we use different scales to compare more easily stability coefficients and cross-lagged effects, as the former are much larger than the latter.
Cross-lagged models: estimates on transition probabilities of ideological and partisan consistent responses Note: includes 95 per cent confidence intervals. Full results available in Appendix 5.

The top-left panel of Figure 1 shows that partisanship does not affect core values. This is the case in both more (1991–1995, black bars) and less (1997–2007, gray bars) polarized periods. However, the lower-left panel reveals a clear difference between the two periods. In the more polarized context the effects are significantly stronger. For example, in the New Labour era characterized by depolarization, the effect of being leftist on subsequent Labour support is only b = 0.34 (p < 0.001), whereas the effects of leftist values were three times as strong during the 1991–95 period (b = 1.01, p < 0.001). Similarly, the lagged effect of right-wing core values on support for the Conservatives halved between the 1991–1995 (b = 1.30, p < 0.001) and 1997–2007 periods (b = 0.66, p < 0.001). In contrast, we find no significant differences in the stability of either core values or partisanship between the two periods.
Sources of Heterogeneity: Core Values and Partisanship Across Age, Education and Income
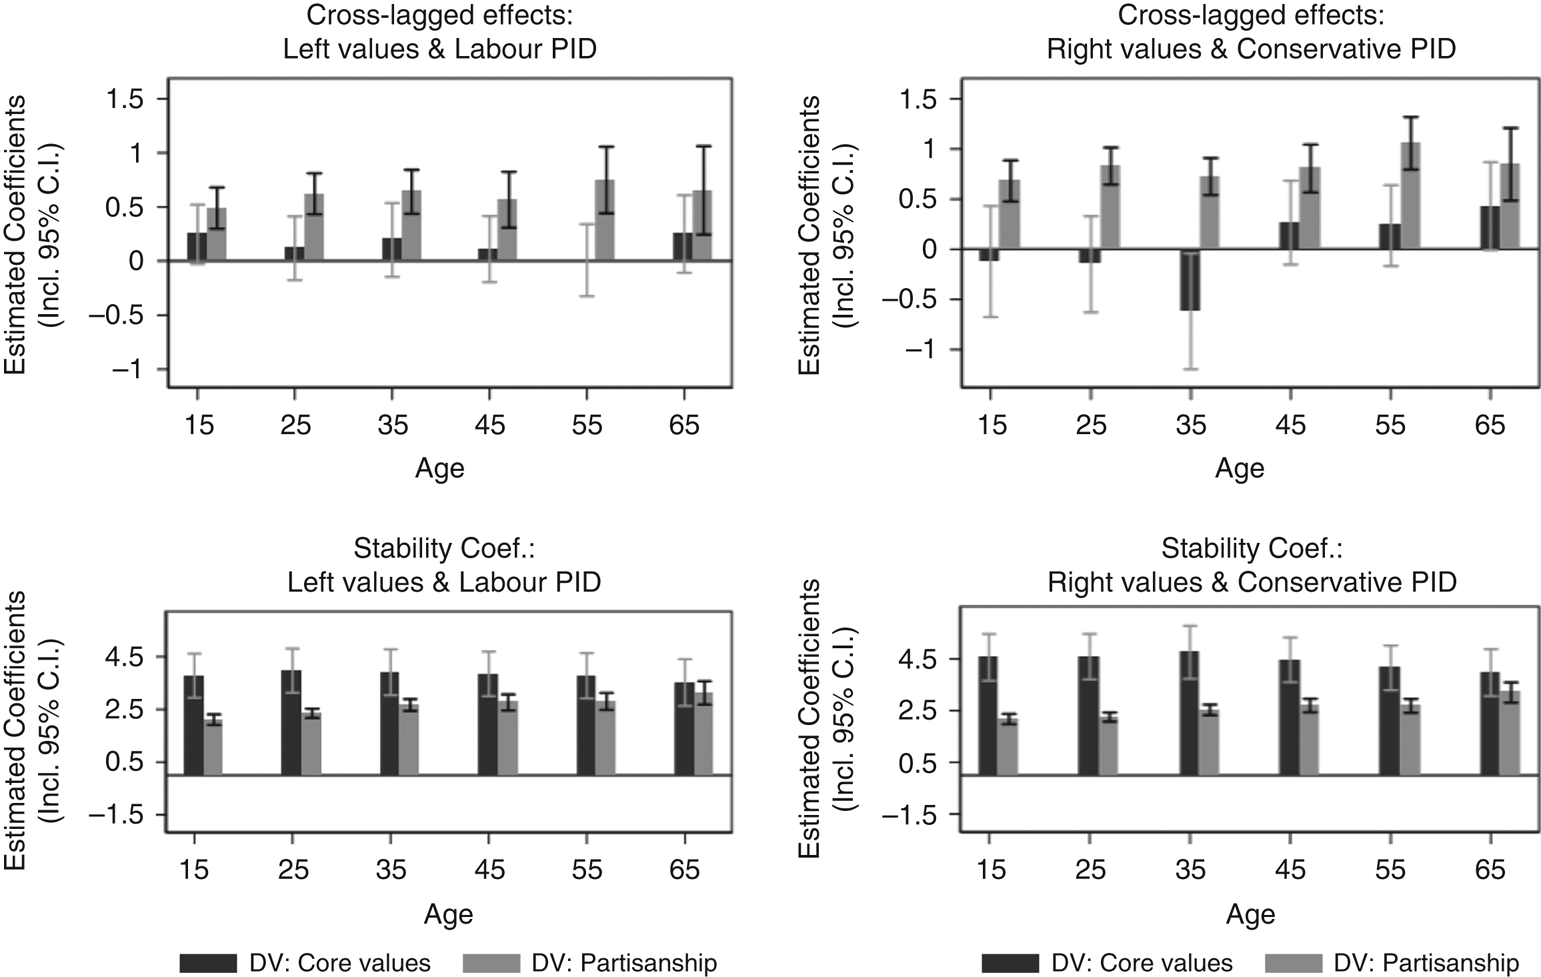
We next conditioned the stability and cross-lagged estimates by age. The results are summarized in Figure 2, which shows that core values drive partisanship to a much greater extent than vice versa across all age groups. The cross-lagged effects of party identification on core values are jointly not even significant (Wald-test (df): 32.4 (24)). Strikingly, the stability coefficients of core values are also very similar across all age groups, which suggests that core values do indeed develop early in life and remain stable thereafter. In contrast, the figure shows the well-documented pattern of increasing partisanship stability with age from a relatively low starting point. We see, for example, that the stability coefficient in Labour support increases from b = 2.11 (p < 0.001) among 15–24 year olds to b = 3.13 (p < 0.001) among those 65 and older. However, with the sole exception of respondents aged 65 and over, core values are significantly more stable than partisanship.
Cross-lagged interactions and stability coefficients conditioned on age Note: includes 95 per cent confidence intervals. Full results available in Appendix 6.

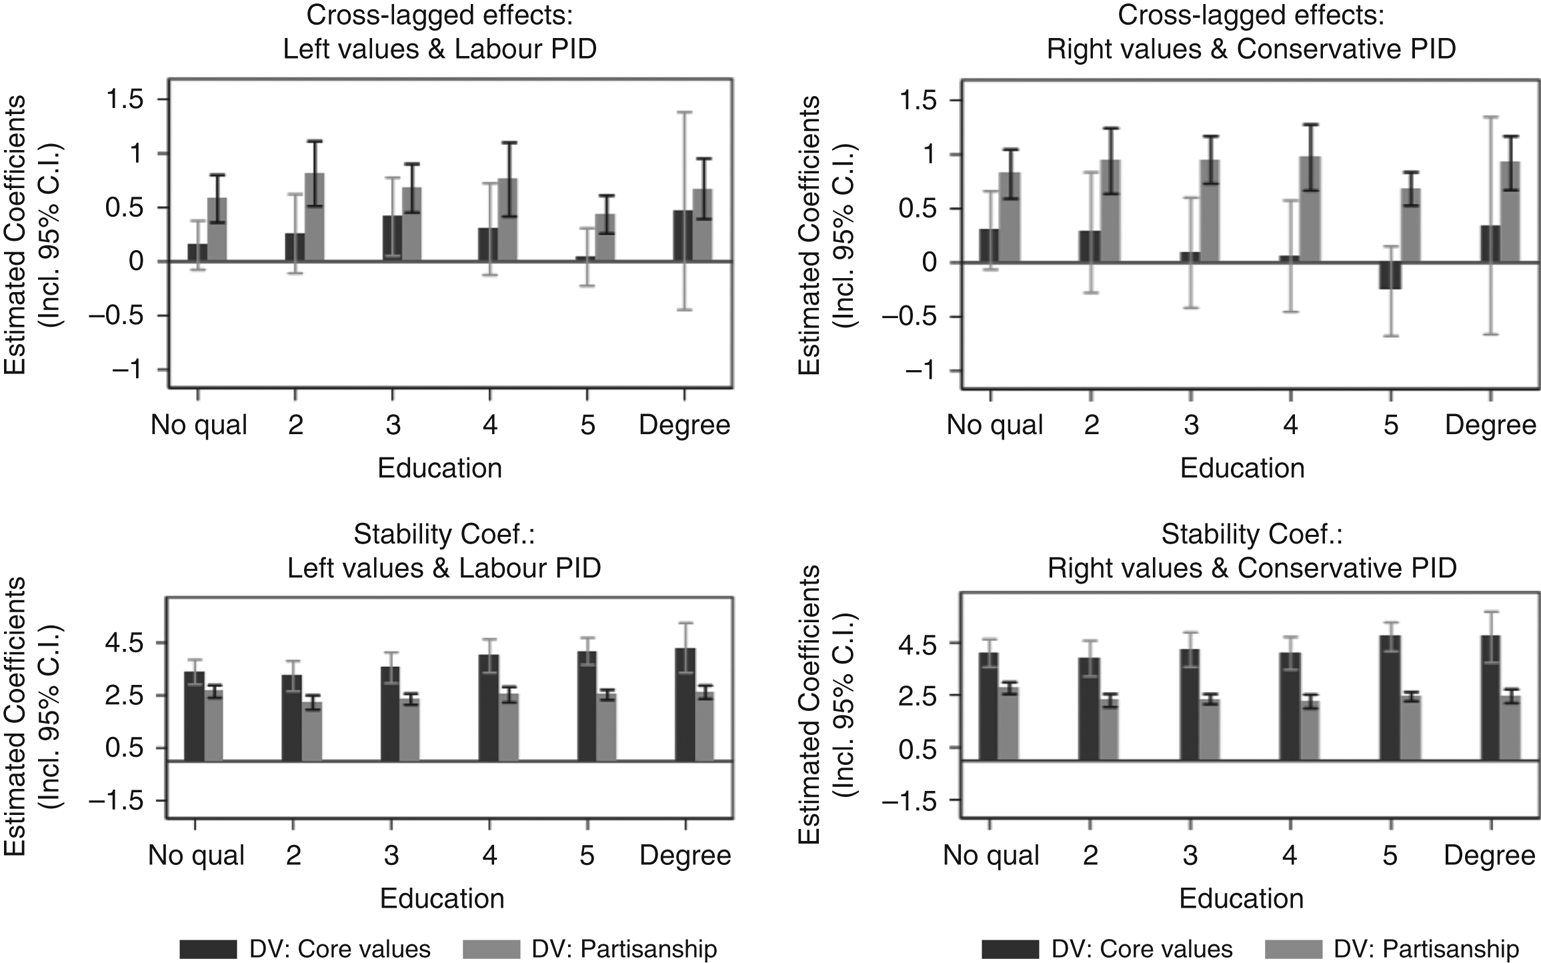
Finally, looking at the results for the associations between right values and Conservative partisanship and left values and Labour partisanship for educational position and income, we again see familiar patterns. Figure 3 confirms that the cross-lagged impact runs from core values to partisanship for all education levels: for example, right-wing respondents are more likely to support the Conservative Party in the next panel wave. The cross-lagged effects of partisanship on values are insignificant for all educational levels except those with less than ‘O’ levels, for whom the effect of Labour partisanship on values just reaches significance.
Cross-lagged interactions and stability coefficients conditioned on education level Note: includes 95 per cent confidence intervals. Full results available in Appendix 7.

As expected,Footnote 64 the stability coefficients (reported in the lower panels) of political values are weaker for less-educated respondents. For example, the stability coefficient for leftist respondents is 4.32 for the highly educated and 3.21 for those with only primary education. However, even among primary-educated respondents, the stability of values is higher than the stability of partisanship among the most highly educated respondents.
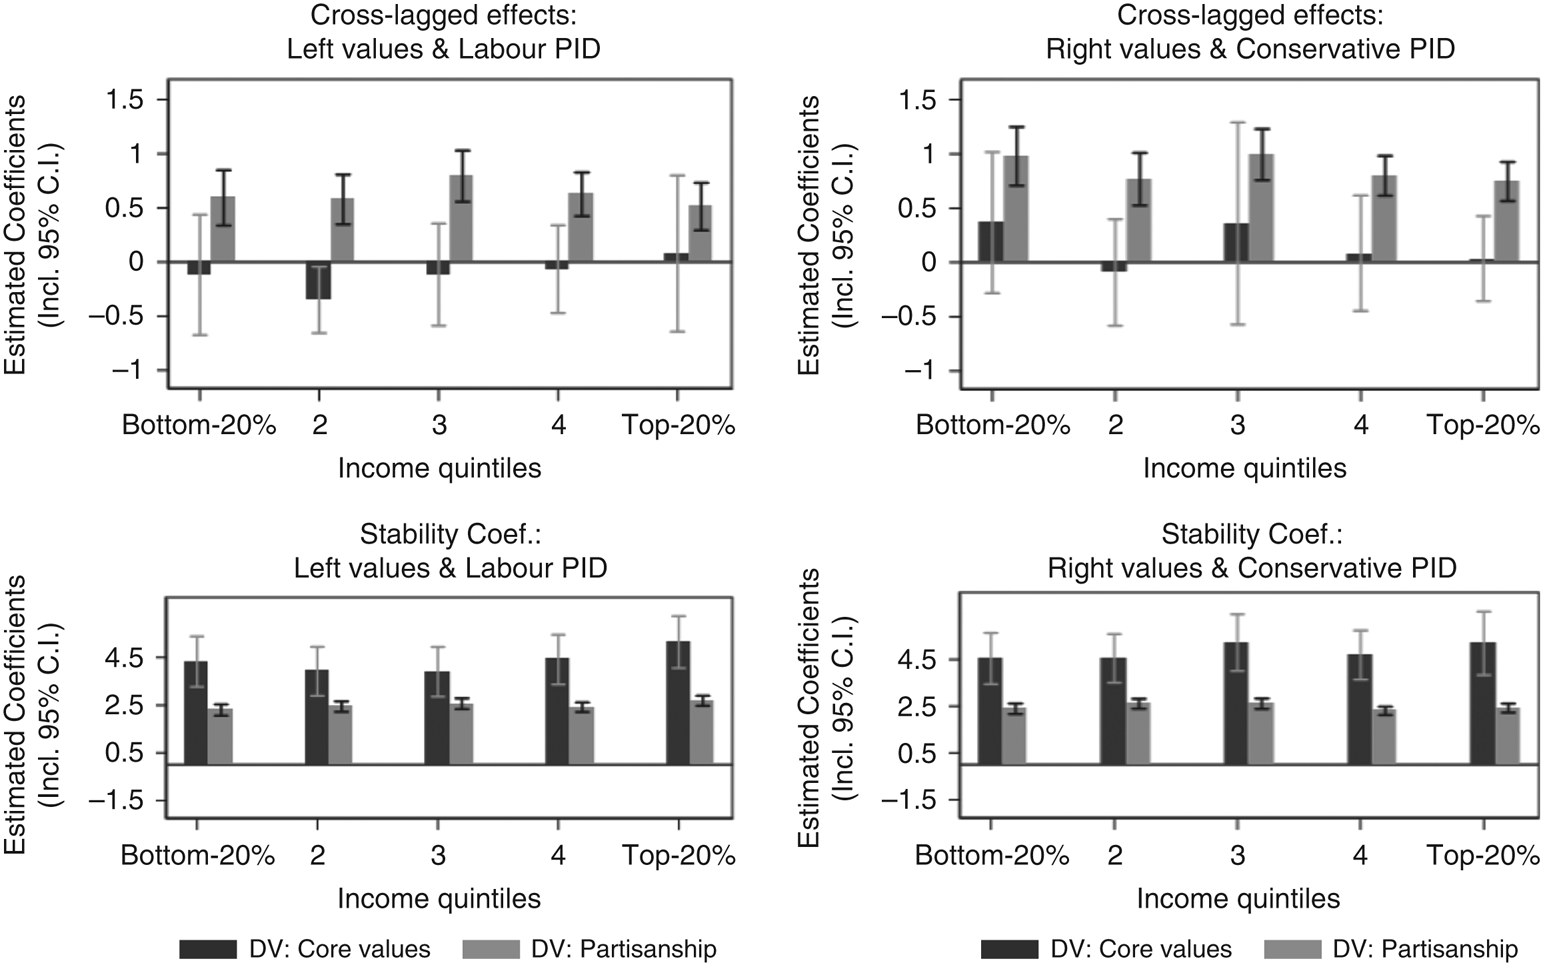
Looking finally at income (Figure 4), we again see that party identification does not affect values, regardless of the respondents’ level of income, whereas values consistently affect partisanship across all income levels on both the left and the right, for Labour and the Conservatives respectively. We find only one significant effect of partisanship on values: Labour respondents in the 20–40 per cent quintile are less likely to be leftist. All other effects of partisanship on core values are insignificant.
Cross-lagged interactions and stability coefficients conditioned on income quintiles Note: includes 95 per cent confidence intervals. Full results available in Appendix 8.

The stability coefficients reported in the two lower panels also show that on both left and right, core values are significantly more stable than partisanship across the full range of income quintiles. Even the lowest level of stability for core values is substantially higher than that obtained for the highest level of partisan stability. It is also worth noting that there is no clear decrease or increase in effect strength with changing income.
Conclusions
This study advances our knowledge of the influences on stability and change in partisanship. It also furthers our understanding of a key structuring principle through which people make sense of the political world – core values. The use of unusually long-term and high-quality survey data to study the dynamics of values and partisanship adds strength to these claims. Ultimately, they help us to understand current dynamics in British party politics.
To elaborate on these points, our analysis provides powerful evidence that over the long term, values shape partisanship rather than vice versa. We draw this conclusion based on cross-lagged analyses, which find that core values are more stable than partisanship and have a substantially stronger lagged influence on partisanship than vice versa. In ‘Conversian’ terminology, we infer that core values are more central elements of political belief systems than partisanship. The size and scope of the BHPS allows these analyses to range across a 16-year period in which British politics changed considerably, establishing that the impact of values was predominant over that of partisanship in both relatively polarized and depolarized contexts. This pattern also holds for young and old, more and less educated, and rich and poor respondents. That core values are as stable amongst those aged 15–24 as they were within older age groups is particularly informative regarding the likely timing of their consolidation in political belief systems compared with the later stabilization of partisanship.
The extent and quality of the panel data and the measurement of the key construct give us some confidence in these findings. However, the use of LCA was also important as it facilitated equivalence in the measurement of the key constructs of core values and partisanship by estimating them as latent classes. This enabled comparison of the cross-lagged effects as well as the stability of our instruments. By doing so, we controlled for the potential artifact of comparing a larger range of scores derived from a standard scale with a smaller one obtained from typical partisanship measures. Given this, what then can we infer with respect to the implications of the relationship between partisanship and values in Britain and elsewhere?
First, we consider how core values help us to understand current dynamics in British politics. Core values appear to differ from many other political perceptions and attitudes that, as mentioned in the introduction, have been shown to be more strongly conditioned by partisanship than vice versa.Footnote 65 One key implication of this centrality of values within voters’ political belief systems is a resistance to political ‘preference shaping’ by parties. Parties simply cannot ‘lead’ their supporters. As recently noted, ‘non-convergence of the British public’s policy beliefs has an important implication for parties’ election strategies: namely, that the electoral ‘market’ for clearly left- and right-wing social welfare policies today has not changed markedly over the past twenty years’.Footnote 66 Core values prevent parties from transforming the electorate into a mirror of their own positions. Instead, voters constrain parties. Moreover, the broad nature of these findings across diverse sectors of the electorate – not just among the rich and highly educated but among the poor and those with little formal education – could put pressure on parties to represent the preferences of these otherwise potentially marginalized groups, depending on the electoral system and the presence of challenger parties.Footnote 67
So, for example, although Labour moved to a more centrist position on both redistributive and social issues from the 1990s onwards, their traditional supporters (the working class) did not, leaving the latter relatively unrepresented and ‘up for grabs’ electorally.Footnote 68 The main consequence of this increasing value discrepancy between the party and its traditional voters was an increase in non-voting amongst poorer voters and those with low levels of formal education. A secondary consequence, as Evans and Mellon illustrate using BES panel data,Footnote 69 was the failure of the political left to carry its traditional supporters with it as it moved to more liberal positions on social issues such as immigration and the EU.Footnote 70 This in turn led to defection over the period from 2005–2015 as voters switched to other parties, primarily UKIP, rather than adjust their core values to fit with those of the Labour Party.
Core values can also help us to understand current political events such as the outcome of the recent EU referendum. If the electorate’s preferences are less mutable by parties and partisanship than has sometimes been assumed, then despite all of the political parties – with the obvious exception of the UK Independence Party – being pro-Remain, many of their partisans chose not to vote with them. To a substantial degree, even the partisans of the pro-Remain parties in the EU referendum failed to comply with the choice the parties advocated.Footnote 71
The explanatory power of core values is apparent – even if not necessarily the ones examined in this study. We are left, however, with the question of why our findings differ from those of Goren, whose path-breaking study indicated that partisanship is the primary driver of values rather than the reverse. There are several possible answers. First, his analysis was undertaken with US respondents. Over the years, various scholars have suggested that responses to questions on partisan identity have different meanings in the USA and Britain. Butler and Stokes famously stated that ‘the British voter is less likely than the American to make a distinction between his current electoral choice and a more general partisan disposition’,Footnote 72 the assumption being that in Britain the two instruments are more likely to be measuring expressions of the same thing – party preference.Footnote 73 If partisanship in the USA is more clearly distinct from vote choice, it is in a sense perhaps more ‘real’ as an independent element of political cognition. As such, it is likely to be more exogenous. In contrast, to the extent that British party preference is less distinguishable from vote intention, there is more room for an alternative ‘unmoved mover’ of party preference – that is, core values.
The influence of core values on partisan dynamics also contrasts with most claims in research on ‘the running tally’ notion of partisanship. From Fiorina onwards,Footnote 74 this literature has focused mainly on performance/valence as sources of partisan erosion and accretion.Footnote 75 Our findings point to a somewhat different understanding of partisan dynamics, which likewise argues against a simple ‘unmoved mover’ interpretation of partisanship, but which attributes a central role to values and ideological shifts by parties rather than performance evaluations as the source of such dynamics.
There is also a second possible reason for the difference between Goren’s findings and ours, however. Goren’s analysis was undertaken using the American National Election Studies panel study of 1992–94–96, a relatively short period covering just the first Clinton Administration. The patterns he observed might not still hold given the politicization of values that has occurred since then. It is tempting to imagine that Trump’s recent US presidential election victory might represent a historic example of the supremacy of values over partisanship, much as we have suggested was the case with Brexit. A re-analysis of the impact of core values in the United States could be timely.
To conclude, although its findings are remarkably clear-cut with respect to the relative influence of core values vis-à-vis partisanship, this article is only a first step towards providing British evidence of the impact of values on partisan switching. It covers a specific time period and only includes core values concerning inequality and redistribution. An important area for future analysis lies in the conditionality of the extent of the influence of core values vis-à-vis partisanship. It is possible, for example, that the well-known decline in the strength of party identification in the final third of the twentieth century, in conjunction with a similar decline in the political impact of social class, produced a vacuum on the basis of political orientations that has only recently been occupied by core values. Indeed, recent events on both sides of the Atlantic suggest it might be fruitful to delve further into the partisan impact of values other than those pertaining to redistribution and equality.
Supplementary material
Data replication sets are available in Harvard Dataverse at https://doi.org/10.7910/DVN/VJTN9Z and online appendices at https://doi.org/10.1017/S0007123418000339