Introduction
The species-specific germination strategies of plants triggered by environmental factors such as temperature, light and water supply are crucial for the establishment of species in changing landscapes (Schütz, Reference Schütz2000; Baskin and Baskin, Reference Baskin and Baskin2001). The timing of seedling emergence is an important step in the life cycle of plants because it may determine subsequent performance and success (Harper, Reference Harper1977; Weiner, Reference Weiner, Carroll, Vandermeer and Rosset1990; Otte, Reference Otte, Song, Dierschke and Wang1995). Perennial plant species do not need to spread the emergence risk temporally because they are more independent of temporal environmental variation than annuals, due to their iteroparous reproduction (Rees, Reference Rees1996). However, in perennials, early emergence is often related to higher fitness and fecundity in terms of seedling recruitment, survival, height, biomass and number of flowers (Cook, Reference Cook1980; Verdú and Traveset, Reference Verdú and Traveset2005; De Luis et al., Reference De Luis, Verdú and Raventós2008). Germination differences of 15 d have even been detectable 3 years later in the perennial Viola blanda (Cook, Reference Cook1980). For annuals, the effect of early germination is not that clear. For example, early germinated seedlings of the winter annual Collinsia verna produced more fruits than later germinated seedlings (Kalisz, Reference Kalisz1986). Similarly, for subterranean clover, a delay in emergence of 5 d resulted in a reduction of biomass of about 50% (Black and Wilkinson, Reference Black and Wilkinson1963). A more complex pattern was found for the summer annual Tagetes micrantha. Seedlings that emerged at the beginning of the season had lower probabilities of survival than seedlings emerging later in the season. On the other hand, those early seedlings that survived showed higher fecundity than seedlings emerging at the end of the season (González-Astorga and Núñez-Farfán, Reference González-Astorga and Núñez-Farfán2000). The same pattern was found for Heterosperma pinnatum: early emergence resulted in greater mortality, but seedlings that germinated early and survived attained greater size and produced more seeds (Venable et al., Reference Venable, Búrquez, Corral, Morales and Espinosa1987).
In regularly disturbed habitats, timing of seedling emergence is especially critical to plant performance (Quintana et al., Reference Quintana, Cruz, Fernández-González and Moreno2004). In arable fields a time window for seedling establishment is opened by cultivation, which reduces competition for resources. Especially within crop fields, early seedling emergence may be advantageous to avoid increasing competition for resources by the crops (Dyer et al., Reference Dyer, Fenech and Rice2000). However, early emerged seedlings may have a higher risk of mortality due to different hazards, such as spring drought, erosive rainfall events or further agricultural measurements (Jones and Sharitz, Reference Jones and Sharitz1989). Species characteristic of arable sites germinate very quickly (they have a short mean germination time) to take advantage of periods when environmental conditions are favourable (Otte et al., Reference Otte, Bissels and Waldhardt2006). On the other hand, arable weeds are also characterized by their ability to spread their germination across time (asynchronous germination) to avoid periods of unfavourable site conditions (Ellenberg and Leuschner, Reference Ellenberg and Leuschner2010).
Many studies have focused on ‘mean germination time’ as a variable to quantify the germination response of plants to various environmental factors (Dyer et al., Reference Dyer, Fenech and Rice2000; Arnold et al., Reference Arnold, Kailichova, Knauer, Ruthsatz and Baumgartl2014; Cristaudo et al., Reference Cristaudo, Gresta, Catara and Mingos2014; Funk et al., Reference Funk, Loydi and Peter2014; Ludewig et al., Reference Ludewig, Zelle, Eckstein, Mosner, Otte and Donath2014; Zhao et al., Reference Zhao, Zhaohua and He2014; Loydi et al., Reference Loydi, Donath, Otte and Eckstein2015; Rühl et al., Reference Rühl, Eckstein, Otte and Donath2016). In some cases, differences in mean germination time of a few days (e.g. 2–4 d) between species or individuals of the same species were statistically significant. However, it remains unclear whether such small differences in mean germination time translate into significant and ecologically relevant effects on plant fitness across the life cycle.
Some studies have investigated the effects of delayed germination in the range of several weeks or months on life-history traits such as growth, fecundity and survival (Rice, Reference Rice1990; Kelly and Levin, Reference Kelly and Levin1997; González-Astorga and Núñez-Farfán, Reference González-Astorga and Núñez-Farfán2000), whereas studies including short germination delays of a few days are scarce (but see Black and Wilkinson, Reference Black and Wilkinson1963). Therefore, we did two multi-factorial experiments, one with and one without interspecific competition, to study the impact of delayed germination (in the range of 1–7 d) on the fitness of the annual arable weed species Agrostemma githago (L.).
We addressed the following hypotheses: (1) delayed germination in the range of 1–7 d significantly reduces fitness (expressed through different vegetative and regenerative traits); and (2) the decrease of fitness is higher in the experiment with interspecific competition.
Materials and methods
Experimental design
We conducted two separate experiments to investigate the effect of delayed germination (factor levels k = 4, delay of 1, 2, 3 and 7 d) on the fitness of A. githago L. Experiment I was performed without interspecific competition; experiment II under conditions of interspecific competition with barley. Since both experimental set-ups differed in plant density per pot (2 vs. 4 individuals, respectively), which may have important direct and indirect effects on plant performance, we chose not to pool the data of both experiments. Both experiments followed a generalized randomized block design (Quinn & Keough, Reference Quinn and Keough2002) with three blocks, i.e. a block design with replication within blocks.
A. githago, as a competitive, opportunistic weed with a crop mimicry strategy (Barrett, Reference Barrett1983) and large seeds, is a suitable model species representative of a group of weeds with similar traits, such as Centaurea cyanus, Avena fatua, Bromus sterilis and Bromus arvensis (Otte et al., Reference Otte, Bissels and Waldhardt2006). The short afterripening period and a lack of chilling requirements of the seeds enable the species to germinate at any time of year. Seeds germinated in autumn overwinter and complete their life cycle in the following summer, while seedlings emerging in spring behave as summer annuals (Firbank and Watkinson, Reference Firbank and Watkinson1986). A. githago is native to the eastern Mediterranean area. Until the introduction of improved seed-cleaning techniques the species was a pernicious weed (Thompson, Reference Thompson1973). Today, A. githago is endangered by extinction in Germany (Ludwig and Schnittler, Reference Ludwig and Schnittler1996) because it relies on continuous reintroduction from contaminated grain. Since the species occurs in cereal crops, we selected barley (Hordeum vulgare L.) as competitor for the experiment.
Both experiments were executed in an unheated greenhouse in summer, using pots of 16 × 16 cm surface area. We used a nutrient-rich planting substrate to ensure sufficient nutrient supply. In the course of the experiments no additional fertilizer was applied. First, seeds of A. githago and barley were sown separately into seed trays. Barley was sown 3 d later than the weed because it germinates very quickly and synchronously. Six days after sowing, the first seedlings of A. githago appeared. During one week, emerging seedlings were marked and their day of germination registered. The different experimental combinations were planted 8 d after the first seeds germinated. For each pot one seedling of the earliest day of germination (day 0, control plant) was planted together with one seedling with delayed germination (delay of 1 d, 2 d, 3 d or 7 d), i.e. increasingly smaller initial plant size. For experiment II, i.e. the setting including interspecific competition, each pot additionally received two individuals of barley. All treatment combinations were replicated 15 times. In total, 240 plants of A. githago were grown in 120 pots. In both experiments, pots were arranged in three blocks in the greenhouse. Within each block, pots were placed randomly.
To assess the development and fitness of the seedlings with different delay of germination, several variables were assessed. During growth, height and number of shoots of all A. githago individuals were recorded weekly. The plants were harvested after 3 months, when the shoots of A. githago turned brown. During harvesting, the number of flowers and number of shoots were counted. Additionally, the three capsules of the top of each plant were collected to count seeds per capsule and to estimate seed mass. Above-ground biomass was estimated after drying plants at 60°C for 24 h.
Analysis
Data of both experiments, i.e. with and without competition by barley, were analysed separately. All statistical analyses were calculated with the raw data; only data on ‘seed mass’ and ‘seeds per capsule’ were box-cox transformed before analyses, to improve normality and variance homogeneity (Quinn and Keough, Reference Quinn and Keough2002). Effects of the single factors and the factor combinations of block and delay for the vegetative traits ‘number of shoots’, ‘height’, ‘biomass’ and the regenerative traits ‘number of flowers’, ‘seeds per capsule’ and ‘seed mass’ were assessed with a multi-factorial analysis of variance (ANOVA). The factor block was considered random. The factor delay was considered fixed and has four levels (1, 2, 3 and 7 d). Control plants (germinated day 0) could not be included into the statistical analysis since they were not independent of the delayed seedling growing in the same pot. For visual comparison, control means are given in the figures. Subsequently, significance of differences between levels of the factor delay was assessed through a Tukey-HSD test. All statistical analyses were carried out using the program STATISTICA (v. 10.0, Statsoft Inc., Tulsa, Oklahoma, USA).
Results
Experiment I (without additional competition)
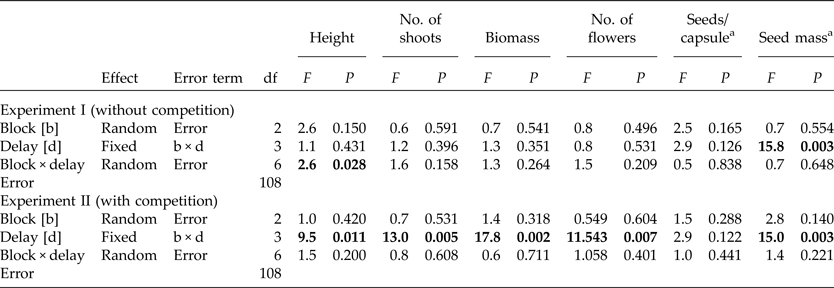
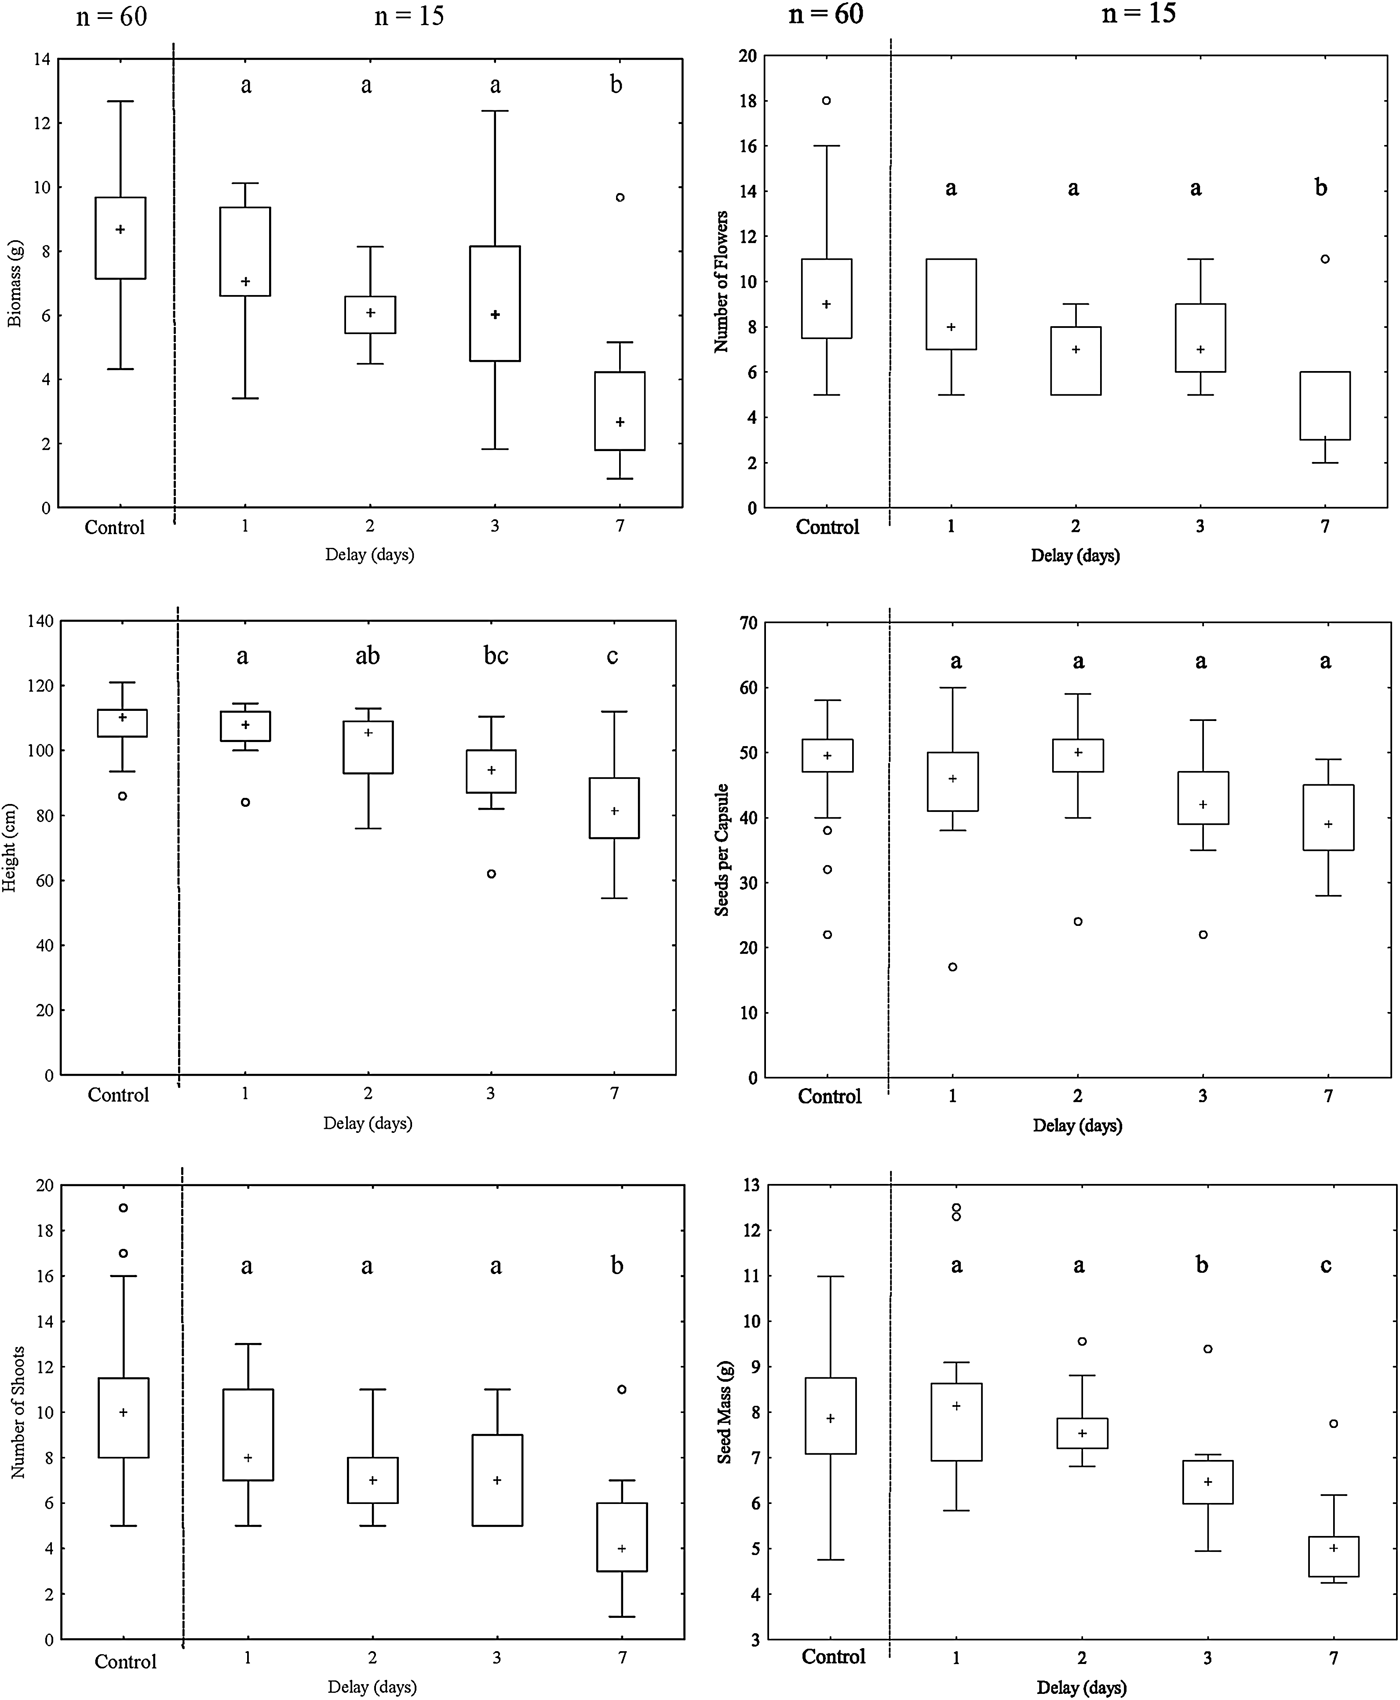
Without additional competition by barley, the single factor delay showed no significant effect on the investigated life-history traits of A. githago (Table 1) except for ‘seed mass’ (P = 0.003). For this parameter, significant differences could be found between the groups with 1 and 3, respectively, and 7 d germination delay (Fig. 1). The interaction of the random factor block with delay had significant effect on the measured fitness parameter ‘height’ (P = 0.028).
Effect of germination delay on the traits biomass (g), height (cm), number of shoots, number of flowers, seeds per capsule and seed mass (g) without interspecific competition (experiment I). Boxes represent interquartile ranges, containing 50% of values; crosses depict the median; whiskers are drawn from the top/bottom of the box to the largest/smallest data point less than 1.5 times the box height from the box (‘upper/lower inner fence’). Values outside the inner fences are shown as circles. Different letters denote significantly different treatment levels according to the Tukey-HSD test (level of significance α = 5%). Data of control plants are shown for comparison but were not included in the statistical analyses (cf. Material and methods).

Effects of block and germination delay on vegetative traits (height, number of shoots, biomass) and on regenerative traits (number of flowers, seeds per capsule and seed mass) in the experiments without and with competition; df = degrees of freedom, F = variance ratio, P = error probability; statistically significant effects are given in bold type

aData box-cox transformed.
Experiment II (with additional competition)
The experiment with additional competition by barley revealed a clear impact of delayed germination of 1–7 d on the investigated life-history traits of A. githago (Table 1). The factor delay showed significant effects on the studied traits ‘height’ (P = 0.011), ‘number of shoots’ (P = 0.005), ‘biomass’ (P = 0.002), ‘number of flowers’ (P = 0.007) and ‘seed mass’ (P = 0.003). The random factor block had no significant effects.
All life-history traits showed a decrease with increasing delay of germination, resulting in a significant difference between the groups with 1 and 3, respectively, and 7 d germination delay (Fig. 2). Plants with delayed germination of seven days produced 54.1% (± 11.0) fewer shoots, 57.3% (± 11.6) less biomass, 51.7% (± 10.8) fewer flowers, 35.5% (± 4.7) lighter seeds and were 23.2% (± 4.8) shorter as compared to control plants without delayed germination.
Effect of germination delay on the traits biomass (g), height (cm), number of shoots, number of flowers, seeds per capsule and seed mass (g) with interspecific competition through barley (experiment II). Boxes represent interquartile ranges, containing 50% of values; crosses depict the median; whiskers are drawn from the top/bottom of the box to the largest/smallest data point less than 1.5 times the box height from the box (‘upper/lower inner fence’). Values outside the inner fences are shown as circles. Different letters denote significantly different treatment levels according to the Tukey-HSD test (level of significance α = 5%). Data of control plants are shown for comparison but were not included in the statistical analyses (cf. Material and methods).

Discussion
There are many factors determining success or failure of plant reproduction from seeds (Schütz, Reference Schütz2000; Eckstein and Donath, Reference Eckstein and Donath2005; Fay and Schultz, Reference Fay and Schultz2009; Walck et al., Reference Walck, Hidayati, Dixon, Thompson and Poschlod2011). The time of germination and seedling emergence play major roles in further plant performance (Donohue et al., Reference Donohue, Rubio de Casas, Burghardt, Kovach and Willis2010). Especially for autumn-germinated seedlings of perennials or winter annuals, which have to survive the unfavourable winter period, larger and thus more vigorous seedlings have an advantage (Leishman et al., Reference Leishman, Wright, Moles, Westoby and Fenner2000; Schmiede et al., Reference Schmiede, Ruprecht, Eckstein, Otte and Donath2013). Similarly, seedling emergence early in spring is advantageous when competing with crops (Black and Wilkinson, Reference Black and Wilkinson1963; Dyer et al., Reference Dyer, Fenech and Rice2000; De Luis et al., Reference De Luis, Verdú and Raventós2008). On the other hand, these seedlings are especially threatened by environmental hazards, such as spring drought or frost and agricultural measurements (Jones and Sharitz, Reference Jones and Sharitz1989; Storkey et al., Reference Storkey, Moss and Cussans2010). Against this background, the purpose of our study was to examine the effects of short-term germination delays, in situations with and without interspecific competition, on plant fitness, ignoring potentially fatal environmental hazards.
This study demonstrates that, in the case of interspecific competition, a germination delay of only a few days leads to significantly decreased fitness, which is consistent across several vegetative and reproductive life-history traits. Furthermore, the results showed that the decrease of fitness is considerable, amounting to up to 25% without competition and >50% with competition. Thus, early emerged seedlings have statistically and biologically significant fitness advantages over later emerged seedlings of the same species, if they meet favourable conditions for growth. In the case of additional competition, our results revealed that even a short germination delay in the range of 3–7 d means a decrease of fitness across the investigated traits along the life cycle.
In our experiment with interspecific competition, the vegetative traits ‘number of shoots’, ‘height’ and ‘biomass’ decreased with increasing delay of germination (Fig. 2). A germination delay of 7 d decreased the biomass of A. githago by 57%. This is in line with a former study about the impact of seedling emergence time of subterranean clover, where a germination delay of 5 d led to a reduction of about 50% in final biomass (Black and Wilkinson, Reference Black and Wilkinson1963). Other studies demonstrated that early emerged seedlings grew taller than later ones, but these studies addressed germination delays of several weeks or months (Rice, Reference Rice1990; Quintana et al., Reference Quintana, Cruz, Fernández-González and Moreno2004; De Luis et al., Reference De Luis, Verdú and Raventós2008). In our experiment, the investigated plants that germinated 7 d later and grew together with barley were about 23% shorter at the end of their life cycle, compared to the controls. A. githago adjusts its growth in height to that of the cereals. This is one mechanism of the crop mimicry strategy to cope with competition for light (Barrett, Reference Barrett1983). The fact that a reduction in height was found in A. githago, which is an opportunistic weed with respect to plant height and considered as competitive ruderal strategist (Klotz et al., Reference Klotz, Kühn and Durka2002), indicates that a significant effect of a relatively short germination delay on biomass and canopy height may be a general response.
The reproduction traits ‘number of flowers’, ‘seeds per capsule’ and ‘seed mass’ were influenced in a similar way by delayed germination of only a few days (Fig. 2). Under conditions of competition, a delay of 7 d resulted in nearly 52% fewer flowers and the seeds produced showed 36% lower seed mass. Other studies found the same general pattern, i.e. that early emerged seedlings were more fecund than later ones, for annual and perennial species with delayed germination of several weeks or months (Rice, Reference Rice1990; Kelly and Levin, Reference Kelly and Levin1997; González-Astorga and Núñez-Farfán, Reference González-Astorga and Núñez-Farfán2000). Since in monocarpic species reproductive traits are strongly correlated with biomass, this response is not unexpected (Sletvold, Reference Sletvold2002). The lower seed mass of later emerged individuals may have influences on the next generation, since seed mass directly influences germination and seedling development (Lopes Souza and Fagundes, Reference Lopes Souza and Fagundes2014). The germination of large seeds is more robust to variation in environmental cues such as light, water and nutrient supply (Milberg et al., Reference Milberg, Andersson and Thompson2000). In addition, seedlings from small seeds are initially small (Jankowska-Blaszczuk and Daws, Reference Jankowska-Blaszczuk and Daws2007), therefore they are more vulnerable to a range of hazards, including drought stress and burial (Leishman et al., Reference Leishman, Wright, Moles, Westoby and Fenner2000).
Despite clear fitness advantages of early germination, highly synchronous early germination may not necessarily be beneficial for plant populations in highly variable environments, since a certain amount of persistent (or dormant) seeds in the soil seed bank, or germination delay, may be mandatory to survive annual changes of agricultural measures, for example (Kornas, Reference Kornas1988; Rees and Long, Reference Rees and Long1992), or unfavourable abiotic conditions. Therefore, selection for early germination seems to be counterbalanced by forces selecting for some degree of temporal germination spread (asynchronous germination) under field conditions (Donohue et al., Reference Donohue, Rubio de Casas, Burghardt, Kovach and Willis2010). A study on germination strategies of arable weeds suggests that a prolonged germination time within the vegetation period (lower synchrony of germination and higher mean germination time) is advantageous in highly variable environments like arable fields (Rühl et al., Reference Rühl, Eckstein, Otte and Donath2016). Within-season spread of germination over a period of several days may be a response to short-term unfavourable conditions during the germination period of plant species (Ludewig et al., Reference Ludewig, Zelle, Eckstein, Mosner, Otte and Donath2014). Since ungerminated seeds of A. githago do not persist in the soil, it has adopted a crop mimicry strategy (Barrett, Reference Barrett1983), relying upon continuous re-introductions from contaminated grain with the next sowing (Firbank and Watkinson, Reference Firbank and Watkinson1986). However, without seed dormancy, a long mean germination time and low synchrony may represent, at small temporal scales, another species-specific germination strategy for risk reduction to bridge short-term unfavourable environmental conditions (Venable and Brown, Reference Venable and Brown1988; Rees, Reference Rees1994).
Delayed germination thus appears to be a bet-hedging strategy (Rees, Reference Rees1994; Donohue et al., Reference Donohue, Rubio de Casas, Burghardt, Kovach and Willis2010; Gremer and Venable, Reference Gremer and Venable2014). Bet-hedging traits are expected to evolve under conditions of unpredictable environmental variance (Simons, Reference Simons2011). To avoid the risk of a failure of the whole seed batch, species accept the lower fitness of the late emerged seedlings (Childs et al., Reference Childs, Metcalf and Rees2010; Gremer and Venable, Reference Gremer and Venable2014). Several studies of perennial and annual species showed that early emergence resulted in greater mortality due to various hazards at the beginning of the season, such as spring drought or heavy rainfall events, but seedlings that germinated early and survived the seedling stage were more robust, attained greater size and produced more seeds (Venable et al., Reference Venable, Búrquez, Corral, Morales and Espinosa1987; González-Astorga and Núñez-Farfán, Reference González-Astorga and Núñez-Farfán2000; Quintana et al., Reference Quintana, Cruz, Fernández-González and Moreno2004). Delayed germination, expressed as long mean germination time and low synchrony of germination within one growing season, seems to represent a promising strategy to cope with this challenging situation (Rühl et al., Reference Rühl, Eckstein, Otte and Donath2016). As the current study showed, there is a price to pay for this flexible strategy of delayed germination, i.e. decreased fitness through smaller plant sizes and lower offspring production. Additionally, in the case of A. githago, the results suggest that there is a threshold for the effect of germination delay on fitness, in the range of 3–7 d. Plants with delayed germination beyond this threshold are not able to utilize the crop mimicry strategy successfully, because the weed cannot catch up with the developmental advantage of the cereals.
Acknowledgements
We thank Josef Scholz-vom Hofe for assistance with data collection in the lab and the greenhouse.
Financial support
This work was funded by a postgraduate scholarship of the Justus Liebig University, Giessen.
Conflicts of interest
None.