I. INTRODUCTION
Due to the superior combination of strength and toughness, some natural biomaterials like seashells have drawn strong interest of many researchers in the recent years. The ratio for different architectures of shells is different. For instance, the microarchitecture of the shell of Pectinidae is ordered at three size scales, with a fourth level of organization existing in the three distinct layers across the shell thickness.Reference Li and Nardi1 While, nacre, an attractive biomaterial for its excellent hierarchical “mud-brick” structure, is composed of multiscale inorganic mineral platelets and organic protein biopolymers.Reference Currey2 Remarkable mechanical properties may result from higher strength provided by the hard inorganic component and good toughness contributed by the soft organic component. Furthermore, the mechanical properties of nacre are enhanced by crack deflection caused by inorganic platelet sliding, intergranular crack propagation manner when the crack invades the inorganic platelet, organic viscoplastic energy dissipation at the interface, bridge bonding between adjacent mineral platelets, progressive locking generated by nanoasperities on the aragonite tablets, nanoparticle rotation mediated by the nanoparticle–biopolymer architecture, and the partial dislocation and the deformation twinning within the nanoparticles.Reference Espinosa, Rim and Barthelat3–Reference Huang and Li9 In recent years, the investigations on the fabrication and mechanical properties of various nacre-mimetic materials, especially ceramic/polymer configuration: Al2O3/chitosan,Reference Bonderer, Studart and Gauckler10 Al2O3/cyanate ester,Reference Zhao, Yue, Guo, Wu, Zhang, Li, Mao and Han11 calcium phosphate microplateles/sodium alginate,Reference Gao, Chen, Mao, Song, Yao, Colfen, Luo, Zhang, Pan, Meng, Ni and Yu12 hydroxyapatite scaffolds/PMMA,Reference Bai, Walsh, Gludovatz, Delattre, Huang, Chen, Tomsia and Ritchie13 montmorillonite clay plateles/PDDA,Reference Tang, Kotov, Magonov and Ozturk14 montmorillonite clay plateles/cellulose,Reference Das, Thomas, Moeller and Walther15 montmorillonite/nanofibrillar/PVA,Reference Wang, Cheng, Lin and Jiang16 have been conducted to achieve the advantages of nacre. Furthermore, carbon nanotubes, graphene, graphene oxide, and some metals can also be used as hard bricks or soft mortar, such as graphene/Al2O3/Al,Reference Zhang and Li17 graphene/PVA,Reference Zhao, Yang, Zhao, Gao, Xie and Bai18 carbon nanotubes/epoxy,Reference Cheng, Li, Jiang and Tang19 graphene/WS2/PCDO,Reference Wan, Zhang, Zhou, Li, Ji, Jiang and Cheng20 and graphene/Ni/PDAReference Wan, Xu, Jiang and Cheng21 composites.
Polyelectrolytes (PEs), possessing long chains with positive or negative charges, can be assembled into 2D-film with certain thickness by layer-by-layer (LBL) self-assembly.Reference Decher22 Meanwhile, the surface of TiO2 particles displays inversely charged as the pH value of the solution increased,Reference Burghard, Zini, Srot, Bellina, van Aken and Bill23 which can be deposited on the substrate by the chemical bath deposition (CBD) method.Reference De Guire, Niesen, Supothina, Wolff, Bill, Sukenik, Aldinger, Heuer and Ruhle24 Therefore, it is possible to fabricate the PE/TiO2 nanolayered composites (NLCs) with the aid of electrostatic interaction and biomineralization. In recent years, the PE/TiO2 NLCs, gathered the soft component of PEs and hard component of TiO2, as one of nacre-mimetic materials currently have been fabricated to investigate the mechanical properties such as strength, toughness, hardness, and crack-resistance.Reference Burghard, Zini, Srot, Bellina, van Aken and Bill23,Reference Tan, Zhang, Yan, Sun and Zhang25–Reference Burghard, Tucic and Jeurgens27 These investigations show that the PE/TiO2 NLCs exhibit the comparable strength and the toughness with the nacre, while fatigue properties of the NLCs are scarcely discussed.Reference Yang, Zhang, Tan, Luo and Zhang28 In our previous work, the PE/TiO2 NLCs with a thickness ratio of the TiO2 layer to the PE layer (inorganic/organic layers, t i/t o ≈ 3) were prepared, and the low fatigue strength of the composite was attributed to the thicker TiO2 layer.Reference Yang, Zhang, Tan, Luo and Zhang28 Gao et al. reported that the mineral platelets in biocomposites are insensitive to crack-like flaws when the length scale of the mineral drops below 30 nm.Reference Gao, Ji, Jager, Arzt and Fratzl29 It seems that the fatigue behavior could be improved by reducing the thickness of the TiO2 layer to below 30 nm while the thickness of the PE layer is not drastically changed. Another key question is whether the optimum fatigue property could be obtained by tailoring the thickness ratio of the TiO2 layer to the PE layer.
In this paper, (PE/TiO2)4 organic/inorganic nacre-mimetic NLCs with different t i/t o by utilizing LBL self-assembly and CBD method were deposited on flexible polyimide and single crystal Si substrates, respectively. Microstructures and mechanical properties, especially fatigue properties, of the NLCs were evaluated. The TiO2 layer thickness is below 30 nm and the effect of t i/t o on the mechanical properties of the NLCs was examined.
II. EXPERIMENTAL
A. Preparation
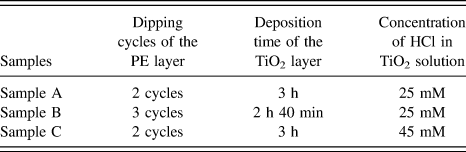
(PE/TiO2)4 NLCs were fabricated on (100)-oriented single-crystal Si wafers with a thickness of 500 μm and 125-μm-thick soft polyimide foils, which were cut into 3 mm × 5 mm and 2.5 mm × 20 mm, respectively. Prior to the deposition, the substrates were cleaned and pretreated following the method described previously.Reference Yang, Zhang, Tan, Luo and Zhang28 Three kinds of PE, including poly(ethyleneimine), poly(sodium 4-styrenesulfonate), and poly(allylamine hydrochloride) were selected to assemble PE layers, while titania solution with 10 mM TiO22+ and 25 or 45 mM HCl were prepared for the deposition of the TiO2 layer.Reference Yang, Zhang, Tan, Luo and Zhang28 To obtain an organic–inorganic hierarchical structure with certain thickness, several dipping cycles of PE solution and different deposition times of TiO2 layers were adopted for one bilayer deposition, and the process was repeated four times.
Hoffmann et al.Reference Hoffmann, Bartolome, Wildhack, Jeurgens, Bill and Aldinger30 found that the size of TiO2 nanoparticles and the thickness of the TiO2 layer were closely related to the concentration of HCl in inorganic solution and the deposition time. To compare the mechanical properties between NLCs with different t i/t o, three kinds of (PE/TiO2)4 NLCs were fabricated by changing the organic solution dipping cycles and the deposition time in the inorganic solution, which were denoted as samples A, B, and C. Fabrication conditions for the composite samples are listed in Table I.
Fabrication recipes of samples A, B, and C.

B. Microstructure characterization
The surface morphology of the NLCs was observed by using a field-emission scanning electron microscope (FE-SEM; Zeiss, Supra 35, Oberkochen, Germany). The layer thicknesses of the NLCs were measured from the cross-sectional view by using a field-emission transmission electron microscope (FE-TEM; FEI, Tecnai 20, Hillsboro, Oregon). The method for the preparation of cross-sectional TEM specimens was reported previously.Reference Yang, Zhang, Tan, Luo and Zhang28 The crystal structure of the NLCs was characterized by using a high-resolution transmission electron microscope (HRTEM) with a point resolution of 0.21 nm and selected area electron diffraction (SAED). Lengths of the cracks induced by microindentation were investigated by using a laser scanning confocal microscope (LSCM; Olympus 4000, Tokyo, Japan).
C. Mechanical testing
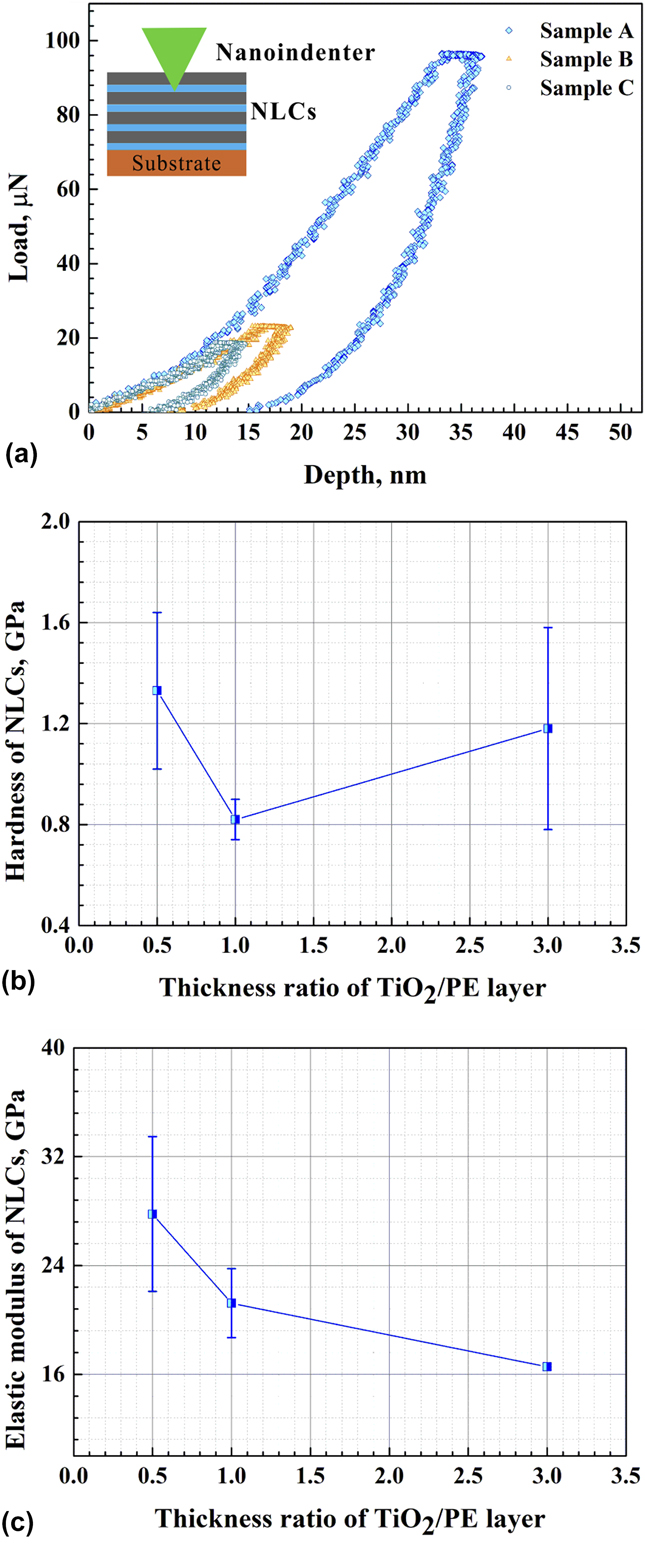
Hardness (H) and elastic modulus (E) of the NLCs were measured via nanoindentation tests (Triboindenter®, Hysitron Incorporated, Minneapolis, Minnesota) at room temperature with a Berkovich indenter (tip radius is 50 nm, strain rate is 0.03 s−1). When the indentation depth is less than 20% of film thickness, we can obtain intrinsic film properties and avoid the influence of the substrate.Reference Ohmura, Matsuoka, Tanaka and Yoshida31 Thus, the applied indentation loads of 100 and 25 μN were selected and the mean values of H and E were obtained at an indentation depth of about 10–20% of the film thickness to eliminate substrate effects for sample A and sample B, respectively. However, it is very difficult to obtain meaningful analytical results for indentation depths less than 10 nm.Reference Jian, Chen and Lin32 Therefore, a 20 μN-loading force was selected to make the indentation depth a little above 10 nm for sample C. A total of 8 indentations were made for each sample.
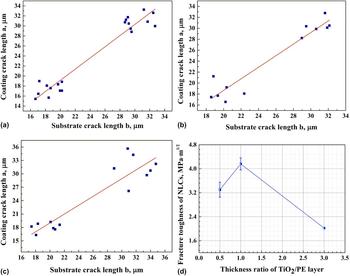
Fracture toughness of the NLCs (K c) was determined by microindentation tests (Q10A) with a Vickers indenter with the applied loads of 0.98 N and 1.96 N, respectively. A total of 6–10 indentations with spacing of 100 μm were made for each sample. Indenters were loaded on the region where the substrates were uncoated the (PE/TiO2)4 NLCs by tweezers, microcracks initiated from four corners of the indentation on the Si substrates would advance into the (PE/TiO2)4 nanolayer-coated regions. The detailed measurement and characterization of the indentation-induced crack morphology has been reported previously.Reference Zhang, Tan, Yan, Zhang, Sun and Zhang26 By measuring the length of the crack advanced into the coating (named as a) and away from the coating (named as b), a linear function of a versus b could be obtained by converting the numerical “data” into a figure, and the slope of a versus b (ϕ) would be determined directly coupled with the thickness (t) measured by TEM and the elastic modulus of the coating film (E c) measured by nanoindentation. K c was calculated by
 $${K_{\rm{c}}} = {K_{\rm{s}}} \cdot \left[ {1 + \lambda {{\left( {\phi b - a} \right)} \over t}\sqrt {{{{E_{\rm{c}}}\left( {1 - \nu _{\rm{s}}^2} \right)} \over {{E_{\rm{s}}}\left( {1 - \nu _{\rm{c}}^2} \right)}}} } \right]\quad ,$$
where K s is the fracture toughness of the substrate, which is 0.83 MPa m1/2 for the Si wafer. λ is a constant, which is 0.45 reported by Xia et al.Reference Xia, Curtin and Sheldon33 E s is the elastic modulus of the substrate, which is 163 GPa for the Si wafer. νs and νc are Poisson’s ratios of the substrate and the coating film, respectively, whose value is 0.223 for the Si wafer and 0.25 for the film.
To evaluate fatigue properties of the NLCs, fatigue tests were carried out by using cantilever beam-type samples at a home-made dynamic bending system.Reference Dai, Zhu and Zhang34 A detailed description on the fatigue testing method and the determination of critical strain amplitude for the fatigue cracking has been reported previously.Reference Yang, Zhang, Tan, Luo and Zhang28 When a constant deflection is applied to the cantilever sample, the maximum strain (εm) applied on the sample surface at the fixed end can be determined by
 $${\varepsilon _{\rm{m}}} = {1 \over 2}\kappa \cdot h\quad ,$$
where h refers to the total thickness of the sample and κ is a curvature of the sample at the fixed end. When the number of fatigue cycles is increased to a critical value at a constant repeated deflection, fatigue cracks will initiate from the fixed end of the sample, and then gradually extend toward the loading point with fatigue cycles, resulting in a cracking region on the sample. By measuring the distance (l) between the foremost crack and the fixed end of the tested sample, the critical strain amplitudes of the NLCs (εa) for fatigue cracking can be calculated by
 $${\varepsilon _{\rm{a}}} = {{{\varepsilon _{\rm{m}}}\left( {{l_0} - l} \right)} / {{l_0}}}\quad ,$$
where l 0 is the distance between the loading point and the fixed end of the sample.
III. RESULTS AND DISCUSSION
A. Morphologies and microstructures of NLCs
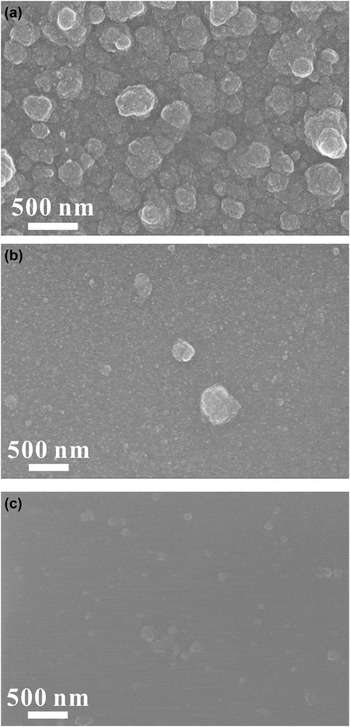
Figure 1 shows surface morphologies of three sorts of (PE/TiO2)4 NLCs fabricated by different preparation parameters shown in Table I. With the decrease in the deposition time of the inorganic layers from 3 h [Fig. 1(a), sample A] to 2 h 40 min [Fig. 1(b), sample B], much smoother surfaces with less amount of topmost TiO2 nanoparticles were obtained. In addition, a comparison between Figs. 1(c) and 1(a) indicates that the TiO2 nanoparticle size of the sample C (50–100 nm) is much smaller than that of the sample A (∼200 nm). This might be attributed to the increase in the HCl concentration of the titania solutions from 25 mM for sample A to 45 mM for sample C. The similar results can also be found in the deposition of the TiO2 layer on the bare Si substrate.Reference Hoffmann, Bartolome, Wildhack, Jeurgens, Bill and Aldinger30
SEM images of (PE/TiO2)4 NLCs, (a) sample A, (b) sample B, and (c) sample C.

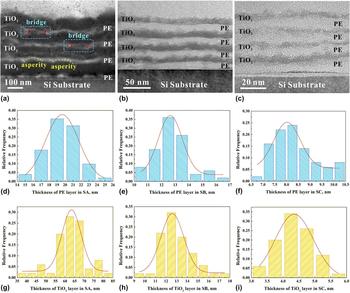
Figures 2(a)–2(c) present TEM cross-sectional views of samples A, B, and C, respectively, showing four bilayered structures with different t i/t o. Figures 2(d)–2(i) show the corresponding statistical distribution of thicknesses of the PE layer and the TiO2 layer in each sample. t i/t o for sample A (∼20 nm for each PE layer and ∼60 nm for each TiO2 layer), sample B (∼12.5 nm for each PE layer and ∼12.5 nm for each TiO2 layer), and sample C (∼8 nm for each PE layer and ∼4 nm for each TiO2 layer) is ∼3, ∼1, and ∼0.5, respectively. The total thickness of the NLCs for the samples A, B, and C is ∼320 nm, ∼100 nm, and ∼50 nm, respectively. Compared with sample A, the notably thin TiO2 layer and the slightly thin PE layer were observed in samples B and C. This demonstrates that the increase in the concentration of HCl in inorganic solution largely slowed down the deposition rate of TiO2, which produced the thinner TiO2 layers, but the TiO2 layer thickness is not proportional to the deposition time. Furthermore, various thicknesses of the PE layer were obtained at the same dipping cycles, indicating that the PE and TiO2 layers interacted with each other, i.e., thicker PE layers promoted the formation of the thicker TiO2 layers, which inversely induced the formation of the thicker PE layers. In addition, the TiO2 layers were infiltrated into the PE layers, forming bridge bonding between the two adjacent PE layers in sample A, while no bridges were observed in samples B and C, as shown in Fig. 2(a).
TEM cross-sectional observations on (a) sample A, (b) sample B, and (c) sample C, respectively, and corresponding to statistical distribution of the thicknesses of the PE layer and TiO2 layer in (d) and (g) for sample A, (e) and (h) for sample B and (f) and (i) for sample C, respectively.

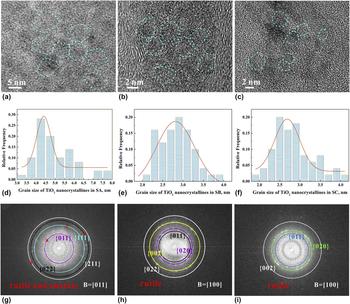
HRTEM observations of the TiO2 layers reveal the existence of TiO2 nanocrystallines, as indicated by dashed lines in Figs. 3(a)–3(c). The average grain size of the TiO2 nanocrystallines is about 3 nm in samples B [Fig. 3(b)] and C [Fig. 3(c)], being smaller than that (∼5 nm) of sample A [Fig. 3(a)]. The corresponding statistical distribution of the grain sizes of the TiO2 nanocrystallines is presented in Figs. 3(d)–3(f), and the statistical results of the layer thickness, the thickness ratios, and the grain sizes of each sample are shown in Table II. The existence of the TiO2 nanocrystallines in samples A, B, and C was further verified by the SAED patterns shown in Figs. 3(g)–3(i), respectively.
(a–c) HRTEM observation of inorganic TiO2 layers of samples A, B, and C, (d–f) statistical distribution of the grain sizes of the TiO2 nanocrystallines, and (g–i) SAED patterns.

Thickness of the PE layer and TiO2 layer, thickness ratio of the TiO2/PE layer and grain size of TiO2 nanocrystalline to each sample.

It is well known that rutile and anatase are two kinds of crystal structures of TiO2 crystalline, the rutile crystal structure tends to start to form when the pH value of the titania solution increases to 0.75, whereas the anatase crystal structure would form in a higher pH region.Reference Yamabi and Imai35 According to the above results, the anatase crystal structure was demonstrated in Fig. 3(g), which belongs to sample A with a 25-mM HCl concentration in TiO2 solution. However, only the rutile crystal structure was found as can be seen in Fig. 3(h), which belongs to sample B with the same HCl concentration in TiO2 solution to sample A but the shorter deposition time of the TiO2 layer. Hence, it is expected that the anatase crystal structure is prone to form through increasing not only the pH value but also the deposition time of the TiO2 layer.
B. Hardness and elastic modulus
Figure 4(a) shows load–indentation depth curves of the NLCs without any “pop-in” events. Comparing the results of samples B and C with that of sample A reported previously,Reference Yang, Zhang, Tan, Luo and Zhang28 we can find that the hardness (H) of the (PE/TiO2)4 NLCs fluctuates between 0.82 ± 0.08 GPa and 1.33 ± 0.31 GPa with t i/t o of the PE/TiO2 layer, as shown in Fig. 4(b). The mean strength (σ) of the NLCs calculated by σ = H/3.0 is between 273 ± 0.03 MPa to 443 ± 0.10 MPa, which is higher than that of shells reported in the literature (100–300 MPa).Reference Ji and Gao36 The elastic modulus (E) of the (PE/TiO2)4 NLCs decreases from 27.78 ± 5.69 GPa–16.55 GPa as t i/t o increases from ∼0.5 to ∼3, as shown in Fig. 4(c).
Mechanical properties of the (PE/TiO2)4 NLCs. (a) Load–depth curves of samples A, B, and C tested by using a nanoindenter, (b) hardness versus the thickness ratio of the PE/TiO2 layer, and (c) elastic modulus versus the thickness ratio of the PE/TiO2 layer.

Based on the rule of mixture, E of the NLCs should increase if the TiO2 layers took up a large volume fraction compared with those of PE ( ${E_{{\rm{Ti}}{{\rm{O}}_2}}} = 27.5\;{\rm{GPa}}$, E PE = 5 GPaReference Burghard, Zini, Srot, Bellina, van Aken and Bill23). However, according to the results shown in Fig. 4(c), the rule of mixture was not observed when t i/t o decreased below ∼3. Burghard et al. considered that the mechanical properties of (PE/TiO2)4 NLCs behave better with the increase of t i/t o.Reference Burghard, Zini, Srot, Bellina, van Aken and Bill23 Nevertheless, it is still not consistent with the results obtained in the present work. Therefore, it is believed that the thickness of the NLCs and the size of TiO2 nanocrystallines should also be considered as influence factors on mechanical properties when the NLC thickness is less than ∼320 nm, similar to the size effect in metalsReference Wang, Volkert and Kraft37 and ceramic materials.Reference Gerberich, Michler, Mook, Ghisleni, Östlund, Stauffer and Ballarini38
C. Fracture toughness
Figures 5(a)–5(c) present the fitted line of the slope of a versus b (ϕ), which is 1.12 for sample A, 1.06 for sample B, and 0.99 for sample C, respectively. Combining the elastic modulus of the NLCs obtained by nanoindentation with the thickness of the NLCs measured by TEM images, the fracture toughness (K c) of the (PE/TiO2)4 NLCs of samples A, B, and C is calculated and presented in Fig. 5(d). Generally, K c first increases from 3.30 ± 0.25 MPa m1/2 to 4.16 ± 0.20 MPa m1/2 with increasing t i/t o from ∼0.5 to ∼1, and then decreases to 2.02 MPa m1/2 with increasing t i/t o from ∼1 to ∼3, which is higher than that of pure TiO2 (0.7 MPa m1/2)Reference Burghard, Zini, Srot, Bellina, van Aken and Bill23 and is similar to that of shells (3–7 MPa m1/2).Reference Ji and Gao36 It is believed that the crack also penetrates into the hard phase in nacre when subjected to loading. The mechanism of flaw-tolerance in nacre (intergranular crack propagation manner when the crack invades the inorganic platelet) may be one of the reasons for the toughening mechanism of PE/TiO2 NLCs, and it is still need to be further investigated.Reference Huang and Li9
Fitted slope of the crack lengths propagated in the regions coated with the (PE/TiO2)4 NLCs, a, versus the crack length propagated in the Si substrate, b, of (a) sample A, (b) sample B, (c) sample C, and (d) plot of the fracture toughness versus the thickness ratio of the PE/TiO2 layer.

D. Fatigue performance
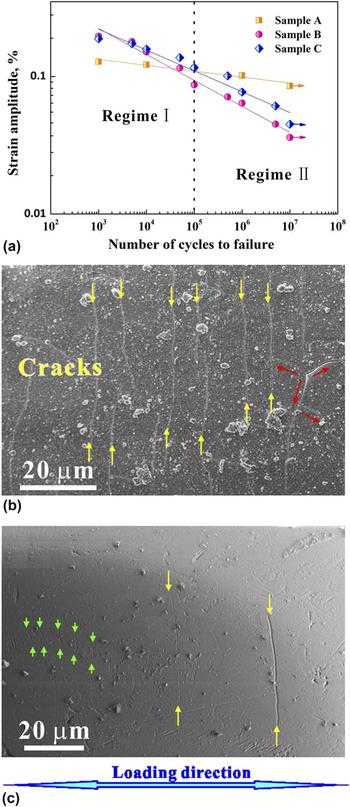
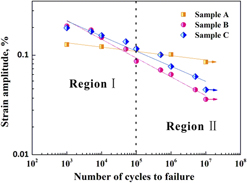
Figure 6(a) shows the relation between the applied strain amplitude (Δε/2) and the fatigue life (N f) of the NLCs fitted by Coffin–Manson relationship,
 $${{\Delta \varepsilon } \over 2} = {\varepsilon _{\rm{f}}}{\left( {2{N_{\rm{f}}}} \right)^{\rm{c}}}\quad .$$
Here, εf and c are fatigue ductility coefficient and fatigue ductility exponent, respectively. The value of εf for samples A, B, and C is 0.179, 0.823, and 0.629, respectively. The value of c for samples A, B, and C is −0.043, −0.189, and −0.152, respectively. Two distinct regimes can be found in Fig. 6(a). In regime I, fatigue strength of samples B and C is much higher than that of sample A. By contrast, in regime II, the fatigue strength of sample A is higher than that of samples B and C. It seems that the fatigue strength of sample C is a little bit higher than that of sample B. The critical strain amplitude corresponding to the fatigue limit is 0.0853% for sample A, while that is 0.036% for sample B and 0.045% for sample C. Figure 6(b) presents fatigue cracking morphology of sample A at a strain amplitude of 0.0853% after 107 cycle fatigue loading. Long straight fatigue cracks with cross-linked morphology were observed on the sample surface. In comparison, fatigue cracks of sample B became shorter and fewer at a strain amplitude of 0.036% after 107 cycle loading, as shown in Fig. 6(c).
(a) S–N curves of the applied strain amplitudes versus numbers of cycles to failure of (PE/TiO2)4 NLCs, the result of sample A is from previous work,Reference Yang, Zhang, Tan, Luo and Zhang28 (b) morphology of fatigue cracks of sample A after 107 cycle loading, and (c) morphology of the fatigue crack of sample B after loading 107 cycle loading.

It is generally accepted that εf is closely related to the tensile ductility of a metal.Reference Suresh39 In the present work, samples B and C exhibited the higher fatigue strength than sample A in regime I. It is expected that the high fracture toughness of sample B would provide a strong resistance to crack growth in NLCs and lead to the formation of shorter cracks in sample B than those in sample A. In addition, it is suggested that the low fatigue strength of sample A with the TiO2 layer thickness of ∼60 nm in regime I is because the material is more sensitive to flaws when the length scale of the inorganic layer is up to 30 nm.Reference Gao, Ji, Jager, Arzt and Fratzl29 Furthermore, the TiO2 nanocrystallines may offer the possibility of grain boundary sliding. Grain boundaries in sample B (∼3 nm nanograins) and sample C (∼3 nm nanograins) dissipated more energy; cracks were much easier to grow in sample A (∼5 nm nanograins).
With decreasing the applied strain amplitude to regime II, the fatigue life is dominated mainly by fatigue crack initiation, which is controlled by the strength of the materials. The strengths of sample A (σ = 393 MPa) and sample C (σ = 443 MPa) are higher than that of sample B (σ = 273 MPa). Hence, samples A and C exhibited the higher fatigue strength than sample B with decreasing the applied strain amplitude.
The physical meaning of the parameter c in Eq. (4) should represent the ability to resist the fatigue crack initiation, which is dominated by the damage mechanism of the material. In regime II, on the one hand, the high strength of sample A resisted the crack initiation; on the other hand, the TiO2 bridges and nano-asperities interlocking [Fig. 2(a)] between the TiO2 layers of sample A provided an inelastic shearing resistance to dissipate more energy for crack growth and promoted the crack deflection, just like the interlocking mechanism existed in nacre and other nacre-mimetic nanocompostites,Reference Zhao, Yue, Guo, Wu, Zhang, Li, Mao and Han11,Reference Tao, Liu, Koley and Li40 leading to formation of the cross-linked cracking morphology in sample A. Hence, sample A exhibited the highest ability to resist the fatigue damage in regime II.
To obtain the optimum fatigue properties of nanocomposites, two basic strategies may need to be considered based on the Coffin–Manson formula, i.e., enhancing εf and increasing c. The fatigue performance of the present NLCs shown in Fig. 6(a) suggests that the fracture toughness and the length scales (layer thickness and nanograin size) would have a great effect on fatigue ductility coefficient εf, while the strength coupled with the bridge bonding and nanoasperities interlocking between TiO2 layers could play a significant role in fatigue ductility exponent c. The present findings provided a potential strategy to design NLCs with good fatigue performance through tuning both geometrical scales (layer thickness and thickness ratio) and microstructure scales (grain size of inorganic layers). It is believed that the fatigue performance of the NLCs might be improved by modulating the thickness ratio of the TiO2/PE layers to ∼3 for the formation of bridge bonding and the thickness of the TiO2 layer to below 30 nm for obtaining the length scale effect.
IV. CONCLUSIONS
(1) Nacre-mimetic (PE/TiO2)4 NLCs with different thickness ratios of inorganic/organic layers were prepared by LBL self-assembly and CBD method. The thickness ratio of the TiO2/PE layer was ∼3, ∼1, and ∼0.5, respectively. The TiO2 layer in the NLCs consisted of nanocrystallines and the thickness was less than 30 nm.
(2) The ultimate elastic modulus, hardness, and fracture toughness of the NLCs reached 27.78 ± 5.69 GPa, 1.33 ± 0.31 GPa, and 4.16 ± 0.20 MPa m1/2, respectively.
(3) The fatigue performance of the NLCs in the high and low cycle fatigue regimes was modulated by the thickness ratio of the TiO2/PE layers. The PE/TiO2 NLCs with the larger thickness ratio of ∼3 has the high fatigue limit (the critical strain amplitude of 0.0853%) in the high-cycle fatigue regime, while the NLCs with the smaller thickness ratio of ∼1 and ∼0.5 are of the high fatigue strength in the low-cycle fatigue regime.
ACKNOWLEDGMENT
This work was supported by the National Natural Science Foundation of China (NSFC, Grant Nos. 51671050 and 51571199).