Approximately one third of people over the age of 65 fall at least once a year and people who have sustained a fall are at greater risk of falling again (Reference Close, Ellis and Hooper9;Reference Gillespie, Gillespie and Robertson14). People who have fallen show increased morbidity and healthcare utilization, resulting in excessive healthcare costs (Reference Blake, Morgan and Bendall2;Reference Chang, Morton and Rubenstein8;Reference Close, Ellis and Hooper9;Reference Gillespie, Gillespie and Robertson14;Reference Kannus, Sievanen and Palvanen19;Reference Kiel, O'Sullivan, Teno and Mor20;Reference Nevitt, Cummings and Hudes24;Reference Rizzo, Friedkin and Williams32;Reference Sattin, Rodriguez, DeVito and Wingo39;Reference Speechley and Tinetti43;Reference Tinetti, Speechley and Ginter46). Approximately 20 percent of fall incidents require medical attention (Reference Gillespie, Gillespie and Robertson14;Reference Kannus, Sievanen and Palvanen19). Recent studies confirm that falls are associated with substantial costs (Reference Carroll, Slattum and Cox7;Reference Chang, Morton and Rubenstein8;Reference Meerding, Bonneux and Polder22;Reference Meerding, Mulder and van Beeck23;Reference Newton, Kyle and Liversidge25;Reference Polder, Taken, Meerding, Kommer and Stokx28;Reference Roudsari, Ebel and Corso36;Reference Scuffham, Chaplin and Legood41;Reference Stevens, Corso, Finkelstein and Miller45), and these costs are expected to rise further due to the aging population. In view of this finding, researchers, policy makers, and practitioners have become interested in the costs and effects of fall prevention programs among elderly people. Currently, there is evidence for the effectiveness of multidisciplinary and multifactorial interventions that screen for health and environmental risk factors and address these risk factors in people at risk for falling (Reference Chang, Morton and Rubenstein8;Reference Gillespie, Gillespie and Robertson14;Reference Kannus, Sievanen and Palvanen19). However, the effects of these interventions are generally small, and there is some inconsistency in the results of different trials in this domain (Reference Gillespie, Gillespie and Robertson14). Recently, some economic evaluations of fall prevention programs have been performed, but these studies were limited in their measurement of healthcare costs, did not include patient family costs, or did not study multidisciplinary intervention programs (Reference Beard, Rowell and Scott1;Reference Campbell, Robertson and La Grow6;Reference Close, Ellis and Hooper9;Reference Rizzo, Baker, McAvay and Tinetti31;Reference Robertson, Devlin, Gardner and Campbell33–Reference Robertson, Gardner and Devlin35;Reference Salkeld, Cumming and O'Neill38;Reference Smith and Widiatmoko42). Generally, cost-effectiveness of multidisciplinary fall prevention programs has to be explored in greater detail (Reference Gillespie, Gillespie and Robertson14). Therefore, we re-evaluated a British multidisciplinary intervention program with shown effectiveness in preventing falls and functional decline (Reference Close, Ellis and Hooper9), to evaluate its costs and effects in the Dutch healthcare setting from a broad societal perspective, which suggests that all relevant costs and outcomes were taken into account, regardless of who pays the costs and who benefits from the effects (Reference Oostenbrink, Bouwmans, Koopmanschap and Rutten26;Reference Oostenbrink, Koopmanschap and Rutten27).
This study reports on the economic evaluation of this multidisciplinary fall prevention program. The evaluation aimed to assess whether this multidisciplinary intervention program would be preferable to usual care in the Netherlands when assessed from a societal perspective in terms of costs and effects.
METHODS
Design and Participants
The economic evaluation was embedded in a two-group randomized controlled trial (RCT) with 12 months of follow-up. The trial design (ISRCTN 64716113) was approved by the Medical Ethics Committee of the Maastricht University and University Hospital. Details of the design have been published previously (Reference Hendriks, van Haastregt and Diederiks18).
Economic evaluations compare additional costs and additional effects of an intervention program with those of usual care. The differences in costs and effects are presented in incremental cost-effectiveness ratios (ICERs). ICERs represent the differences in mean costs between the intervention and usual care groups in the numerator and the difference in mean effects in the denominator (Reference Drummond, Sculpher and Thorrance13). The present economic evaluation involved a combination of cost-effectiveness analysis (CEA) and cost-utility analysis (CUA). A CEA presents effects in terms of clinical outcomes (in our study falls and daily functioning), whereas a CUA presents effects in terms of quality-adjusted life-years (QALYs) (Reference Drummond, Sculpher and Thorrance13).
Participants for the trial were recruited at the accident and emergency (A&E) department and the general practitioner cooperative (GP cooperative, responsible for the out of hours A&E care) of the Maastricht University Hospital. Participants were included if they were 65 years of age or over, and had visited the A&E department or GP cooperative for the consequences of a fall. Participants were excluded if they were unable to speak or understand Dutch, were unable to complete questionnaires or interviews by telephone, were cognitively impaired, had been admitted for more than 4 weeks to a hospital or other institution, and/or were permanently wheelchair-dependent or bedridden. Eligible participants who signed the informed consent form and returned a completed baseline questionnaire were allocated to the intervention or control group by computerized alternate random allocation by an external agency. Participants allocated to the intervention group were invited to undergo a medical and occupational-therapy assessment followed by recommendations or further referral if indicated. The control group received usual care only. No restrictions were placed on co-interventions in both groups.
Intervention
The intervention was based on the interdisciplinary intervention program developed by Close et al. (Reference Close, Ellis and Hooper9) and adapted for use in the Dutch setting (Reference Hendriks, Bleijlevens and van Haastregt16). The intervention consisted of a medical and occupational-therapy assessment that aimed to assess and address potential risk factors for falls. The medical assessment comprised a comprehensive general examination, and detailed assessment of vision, hearing, balance, mobility, peripheral nervous system, feet, footwear, cognition, affect, and medication use (Reference Hendriks, Bleijlevens and van Haastregt17). The medical assessment was performed by a geriatrician, a geriatric nurse, and a rehabilitation physician in the hospital. Upon completion of the medical assessment, the geriatrician wrote a summary of the results plus recommendations and/or referrals to relevant services (if indicated) to the participant's GP, who was then expected to take action if he/she agreed with the recommendations. Participants were advised to contact their GP to be informed of the results and recommendations. After the medical assessment, an occupational therapist visited the participants at home for an assessment of daily functioning (Reference Schuling, de Haan, Limburg and Groenier40), environmental hazards (Reference Stalenhoef, Diederiks and Knottnerus44), and psychological consequences of the fall (Reference Rai, Kiniorns and Wientjes29). During and after the occupational-therapy assessment, recommendations with regard to behavioral change, functional needs, and safety within the home environment were given to the participants. To increase compliance, a copy of the recommendations was sent to the participants and their GPs. The intervention period was scheduled to last for approximately 3.5 months after baseline measurement.
Usual Care
Currently, no standard approach to fall risk assessment is available for fallers presenting to the A&E department and discharged home, although such persons have a high prevalence of fall risk factors and a high risk of functional decline (Reference Russell, Hill and Blackberry37). In usual care in the Netherlands, medical risks and other risk factors such as environmental hazards are not systematically recorded and addressed by hospital physicians, specialists or GPs. Moreover, when people present to the A&E department or the GP cooperative after a fall, the injuries are taken care of, but no systematic attention is generally paid to the specific causes of the falls.
Measurements
Participants were followed for 12 months after baseline. To ensure blinding during data collection, measurements by phone were contracted out to an independent call center (Centre for Data and Information Management, MEMIC), whose operators have been trained to administer questionnaires and were unaware of group allocation.
Cost Measures
We assessed intervention program costs, other healthcare costs, and patient and family costs. Program costs were based on the time the healthcare professionals spent performing the assessments, as recorded during the intervention period. The average amount of time per participant was 20 minutes for the geriatrician's consultation plus 15 minutes of administrative time per geriatrician, 20 minutes for the geriatric nurse's consultation, 20 minutes for the rehabilitation physician's consultation, and 1 hour for the home visit by the occupational therapist (OT), plus 15 minutes of administrative time for the OT. Other healthcare costs in our study related to general practitioners' consultations or home visits, inpatient and outpatient specialist care, hospital admissions, admissions to nursing homes or homes for the elderly, paramedics consultations (e.g., physiotherapy), alternative medicine, aids and assistive devices, professional home care, and prescribed and over-the-counter medication. Patient and family costs included home modifications and out-of-pocket expenses such as costs of informal care and paid domestic help. Productivity losses were not assessed because they are of limited relevance in a population of mostly retired elderly persons (the age of retirement in the Netherlands being 65). All healthcare and patient and family costs were measured by means of a cost diary (Reference Goossens, Rutten van Molken, Vlaeyen and Van Der Linden15), in which participants continuously recorded volumes of healthcare utilization during the 12-month follow-up period. In monthly telephone interviews, participants were asked to report the data from their cost diary for the previous month. Participants were asked whether they had received care (or devices or services) or not. If participants answered the question on a particular topic affirmatively, they were asked to indicate the number of visits, hours of care, or details about the specific type of healthcare utilization.
For cost valuation, we used the updated Dutch manual for cost analysis in healthcare research; for details see this manual (Reference Oostenbrink, Bouwmans, Koopmanschap and Rutten26;Reference Oostenbrink, Koopmanschap and Rutten27). Briefly, we used standardized cost prices. Where no standardized cost prices were available, real costs or tariffs were used to estimate costs. In case of uncertainty, we used a conservative estimation (i.e., the lowest cost price). Costs of the intervention program were based on standardized cost prices for care delivered by the medical and paramedical practitioners who performed the assessments. Costs of medication were calculated using prices based on daily defined dosage, taken from a manual to help doctors prescribe drugs efficiently (11), indicating mean medication use per adult per day, including claw-back (discount pharmacists are obliged to pass on to the patients) (11;Reference Tinke and Griens47). We added Value Added Tax (Reference Tinke and Griens47), plus an addition for prescription charges for prescribed medication. Prices of informal care were based on shadow prices for unpaid work (meaning a standardized cost price based on general hourly wages). Costs of transport were calculated as the mean distance per destination multiplied by standardized cost prices. Hence, costs of transportation are not presented separately, but included in the prices per subcategory.
Cost prices are presented in euros from the baseline year 2004, and otherwise indexed to the baseline year. The consumer price index we used was 4 percent, as suggested in the Dutch manual (Reference Oostenbrink, Bouwmans, Koopmanschap and Rutten26). Because the recruitment period was 14 months and the follow-up period was relatively short (12 months), it is unlikely that there were substantial differences in healthcare consumption and effects between participants who were included at the beginning of the recruitment period and those included toward the end. Hence, there were no reasons to discount volumes of healthcare consumption or effects.
Health Outcome Measures
The primary outcome measure for the cost-effectiveness analysis was the number of people sustaining a fall during 1 year of follow-up. Falls were recorded continuously by means of a falls calendar for 12 months after baseline. Participants were asked to report the data from their falls calendar relating to the previous month during the same monthly telephone interview in which they reported data from the cost diary. The secondary outcome measure was activities of daily living, measured by means of the Frenchay Activity Index (FAI) (Reference Schuling, de Haan, Limburg and Groenier40) in a self-administered questionnaire that was sent to all participants at baseline and after 4 and 12 months of follow-up.
In the cost-utility analysis, primary outcomes were measured in terms of QALYs. QALYs were estimated using participants' responses to the standard Dutch version of the EuroQol (EQ-5D) (Reference Brooks5;Reference Drummond, Sculpher and Thorrance13) in self-administered questionnaires at baseline and after 4 and 12 months. A direct value for every state of health was generated using the social tariff (Reference Dolan12;Reference Drummond, Sculpher and Thorrance13), which involves an algorithm for interpolating EuroQol results to population utilities. Utilities refer to preferences that individuals or society may have for a particular set of health outcomes (Reference Drummond, Sculpher and Thorrance13). The utilities at the three measurement points (at baseline and after 4 and 12 months) were used to compute a QALY score by means of the area under the curve method. The area under the curve is the duration of the health state (on the x-axis) multiplied by the quality weight for the health state (on the y-axis), and represents the number of QALYs gained (Reference Drummond, Sculpher and Thorrance13). In addition, specific quality of life was measured by means of the Falls Handicap Inventory (FHI) (Reference Rai, Kiniorns and Wientjes29). This instrument measures handicaps associated with falls. The instrument consists of eighteen questions, seven covering the emotional domain and eleven covering function/health.
Analysis
Power calculations for the present trial were based on a clinically relevant change in falls. Assuming a dropout rate of 25 percent, a sample of 164 patients was needed, equally distributed over the intervention and control groups (18). The analysis included those persons for whom at least 75 percent of the follow-up measurements of cost diary and falls calendar were available. Missing data were replaced by individual means of valid data. For the cost diary, imputation was done at the variable level before multiplying by the cost prices. For the other measures, missing data were negligible. Our primary analyses (base-case analyses) were performed according to the intention-to-treat principle, including all participants with valid data on costs and outcomes, regardless of whether they received the intervention or not. Although cost data are usually right-skewed and truncated to zero, decision makers are interested in the total costs of treating all patients, as well as in those persons consuming a disproportionate volume of health care. Therefore, despite the usual skewness in the distribution of costs, arithmetic means are generally considered the most appropriate measures to describe cost data (Reference Drummond, Sculpher and Thorrance13;Reference Ramsey, Willke and Briggs30). For this reason, arithmetic means (and standard deviations) are presented here and t-tests were used to test for significant differences between the intervention and control groups. The robustness of the cost analyses was checked by (1,000 times) bootstrapping (percentile method) (Reference Briggs, Wonderling and Mooney4;Reference Drummond, Sculpher and Thorrance13). Nonparametric bootstrapping is a method based on random sampling with replacement based on individual data of the participants (Reference Briggs, Wonderling and Mooney4;Reference Drummond, Sculpher and Thorrance13). Uncertainty in the ICERs was also tested by means of bootstrapping based on the costs and outcomes of the participants in the trial.
One-way sensitivity analyses were performed to demonstrate the robustness of the assumptions in our base-case analyses (Reference Briggs, Sculpher and Buxton3;Reference Drummond, Sculpher and Thorrance13). We compared our base-case CUA analyses with the following alternatives: analyses with double program costs, complete case analysis (including all participants for whom 100 percent of the effect and cost data were available), per-protocol analysis (control group versus all participants who underwent both medical and occupational-therapy assessments), and QALYs based on utilities calculated with Dutch EuroQol tariffs (Reference Lamers, Stalmeier and McDonnell21). Furthermore, we performed analyses including persons with valid data on outcomes but without cost data, by means of population mean imputation on costs.
Background characteristics were analyzed by means of t-tests or Chi-squared tests. Clinical outcomes at baseline and after 4 and 12 months of follow-up were analyzed by means of t-tests, Chi-squared tests, or in the case of a skewed distribution, Mann-Whitney U-tests.
RESULTS
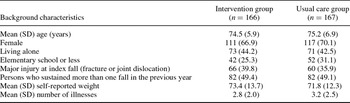
The study started with 333 participants, who were randomly assigned to intervention group (n = 166) or control group (n = 167). At baseline, the intervention and control groups were comparable in terms of background characteristics (see Table 1), quality of life, and clinical outcomes (see Table 3).
Background Characteristics or Outcomes Measured at Baseline of Intervention and Control Groupsa

aValues are numbers (percentages) unless stated otherwise.
Overall, 72 percent (n = 120) of the participants in the intervention group received both the medical and occupational-therapy assessments, and 83 percent received at least one of the assessments. Ninety-seven percent of the items of both assessments were carried out according to protocol. After 12 months of follow-up, 25 percent (n = 42) of the participants had dropped out of the intervention group, and 20 percent (n = 33) dropped out of the control group. Overall, 120 participants of the intervention group and 129 of the control group were available for cost analysis and ICER calculation. Reasons for dropout were comparable in the two groups. The main reason for dropping out of the study was health problems. Participants who withdrew from the study during the 12-month follow-up period were on average older, had lower scores on the FAI and higher scores on the FHI at baseline, and reported more illnesses at baseline compared with those who completed the study. However, after 12 months of follow-up, the intervention and control groups remained comparable in terms of background characteristics, except for level of education. Of the participants who remained in the study, Reference Stalenhoef, Diederiks and Knottnerus44 (32 percent) in the intervention group reported only elementary school education or less, versus 26 (21 percent) in the control group (p =.032).
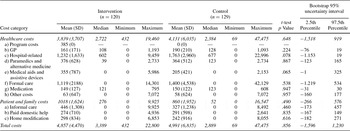
Table 2 shows the results of the cost analysis for the various cost categories, presented as arithmetic means and standard deviations (for details about volumes of healthcare resources consumed, please contact the first author). The mean intervention cost per participant amounted to €385. Despite these program costs, the mean healthcare costs were somewhat lower in the intervention group. On the other hand, the intervention group showed somewhat higher mean patient and family costs. Nevertheless, the differences were not significant according to t-tests on arithmetic means or uncertainty intervals on bootstrapped mean differences. No significant differences between the two groups were detected in subcategories of healthcare costs or patient and family costs. Overall, mean total costs were somewhat higher in the control group (€4,991) compared with the intervention group (€4,857), but this difference was not significant according to t-tests on arithmetic means or uncertainty intervals on bootstrapped mean differences.
Mean Annual Costs in Euros per Resource Category, from a Societal Perspective

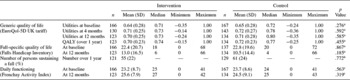
Table 3 shows the results regarding quality of life and clinical outcome measures for the intervention and control groups. We found no significant difference between the groups with regard to generic quality of life or fall-specific quality of life, or with regard to falls or daily functioning.
Results Regarding Quality of Life and Clinical Outcome Measuresa

aMann-Whitney U-test analysis.
bChi-squared analysis.
ct-test analysis.
QALY, quality-adjusted life-year.
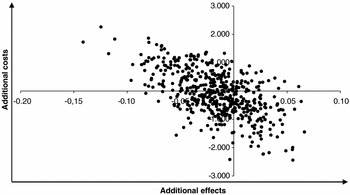
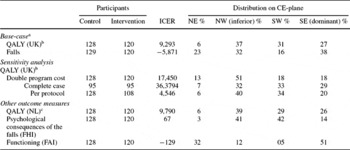
Because we detected differences neither in costs nor effects, it is not useful to present incremental cost-effectiveness or cost-utility ratios. Bootstrap analysis confirmed that there were no differences in effects or costs between the groups. Cost-effectiveness planes (CE-planes) visualize the results of a bootstrap analysis, with costs on the y-axis and effects on the x-axis, every dot representing an ICER computed for one bootstrap sample. Figure 1 shows the CE-plane of the CUA base-case analysis for QALYs, with only 27 percent of the ICERs in the dominant quadrant (representing the probability of the intervention having more effect and lower costs compared with usual care).
Cost-effectiveness plane for costs (euros) versus quality-adjusted life-years.

Table 4 shows the results of the sensitivity analyses to test alternatives for the assumptions we made for uncertain components in our base-case analysis. Analyses with double program costs, per protocol analyses, and complete case analyses showed no differences in cost-effectiveness ratios. The differences in costs and effects between the groups did not alter and remained statistically nonsignificant. Inclusion of people with valid effect data but with imputed cost data (population mean) in the analysis did not result in differences either (not tabulated).
Results of the Sensitivity Analysis: Base-Case versus Other Bootstrap Analyses

aBase case means 1-year follow-up, intention-to-treat, 1,000× bootstrap.
bQALYs based on utilities calculated with United Kingdom EuroQol tariffs.
cQALYs based on utilities calculated with Dutch EuroQol tariffs.
ICER, incremental cost-effectiveness ratio; CE-plane, cost-effectiveness plane; QALY, quality-adjusted life-year; FHI, Falls Handicap Inventory; FAI, Frenchay Activity Index; NE, northeast quadrant; NW, northwest quadrant; SW, southwest quadrant; SE, southeast quadrant.
DISCUSSION
This study showed that the multidisciplinary intervention program to prevent falls was not cost-effective compared with usual care in the Netherlands. Overall, we can conclude that healthcare utilization in the intervention and control groups was comparable. Our analyses showed no effect of the intervention program on falls, daily functioning, or quality of life measures. Also extensive effect analyses of the RCT showed no significant differences in various other outcome measures (i.e., recurrent falls, injurious falls, time to the first fall, recuperation from the fall, health complaints, perceived health, fear of falling, activity avoidance, mental health, activities of daily living and instrumental activities of daily living disability, social participation) (17). Sensitivity analysis did not change our conclusions about cost-effectiveness, showing that the assumptions made in our base-case analysis were robust. Per-protocol analyses and complete case analyses did not result in differences in cost-effectiveness either.
Three limitations of the study have to be discussed. The first limitation is that the duration of follow-up was only 1 year. Although most studies on fall prevention programs have a 1-year follow-up period, it seems reasonable to suppose that a longer follow-up would be better able to detect differences in healthcare consumption. Because present expensive investments (e.g., home adaptations) may prevent or at least postpone high future expenditures (e.g., admission to a nursing home), cost differences may only be detectable after a longer period of follow-up. When planning new cost-effectiveness studies to prevent falls by elderly people, we recommend extending the follow-up measurements of costs and effects to at least 2 years, to ensure that all consequences of the intervention can be measured. However, one should then keep in mind that a longer follow-up period may represent a burden to the participants and that the number of dropouts may increase over time. Another option would be to build a model to test the cost-effectiveness of the intervention over a period longer than the time horizon of the trial. This can be done by means of decision-analytic or microsimulation models (13). The second limitation is that we did not correct for baseline differences in healthcare utilization. Because recruitment of participants took place after they had sustained a fall, we have no baseline information about healthcare utilization before the fall. However, because participants were randomly allocated to the intervention and control groups, we have no reason to assume differences in healthcare utilization between the groups. The third limitation is that our analyses were not restricted to costs related to falls only, but compared all healthcare costs and patient and family costs. Because falls account for only part of the total health expenditures of elderly people, differences in costs related to falls might not be observable. However, in view of the variety of risk factors for falls (including poor eyesight, mobility problems, and neurological problems), it is hardly possible to distinguish costs related to falls from other healthcare costs.
This is the first published economic evaluation in the Netherlands to assess the costs and effects of a multidisciplinary intervention program to prevent falls from a broad societal perspective. Although some other attempts have been made to study cost-effectiveness of fall prevention programs, these are difficult to compare with the current study because they differ in methodology or studied other aspects of fall prevention programs (Reference Beard, Rowell and Scott1;Reference Campbell, Robertson and La Grow6;Reference Close, Ellis and Hooper9;Reference Rizzo, Baker, McAvay and Tinetti31;Reference Robertson, Devlin, Gardner and Campbell33–Reference Robertson, Gardner and Devlin35;Reference Salkeld, Cumming and O'Neill38;Reference Smith and Widiatmoko42). We re-evaluated the study by Close and her colleagues in the United Kingdom. In terms of the costs associated with the intervention program, no detailed comparison can be made with this study we re-evaluated due to limited data available (Reference Close, Ellis and Hooper9). Close et al. only reported that the program was cost-neutral (Reference Close, Hooper and Glucksman10). Our study also found the intervention to be cost-neutral. It is remarkable, however, that Close and her colleagues (Reference Close, Ellis and Hooper9) reported the intervention to be highly effective in preventing falls in the United Kingdom, whereas our study demonstrated no such effects. Overall, we conclude that, although the intervention program was cost-neutral in the Netherlands, it did not prevent falls or functional decline and did not improve quality of life. Therefore, although the intervention did not result in higher costs for the intervention group, we do not recommend implementing the intervention program in its present form in the Netherlands. At the same time, however, it must be said that falls do have an important impact on society as well as on individuals in terms of costs and effects, and economic evaluations of promising interventions to prevent falls, therefore, remain necessary.
CONTACT INFORMATION
Marike R. C. Hendriks, MSc (m.hendriks@zw.unimaas.nl, marike.hendriks@beoz.unimaas.nl), Researcher, Department of Social Medicine; Assistant Professor, Department of Health Organization Economics and Policy; Researcher, School for Public Health and Primary Care (Caphri), Faculty of Health, Medicine and Life Sciences, Silvia M. A. A. Evers, PhD (s.evers@beoz.unimaas.nl), Assistant Professor, Department of Health Organization Economics and Policy; Researcher, School for Public Health and Primary Care (Caphri), Faculty of Health, Medicine and Life Sciences, Michel H. C. Bleijlevens, MSc (m.bleijlevens@socmed.unimaas.nl), Researcher, Department of Social Medicine, Faculty of Health, Medicine and Life Sciences; Researcher, School for Public Health and Primary Care (Caphri), Faculty of Health, Medicine and Life Sciences, Jolanda C. M. van Haastregt, PhD (j.vanhaastregt@zw.unimaas.nl), Researcher, School for Public Health and Primary Care (Caphri), Faculty of Health, Medicine and Life Sciences, Harry F. J. M. Crebolder, PhD, MD (harry.crebolder@hag.unimaas.nl), Professor, Department of General Practice; Professor, School for Public Health and Primary Care (Caphri), Faculty of Health, Medicine and Life Sciences, Jacques Th. M. van Eijk, PhD (j.vaneijk@socmed.unimaas.nl), Professor, Department of Social Medicine; Professor, School for Public Health and Primary Care (Caphri), Faculty of Health, Medicine and Life Sciences, Maastricht University, P.O. Box 616, 6200 MD Maastricht, The Netherlands