Introduction
Global arid regions are regions of land with limited water, relatively infertile soils and sparse vegetation cover that are fragile and sensitive to climate change (D’Odorico and Porporato, Reference D’Odorico, Porporato and Runyan2019; Smith et al., Reference Smith, Dannenberg, Yan, Herrmann, Barnes, Barron-Gafford and Biederman2019). Arid regions currently occupy approximately 40% of the Earth’s land surface, supporting the livelihood of more than a third of the world’s population (Reynolds et al., Reference Reynolds, Smith, Lambin, Turner, Mortimore, Batterbury and Downing2007; Mortimore et al., Reference Mortimore2009). In addition to the importance of drylands for human population and economy, recent research has shown the critical global ecological role played by drylands. Knowledge of how climate change under global warming will affect the extent of global arid regions is essential for the human population, social economy, and land-use management in these regions (Ahlström et al., Reference Ahlström, Raupach, Schurgers, Smith, Arneth, Jung and Reichstein2015). Both observations and climate model simulations have revealed that ongoing global warming will lead to arid regions becoming drier (Held and Soden, Reference Held and Soden2006; Seager et al., Reference Seager, Ting, Held, Kushnir, Lu, Vecchi and Huang2007; Feng and Fu, Reference Feng and Fu2013; Routson et al., Reference Routson, McKay, Kaufman, Erb, Goosse, Shuman, Rodysill and Ault2019). However, to date, there has been little agreement on the relevant dynamics of the expansion of global arid regions.
Atmospheric circulation shapes Earth’s diverse regional climates. Affected by the sinking portion of Hadley cell circulation (subtropical high), the climate in subtropical regions is often dry and rainless, forming vast arid regions and deserts (Li et al., Reference Li, Li, Ting and Liu2012). Some researchers have reported that the edges of Hadley cell circulation patterns are migrating toward higher latitudes under global warming (Fu et al., Reference Fu, Johanson, Wallace and Reichler2006; Hu and Fu, Reference Hu and Fu2007; Lu et al., Reference Lu, Vecchi and Reichler2007; Scheff and Frierson, Reference Scheff and Frierson2012). Compared with relatively mature mid-latitude and equatorial dynamic climate studies, subtropical dynamic climate studies have focused more on examining the systematic poleward migration in oceanic and atmospheric circulation (Wang et al., Reference Wang, Xiang and Lee2013; Yang et al., Reference Yang, Lohmann, Wei, Dima, Ionita and Liu2016, Reference Yang, Lohmann, Krebs‐Kanzow, Ionita, Shi, Sidorenko, Gong, Chen and Gowan2020, Reference Yang, Lu, Wang, Shi and Lohmann2022, Reference Yang, Lohmann, Shi and Müller2023). Earlier studies suggested that the shifting subtropical high is primarily driven by human-induced changes in the concentrations of greenhouse gases, aerosols, and ozone (Lu et al., Reference Lu, Vecchi and Reichler2007; Polvani et al., Reference Polvani, Waugh, Correa and Son2011; Thompson et al., Reference Thompson, Solomon, Kushner, England, Grise and Karoly2011; Allen et al., Reference Allen, Sherwood, Norris and Zender2012; Cherchi et al., Reference Cherchi, Ambrizzi, Behera, Freitas, Morioka and Zhou2018). CO2 concentrations cause the strongest longwave radiation anomaly over the subtropics, which could enhance the mid-latitude meridional temperature gradients (Yang et al., Reference Yang, Lu, Wang, Shi and Lohmann2022). The cooling of Antarctica due to the ozone hole helps to steepen the high-latitude meridional temperature gradients and the migration of westerlies toward high latitudes (Thompson et al., Reference Thompson, Solomon, Kushner, England, Grise and Karoly2011; Orr et al., Reference Orr, Bracegirdle, Hosking, Feng, Roscoe and Haigh2012). It is well-established that zonally asymmetric forcing is a key factor for changes in the subtropical high (Seager et al., Reference Seager, Murtugudde, Naik, Clement, Gordon and Miller2003; Zhou et al., Reference Zhou, Yu, Zhang, Drange, Cassou, Deser and Hodson2009). However, observations have indicated that the shifting subtropical high is regionally dependent and has a strong interannual variability that is closely linked to the regional sea-surface temperature (SST) (Wang et al., Reference Wang, Xiang and Lee2013; Nguyen et al., Reference Nguyen, Evans, Lucas, Smith and Timbal2013; Chen et al., Reference Chen, Wei, Chen and Song2014). Yang et al. (Reference Yang, Lohmann, Wei, Dima, Ionita and Liu2016) reported that uniform SST warming changes the intensity and migration of mid-latitude meridional temperature gradients. Relatively strong and poleward-advancing mid-latitude meridional temperature gradients promote tropical expansion, which can affect mid-latitude circulation patterns (Yang et al., Reference Yang, Lohmann, Wei, Dima, Ionita and Liu2016, Reference Yang, Lu, Wang, Shi and Lohmann2022). Additionally, some previous studies have indicated that the different spatial warming patterns play a role in changing circulation patterns by changing the temperature gradient and further modulating interhemispheric moisture transport (e.g., Chen and Zhou, Reference Chen and Zhou2015). Based on paleoclimate records and model simulations, Routson et al. (Reference Routson, McKay, Kaufman, Erb, Goosse, Shuman, Rodysill and Ault2019) claimed that abnormal warming of the northern high latitudes weakens the equator-to-pole temperature gradient and can result in a considerable change in mid-latitude water vapor sources in the Mid-Holocene.
One approach to understanding future climate change is to use past climate events as analogs (Tierney et al., Reference Tierney, Poulsen, Montañez, Bhattacharya, Feng, Ford and Hönisch2020; Wu et al., Reference Wu, Ma, Yuan, Hillman, Zhang, Chen and Zhou2022). The last glacial maximum (LGM) had lower solar radiation intensity and greenhouse gas levels, making it the most extreme cold-climate period in contrast to the modern and future warming scenarios (Yokoyama et al., Reference Yokoyama, Lambeck, de Deckker, Johnston and Fifield2000; Clark et al., Reference Clark, Dyke, Shakun, Carlson, Clark, Wohlfarth, Mitrovica, Hostetler and McCabe2009). Studies have shown that the LGM and modern warm climates with raised CO2 levels share similarities in temperature and precipitation changes, although the magnitudes and directions of change differ (Li et al., Reference Li, Harrison, Bartlein, Izumi and Colin Prentice2013; Izumi et al., Reference Izumi, Bartlein and Harrison2013; Lowry and Morrill, Reference Lowry and Morrill2019). This reverse-analog approach allowed us to explore large-scale climatic mechanisms that may also be relevant for future climate projections, such as the role of atmospheric circulation and temperature gradients in controlling regional precipitation and aridification patterns. By examining warm paleoclimates in the LGM, we can gain insights into how dry/wet changes are spatially distributed, which is particularly useful for understanding the evolution of global arid regions under future warming scenarios.
Much uncertainty still exists regarding the relationship between the evolution of global arid regions and the shifting of the subtropical high under global warming. We compared climate model simulations during the LGM, PI, and future warming projections, and deduced that the poleward migration of the subtropical high forces the expansion of global arid regions. This comparative approach allowed us to explore whether the mechanisms driving the expansion of arid regions during the LGM can inform predictions about the future behavior of arid regions under anthropogenic warming.
Materials and methods
Modern datasets and the definition of global arid regions
Global monthly observation data of temperatures during the time period from 1960–2020 were obtained from the Climatic Research Unit Time-Series version 4.05 (CRU TS4.05). CRU TS4.05 is a high-resolution, gridded, multivariate climate dataset with a horizontal resolution of 0.5° (Harris et al., Reference Harris, Osborn, Jones and Lister2020; https://crudata.uea.ac.uk/cru/data/hrg/cru_ts_4.05). We calculated the linear trend of global temperatures during the time period from1960–2020 based on the CRU TS4.05. Arid regions are commonly defined by their ratio of mean annual precipitation (P) and potential evaporation (PE) (aridity index, AI) (Middleton et al., Reference Middleton and Thomas1992; Ojima et al., Reference Ojima, Dirks, Glenn, Owensby and Scurlock1993; Hulme, Reference Hulme1996). Conforming to the definition of arid regions (areas with an AI greater than 0.65) established by the United Nations Environmental Programme (UNEP; Middleton et al., Reference Middleton and Thomas1992) and using the CRU TS4.05, we obtained the distributions and range of global arid regions.
Climate model simulations
The multiple models in the Paleoclimate Model Intercomparison Project Phase 4 (PMIP4) and Phase 3 (PMIP3) (https://esgf-node.llnl.gov/projects/esgf-llnl) were composited to simulate the relative variability in precipitation minus evaporation (P−E) geopotential height field, wind field, and virtual lake-level between the LGM and pre-industry (PI) periods. We considered the pre-industry period to be a typical period of the modern warm period in order to measure the changes in hydroclimate conditions and atmospheric circulations relative to the cooling LGM period. We selected the output datasets of multiple models from the Coupled Model Intercomparison Project Phase 6 (CMIP6) and Phase 5 (CMIP5), which have high resolutions with improved dynamic processes, to project different climate responses and mechanisms under global warming. The shared socioeconomic pathway (SSP)-based scenarios are updated versions of the representative concentration pathways (RCP) in CMIP5 and are applied for future climate change simulations (Eyring et al., Reference Eyring, Bony, Meehl, Senior, Stevens, Stouffer and Taylor2016; O’Neill et al., Reference O’Neill, Tebaldi, van Vuuren, Eyring, Friedlingstein, Hurtt and Knutti2016). Characterized by high greenhouse gas emissions, the SSP 8.5 scenario and the RCP 8.5 scenario represent continuously increasing radiative forcing pathways without policy interventions, for which we selected the output databases from the eight climate models for the climate projections. The projections of the wind field and geopotential height field in the 2020s (2015–2025), 2050s (2045–2055) and 2090s (2085–2095) under the SSP 8.5 scenario were performed based on the median values of the eight CMIP6 model outputs.
The variables used in PMIP4-CMIP6 and PMIP3-CMIP5 mainly included precipitation (pr), temperature (evspsbl), evaporation (tas), total runoff (mrro), surface downwelling longwave radiation (rlds), surface upwelling longwave radiation (rlus), surface downwelling shortwave radiation (rsds), surface upwelling shortwave radiation (rsus), air temperature (ta), surface temperature (ts), eastward wind (ua), northward wind (va), and geopotential height (zg). For ease of comparison, all data were interpolated to a standard grid of 0.5°×0.5°. After interpolation, data from different models needed to be integrated into a multimodel ensemble result. Extreme values of climate models can lead to distortion of mean values, and more studies are favoring the use of median values (Lambert and Boer, Reference Lambert and Boer2001; Wehrli et al., Reference Wehrli, Guillod, Hauser, Leclair and Seneviratne2018). Therefore, we extracted median values from output datasets of PMIP4-CMIP6 and PMIP3-CMIP5 used to acquire the scientific multimodel ensemble values that are presented in Tables 1–5.
Details of models used to represent the last glacial maximum in Paleoclimate Model Intercomparison Project Phase 4 (PMIP4). Abbreviations: temperature (evspsbl), precipitation (pr), total runoff (mrro), surface downwelling longwave radiation (rlds), surface upwelling longwave radiation (rlus), surface downwelling shortwave radiation (rsds), surface upwelling shortwave radiation (rsus), air temperature (ta), surface temperature (ts), eastward wind (ua), northward wind (va), and geopotential height (zg).

Details of models used of pre-industry (PI) in Paleoclimate Model Intercomparison Project Phase 4 (PMIP4). Abbreviations: temperature (evspsbl), precipitation (pr), total runoff (mrro), surface downwelling longwave radiation (rlds), surface upwelling longwave radiation (rlus), surface downwelling shortwave radiation (rsds), surface upwelling shortwave radiation (rsus), air temperature (ta), surface temperature (ts), eastward wind (ua), northward wind (va), and geopotential height (zg).

Paleoclimate Model Intercomparison Project Phase 3 (PMIP3) models used in this study. Abbreviations: temperature (evspsbl), precipitation (pr), total runoff (mrro), surface downwelling longwave radiation (rlds), surface upwelling longwave radiation (rlus), surface downwelling shortwave radiation (rsds), surface upwelling shortwave radiation (rsus), air temperature (ta), surface temperature (ts), eastward wind (ua), northward wind (va), and geopotential height (zg).

Coupled Model Intercomparison Project Phase 6 (CMIP6) models used in this study. Variable abbreviations: evaporation (tas), eastward wind (ua), northward wind (va), and geopotential height (zg).

Coupled Model Intercomparison Project Phase 5 (CMIP5) models used in this study. Abbreviations: eastward wind (ua), northward wind (va), and geopotential height (zg).

Simulation of virtual lake and P−E
A virtual lake assumption is widely used in paleoclimate simulations, in which each grid cell is a 1-m-deep freshwater lake (Li and Morrill, Reference Li and Morrill2010, Reference Li and Morrill2013; Lowry and Morrill, Reference Lowry and Morrill2019). The one-dimensional lake energy-balance model designed by Hostetler and Bartlein (Reference Hostetler and Bartlein1990) is then applied to calculate lake evaporation. More details about the calculation formula of the lake model can be found in the Supplementary Text and in Li and Morrill (Reference Li and Morrill2010, Reference Li and Morrill2013). Input variables, including precipitation, runoff, air temperature, surface temperature, wind speed, longwave radiation, and shortwave radiation, are from PMIP4 multimodel ensembles. In this study, we set the running time-step of the lake models as 1 day. P−E is commonly used to measure dry/wet status. We combined lake simulations and P−E simulations to comprehensively evaluate the regional dry/wet status. The datasets of precipitation and evaporation were also obtained from the PMIP4 multimodel output.
Paleoclimate records
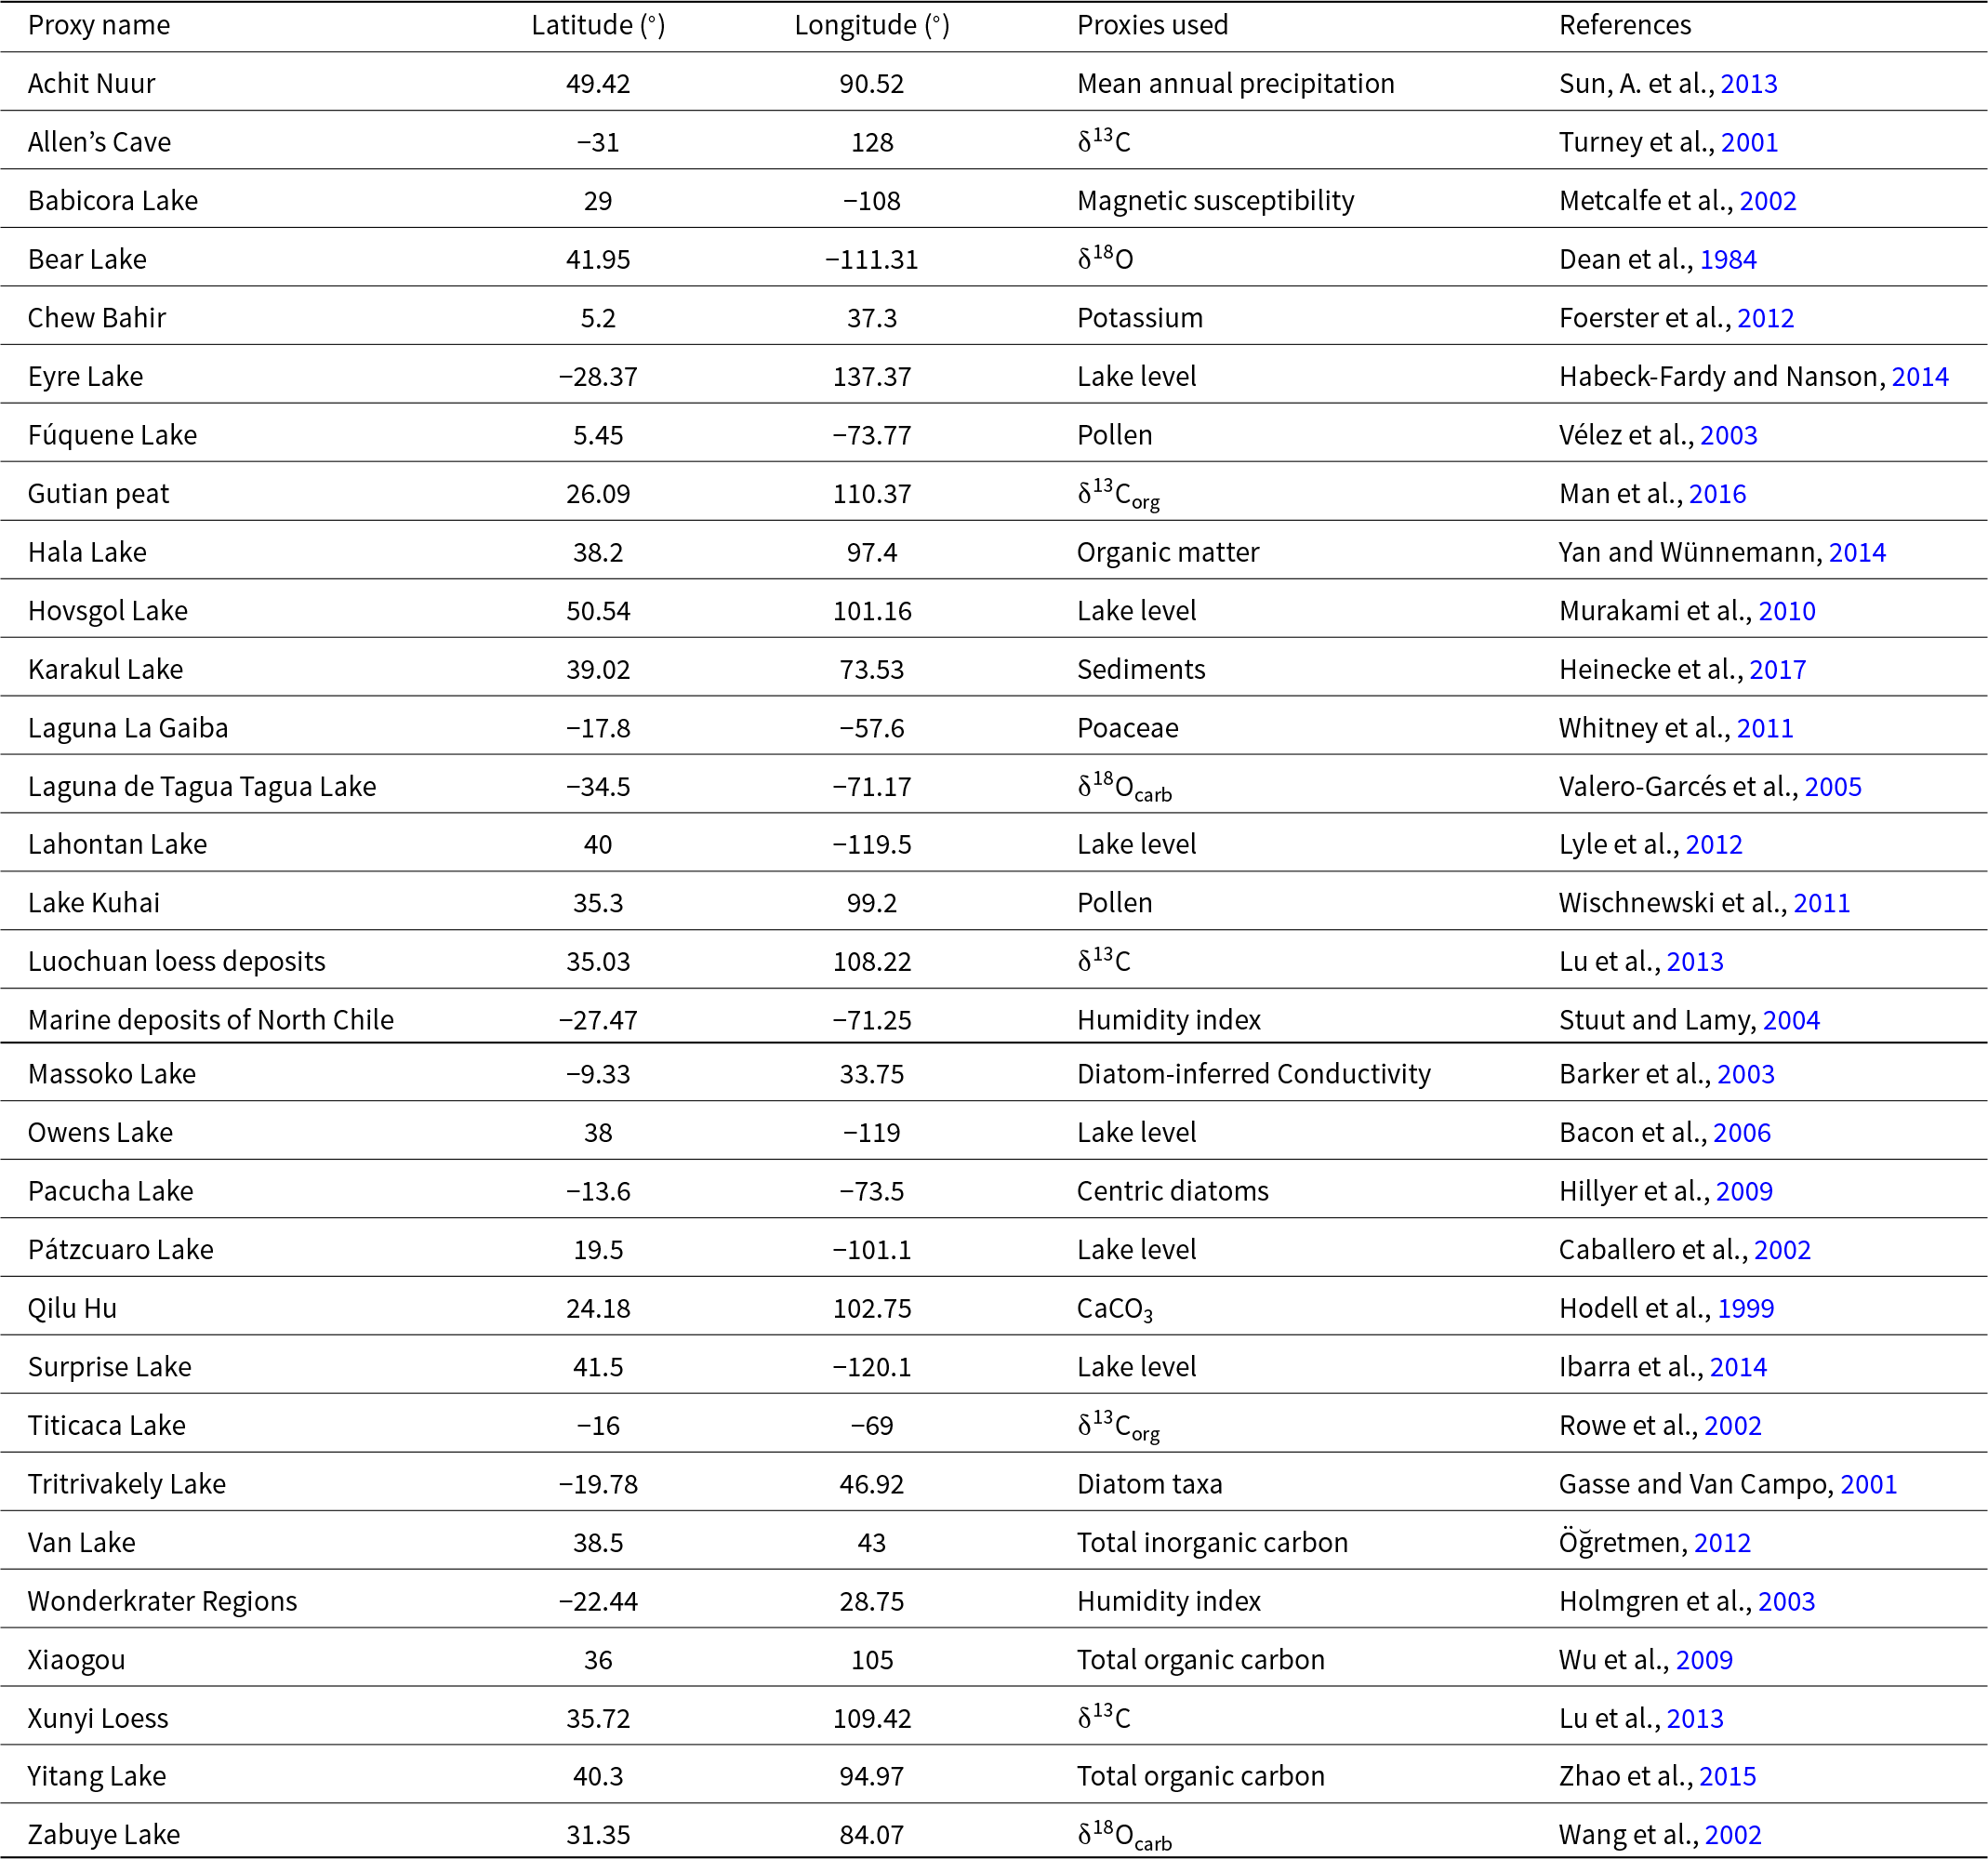
We collected a set of high-quality paleoclimate records that indicated dry/wet status to verify the climate model simulations (Table 6). Records were used as long as they meet the following criteria: (1) the records should be from global arid regions, (2) the validity of records was confirmed by the original investigators to reflect the dry/wet status, (3) the records should have at least five chronological markers to ensure the reliability of chronologies, and (4) the dominant driving mechanisms of the records should be climate change rather than human activities. We designed the periods of LGM and PI as 22–18 cal ka BP and 1cal ka BP to 1950 CE. On the basis of effective moisture in the original literature, we assess the dry/wet status in the LGM and PI by comparing the average hydroclimate status in typical cold and warm periods with that in corresponding stable periods of climate change.
Climate proxy records used in this study.

Results
Global temperature and dry/wet status since the LGM
The temperature difference between the LGM and PI indicates that global temperatures have risen gradually since the last deglaciation and that the cooling of middle and high latitudes was more significant during the LGM (Fig. 1a). Linear changes in temperature seen in Figure 1b show significant spatial differences with a warming trend in the mid-high latitudes over the past forty years (1960–2020). In particular, the temperatures in most global arid regions are rising, such as in central Asia, western North America, western Asia, and eastern North Africa (Fig. 1b). The multimodel ensemble results from the CMIP6 SSP 8.5 scenario show that global warming will be obvious in the next century, accompanied by an amplification effect in the mid-high latitudes (Fig. 1c,d).
Global temperature has continued to rise since the last glacial maximum (LGM): (a) temperature differences of LGM−preindustry (PI), (b) Linear temperature trends from 1960 to 2020, (c) temperature differences derived from 2050s model temperatures minus 2020s model temperatures and (d) temperature differences derived from 2090s model temperatures minus 2050s model temperatures from the shared socioeconomic pathway (SSP) 8.5 scenario of the Coupled Model Intercomparison Project Phase 6 (CMIP6) multimodel ensembles.

The P−E simulation from the multimodel ensembles of the PMIP4 and PMIP3 during the LGM and PI can provide valuable information for the changes in dry/wet status in global arid regions (Fig. 2; Supplemental Figure 1). The P−E difference between the LGM and PI shows that the high latitudes are drier during the LGM, while most of the mid-latitude arid regions, such as central and western Asia, northern and southern Africa, western North America, western South America, and Australia, are relatively wetter (Fig. 2a; Supplemental Figure 1a). There is a good match between paleoclimate records and P−E simulation results, all of which verify the dry/wet status anomaly between the LGM and PI (Fig. 2a; Supplemental Figure 1a). The results of the virtual lake simulations (Fig. 2b; Supplemental Figure 1b) indicate that relative to the PI, the wet climates of North America, central South America, northwestern and southern Africa, and some regions of central Asia, mainly exist in the LGM, which is mostly similar to the P−E simulation results. Generally, P−E is lower in summer than in winter in most of the global arid regions (Fig. 2c,d; Supplemental Figure 1c, d). Therefore, winter P−E makes a major contribution to the dry/wet changes throughout the year (Fig. 2c; Supplemental Figure 1c), so the annual P−E is still at a high level during the LGM (Fig. 2a; Supplemental Figure 1a).
Difference in dry/wet status between the last glacial maximum (LGM) and preindustry (PI) based on the Paleoclimate Model Intercomparison Project Phase 4 (PMIP4) dataset: (a) differences in precipitation minus evaporation (P−E) simulations, (b) differences in virtual lake simulations, (c) differences in P−E simulations in June, July, and August (JJA), and (d) differences in P−E simulations in December, January, and February (DJF). Blue (wet) and red (dry) points in a, c, and d represent the wet and dry climate of the LGM minus PI indicated by paleoclimate records in global arid regions; see Table 6 for more details of paleoclimate records.

Global atmospheric circulation since the LGM
The PMIP4 multimodel ensembles simulate both the mean state and the difference in the 500 hPa (hectopascal) geopotential height fields during the LGM and PI periods (Fig. 3). The summer and winter geopotential heights are significantly different at high latitudes, showing that the pressure gradient between the pole and the equator in the cold period (LGM) is significantly higher than that in the modern warm period (PI). The positions of the subtropical high in winter and summer are both to the north during the modern warm period (Fig. 3c,d). The PMIP3 multimodel ensembles simulate the same results (Supplemental Figure 2). Furthermore, we analyzed the detailed characteristics of typical arid regions represented by North America, northern Africa, the Mediterranean, and central east Asia through the geopotential height profiles at 100°W, 15°E, 80°E, and 120°E (Fig. 4), and the subtropical high response in cold and warm periods also varies nonmonotonically at different longitudes (Fig. 4). As shown in Figure 4, negative anomalies of geopotential height (blue shading) are found between 45°N and 60°N in the mid-latitude zones (contours). Because of the thermal wind balance, the shift in the meridional temperature gradient can thermodynamically drive an equatorward shift of the subtropical high, which also shows the strongest anomalies at approximately the same location (∼30°E). The model simulations characterized by a more sharply peaked mid-latitude geopotential height profile demonstrate an overall weakening of subtropical high during the LGM (cold period) (Fig. 4).
Global geopotential height of the last glacial maximum (LGM) and pre-industry (PI) based on the Paleoclimate Model Intercomparison Project Phase 4 (PMIP4) dataset: geopotential height (500 hPa) in (a) December, January, February (DJF) and (b) June, July, August (JJA) during the LGM; geopotential height (500 hPa) in (c) DJF and (d) JJA during the PI.

Differences in the annual geopotential height profile between the last glacial maximum (LGM) and pre-industry (PI) at (a) 100°W, (b) 15°E, (c) 80°E, and (d) 120°E based on the Paleoclimate Model Intercomparison Project Phase 4 (PMIP4) dataset. The white area indicates the mountains with no data or missing values.

Under the standard climatological normal of winter (December, January, February) and summer (June, July, August) conditions, the mid-latitude arid region is usually dominated by easterly winds in summer and westerly winds in winter (Fig. 5a–d). The 850 hPa winter wind field shows that westerlies prevail in global arid regions during the LGM period compared with the PI period and can carry more Atlantic water vapor to inland regions (Fig. 5e). Summer conditions are similar to the average state, with the easterly wind as the main wind direction (Fig. 5f). In addition, when we compared the simulation results of the PMIP3 multimodel ensembles, we found that there is no significant difference between the two datasets (Supplemental Figure 3).
Global wind fields (850 hPa) based on the Paleoclimate Model Intercomparison Project Phase 4 (PMIP4) dataset during the last glacial maximum (LGM) in (a) December, January, February (DJF) and (b) June, July, August (JJA); and in the pre-industry (PI) in (c) DJF and (d) JJA; differences in the 850 hPa wind field in (e) DJF and (f) JJA between the LGM and PI.

Discussion
Temperature gradient is the fundamental driving factor of atmospheric circulation and is likely to be a dominant forcing dynamic of the dry/wet status at multiple timescales (Routson et al., Reference Routson, McKay, Kaufman, Erb, Goosse, Shuman, Rodysill and Ault2019; Yang et al., Reference Yang, Lohmann, Shi and Müller2023). Previous research has demonstrated that the strength of the meridional temperature gradient influences the position, width, strength, and meridionality of mid-latitude westerlies and storm tracks (Davis and Brewer, Reference Davis and Brewer2009; Shaw et al., Reference Shaw, Baldwin, Barnes, Caballero, Garfinkel, Hwang and Li2016; Semmler et al., Reference Semmler, Stulic, Jung, Tilinina, Campos, Gulev and Koracin2016). Migration of the mid-latitude meridional temperature gradient forced by uniform SST warming has been proposed as a hypothesis for altering the width and strength of the tropical low and tropical belt (Frierson et al., Reference Frierson, Lu and Chen2007; Sun, L. et al., Reference Sun, Chen and Lu2013; Staten et al., Reference Staten, Reichler and Lu2014; Wu and Smith, Reference Wu and Smith2016; Son et al., Reference Son, Kim and Min2018; Watt-Meyer et al., Reference Watt-Meyer and Frierson2019; Zhou et al., Reference Zhou, Xie and Yang2019; Rodriguez et al., Reference Rodriguez Solis, Turrent and Gross2022; Yang et al., Reference Yang, Lohmann, Shi and Müller2023). Tropical expansion is associated with a systematic poleward shift of the mid-latitude circulation pattern characterized by prevailing westerlies (Watt-Meyer et al., Reference Watt-Meyer and Frierson2019; Yang et al., Reference Yang, Lohmann, Shi and Müller2023). Following this atmospheric circulation theory, tropical expansion can lead to the poleward shift of the subtropical high (Son et al., Reference Son, Kim and Min2018) and then affect the dry/wet status in the mid-latitude arid regions that are modulated by the subtropical high. Other insights supported by the observations, paleoclimate records, and model simulations are that decreasing the equator-to-pole temperature gradient in the Mid-Holocene produced considerable reductions in annual net precipitation and water resources at mid-latitudes (Routson et al., Reference Routson, McKay, Kaufman, Erb, Goosse, Shuman, Rodysill and Ault2019). The amplification of Arctic warming is the main driving factor for the weakening of the meridional temperature gradient and mid-latitude westerlies through the thermal wind relationship (Jackson and Broccoli, Reference Jackson and Broccoli2003; Son and Lee, Reference Son and Lee2005; Francis and Vavrus, Reference Francis and Vavrus2015).
The cooling at mid-high latitudes during the LGM provides a reverse analog for the modern and near-future climate with polar-amplified warming (Fig. 1). We analyzed the atmospheric circulation and dry/wet status during the LGM and PI. Model simulations of P−E and virtual lakes indicate a relatively wetter status and high lake level in mid-latitude arid regions during the LGM (Fig. 2). By visualizing atmospheric circulation patterns during the LGM and PI, we found equatorward migration of the subtropical high and a converse abnormity of the wind field (Figs. 3–5). The higher geopotential height on the Tibetan Plateau during the LGM may have exacerbated drought in arid central Asia through dynamic and thermal effects (Fig. 3e), which led to potential differences within arid Central Asia and other regions that were controlled by the Northern Hemisphere subtropical high (Yan et al., Reference Yan, Zhang, Yan, Wang, Ren and Zhao2019; Sun and Liu, Reference Sun and Liu2021). Therefore, based on our results and those of previous studies, we think that the distribution and shifting of the subtropical high is the vital driver for the mid-latitude circulation pattern that affects the dry/wet status in global arid regions. Nonuniform warming in the upper troposphere leads to nonuniform surface heating via latent heat and can eventually push the tropospheric meridional temperature gradient (primarily 700 to 200 hPa) toward higher latitudes. The southward shift of the subtropical high means that the mid-latitude regions affected by the shrinking of the downdraft area may experience increased precipitation during the LGM. As an atmospheric circulation pattern extending from the upper troposphere to the surface, the subtropical high dynamically affects the westerlies as well. Enhanced westerlies during the LGM reported in previous studies also correspond to the southward shift of the subtropical high during this period, which made the arid and semiarid regions affected by the mid-latitude westerlies more humid (Yu et al., Reference Yu, Xue, Wang and Liu2000; Ju et al., Reference Ju, Wang and Jiang2007; Li et al., Reference Li, Peng, Liu, Zhang, Ye, Han, Zhang, Xu and Li2020). Therefore, contrary to the LGM climate and from a qualitative point of view, we argue that arid regions will expand and become more arid in the future.
To further verify the reverse of the LGM climate for future climate change, simulation work based on future models is necessary. Based on the CMIP6 and CMIP5, simulated changes in the wind field and geopotential height field in the future modeling illustrate that the subtropical high will move northward and that the scope of influence of the subtropical high is significantly expanded (Fig. 6; Supplemental Figure 4). At the same time, easterly winds will also be dominant in global arid regions, resulting in a reduction in water vapor. There is a consensus among researchers that the Hadley cell is widening from what it was during the LGM to the future under projected climate conditions, and that the edge of the Hadley cell will migrate poleward in response to increasing greenhouse gases (Son et al., Reference Son, Kim and Min2018; Grise and Davis, Reference Grise and Davis2020). Reanalysis and observation datasets show that Hadley cell circulation has expanded by 2° to 4.5° of latitude since 1979, implying the expansion of the subtropical high, leading to mid-latitude tropospheric warming (Hu and Fu, Reference Hu and Fu2007; Hu et al., Reference Hu, Tao and Liu2013). Moreover, changes in subtropical arid regions caused by the expansion of Hadley cell circulation may be one of the reasons why southern Australia, the southern United States, and northern Africa are getting drier (Nguyen et al., Reference Nguyen, Lucas, Evans, Timbal and Hanson2015). Recently, Routson et al. (Reference Routson, McKay, Kaufman, Erb, Goosse, Shuman, Rodysill and Ault2019) showed that global warming driven by CO2 emissions from human activities has caused the temperature gradient difference between high and low latitudes to decrease, resulting in a significant reduction in precipitation at mid-latitudes. This precipitation decrease has already been simulated in early model simulations (Allen et al., Reference Allen, Sherwood, Norris and Zender2012; Salzmann, Reference Salzmann2016). Li et al. (Reference Li, Sun, Liang, Xing and Li2023) noted that the Arctic amplification effect has been significantly enhanced in recent decades. Reductions in precipitation combined with high temperatures are major contributors to dryland expansion in China and imply drought stress in the future that may exacerbate the risk of land degradation (Huang and Zhai, Reference Huang and Zhai2023). Therefore, polar-amplified warming would weaken the equator-to-pole temperature gradient, thus leading to the poleward migration and widening of the subtropical high, which in turn would increase the aridity in mid-latitude arid regions.
The future wind field and geopotential height field from the Coupled Model Intercomparison Project Phase 6 (CMIP6) shared socioeconomic pathway (SSP 8.5) scenario. Differences in the wind field (850 hPa) and geopotential height field (500 hPa) derived from 2050s model results minus 2020s model results in (a) December, January, February (DJF) and (b) June, July, August (JJA). Differences in the wind field (850 hPa) and geopotential height field (500 hPa) derived from 2090s model results minus 2050s model results in (c) DJF and (d) JJA.

The use of the LGM as a reverse analog for future warming offers a unique perspective and valuable insights into the evolution of global arid regions under climate change. However, there are notable limitations to this approach. The dry/wet changes in the LGM were primarily driven by natural factors (e.g., orbital variations, natural fluctuations in greenhouse gas concentrations), whereas future dry/wet change is predominantly driven by human factors (e.g., fossil-fuel emissions, land-use changes; Cao et al., Reference Cao, Wang and Liu2019; Cooper et al., Reference Cooper, Armour, Hakim, Tierney, Osman, Proistosescu and Dong2024). During the LGM, the presence of extensive ice sheets played a critical role in modulating the climate system. In contrast, future climate change will be primarily driven by anthropogenic greenhouse-gas emissions, and the retreat of ice sheets likely affects climate feedback mechanisms in ways that differ from the LGM. Future climate forcing mechanisms are not only more direct but also evolving at a much faster pace than natural climate processes. The dry/wet changes in the LGM unfolded over millennia, whereas future climate change will occur on much shorter timescales (Zhang et al., Reference Zhang, Li, Ye, Peng, Zhang, Liu, Li, Han and Xu2020). This difference in the rate of change can lead to distinct feedback mechanisms within the climate system, particularly in terms of ice-sheet dynamics, ocean circulation, and ecosystem responses. Therefore, while the LGM provides a valuable analog, it is essential to consider these key differences and limitations when projecting future dry/wet climate change and the expansion of global arid regions.
Conclusion
We analyzed the evolution of global arid regions and their driving mechanisms using climate-model simulations from the PMIP4-CMIP6 and PMIP3-CMIP5. We identified the past status of the climate system during the LGM that offers the closest non-analog to the future climate scenario. The climate model simulations and paleoclimate records presented here show that poleward migration of the subtropical high coincides with substantial aridification in mid-latitude arid regions under global warming. Increases in the aridity of existing arid regions and their spatial extent may have profound adverse human and socioeconomic effects. The uncertainties in the projected future climate in global arid regions are far from being thoroughly explored in this study. Therefore, more model work and reliable paleoclimate records are needed to explore the dynamic processes in detail and fully resolve regional variability. Nevertheless, understanding the relationship between the subtropical high and regional climate change can shed new light on the effects of atmospheric dynamics on both past and future climate changes.
Supplementary material
The supplementary material for this article can be found at https://doi.org/10.1017/qua.2024.60.
Acknowledgments
This research was funded by the National Natural Science Foundation of China (Grant No. 42371159, 42077415); the Second Tibetan Plateau Scientific Expedition and Research Program (STEP) (Grant No. 2019QZKK0202); and the 111 Project (BP0618001).
Data Availability Statement
PMIP4-CMIP6 and PMIP3-CMIP5 models used can be found in the Supporting information (https://doi.org/10.5281/zenodo.14989355) and are also available from the Earth System Grid Federation (ESGF) Peer-to-Peer (P2P) enterprise system website at https://esgf-node.llnl.gov/projects/esgf-llnl/. Global Lake Status Data Base (GLSDB) website is at https://pmip2.lsce.ipsl.fr/synth/lakestatus.shtml.
Competing interests
The authors declare no competing interests.
Author contributions
Y.L. and S.M.P. conceived the paper. S.M.P. finished the original draft preparation, editing and review of this manuscript. S.M.P., Z.S.Z. and J.J.D. conducted advanced statistical and geospatial data analysis and visualizations of the work.