

Introduction
“The world needs more women leaders. If there are more female legislators, more and different issues of interest will be discussed to respond to the diverse needs of society. Women leaders have proven to be strong advocates for many topics, such as girls’ education, decent jobs, health, and pensions for the elderly” (UN Women Reference Women2012). Those words spoken by Chilean former president Michelle Bachelet in her capacity as Executive Director of UN Women are illustrative of an idea embraced by politicians and activists who believe that women in politics make a difference in promoting more fiercely the interests and demands of disadvantaged groups of society. As the National Democratic Institute claimed: “More women see government as a tool to help serve underrepresented or minority groups” (NDI 2012).
Beyond normative positions or the views of political leaders and activists, the above poses an interesting puzzle: Who represents disadvantaged groups in democratic political systems?Footnote 1 In the academic literature, the answer is not clear. Some may argue that groups, movements, or political parties may channel the representation of marginalized communities. Nonetheless, interest groups often fail to represent their most disadvantaged constituencies (i.e., Strolovitch Reference Strolovitch2006, 895) and, under some circumstances, political parties may foster competence between marginalized groups rather than inclusion (Celis and Erzeel Reference Celis and Erzeel2013). It can also be stated that the demands and preferences of disadvantaged groups are not monolithic. In that regard, Htun (Reference Htun2004) pointed out that the logic behind the demands for inclusion of women’s movements and indigenous groups may be completely different, as are the mechanisms designed to address them (i.e., quotas and reservations). Delving into that puzzle, and following arguments like the one expressed by Bachelet, we derive from the academic literature on representation to test the hypothesis that women legislators are more active in representing disadvantaged groups in comparison with male counterparts. Even though the role of women as representatives (legislators) has been studied by scholars with different lenses, the specific issue of whether women are also more active in promoting the interests of other disadvantaged groups (i.e., other than women) has received much less attention. The lack of empirical evidence on the matter is particularly notorious in Latin American settings and in Chile, our case study. In parallel, we also expect to observe that the propensity to represent disadvantaged groups is conditional to legislators’ ideological positions.
The rationale of our argument is as follows. Women are said to be institutionally marginalized in Latin American legislatures compared to men (Barnes Reference Barnes2016; Heath et al. Reference Heath, Schwindt-Bayer and Taylor-Robinson2005; Htun, et al. Reference Htun, Lacalle and Pablo Micozzi2013). This marginalization creates a set of incentives leading female representatives to build reputations as advocates of disadvantaged groups. In addition to gender, the literature has identified a relationship between ideological factors and the representation of disadvantaged groups (i.e., González Juenke and Preuhs Reference González Juenke and Preuhs2012; Preuhs and Hero Reference Preuhs and Hero2011). We refer to those works to test the hypothesis that left-wing legislators are more likely to be more active in representing marginalized groups.
The identification strategy encompasses non-legislative speeches and personal meetings in the Chamber of Deputies of Chile. Two legislative periods are covered in our data (2014–18 and 2018–22). Hence, we include the period before and after the implementation of the quota (for candidacies) law in 2017.Footnote 2 In the second period under analysis (2018–22) we observe an increase in the number of women in the Chilean Chamber of Deputies. Our inferential analysis shows, first, that women deputies indeed receive more disadvantaged groups in face-to-face meetings, and they also deliver more speeches about some of these groups, even though in the latter case the frequency of such speeches is low. Second, evidence shows that left-wing legislators embrace the causes of marginalized groups more often.
This research contributes to the literature of disadvantaged groups representation (i.e., Barnes and Holman Reference Barnes and Holman2019; Bailer et al. Reference Bailer, Breunig, Giger and Wüst2022; Dwidar Reference Dwidar2022; Elsässer, and Schäfer Reference Elsässer and Schäfer2022; Htun Reference Htun2016; Marchetti Reference Marchetti2014; Reference Marchetti, Hankivsky and Jordan-Zachery2019) and gendered legislative behavior in Latin America (i.e., Barnes Reference Barnes2016; Taylor-Robinson Reference Taylor-Robinson, Martin, Saalfeld and Strom2014; Schwindt-Bayer, Reference Schwindt-Bayer2006). Our strategy enables us to go beyond the classic approach, where substantive representation is observed by establishing a correspondence between the ascriptive characteristics of representatives and their actions. We show that representatives from specific disadvantaged groups (i.e., women) may represent more actively the interests of different marginalized communities to which they do not belong from a descriptive criterion (i.e., LGTB, the poor, immigrants).
This work is structured as follows: first, the literature on the representation of disadvantaged groups from which we structure our hypothesis is analyzed. Second, the data and the strategy used to code and interpret the information are described. Third, we present and discuss the main results. Last, we present our conclusions regarding the implications of our work.
Representing Disadvantaged Groups
Political representation, as famously conceived by Hanna Pitkin (Reference Pitkin1967), is to simply “make present again.” Then, representation refers to the dynamics through which citizens’ preferences and/or priorities are incorporated into the political debate and decision-making process. Put differently: “political representation occurs when political actors speak, advocate, symbolize, and act on behalf of others in the political arena. In short, political representation is a kind of political assistance” (Dovi 2006, i). According to Pitkin (Reference Pitkin1967), representation takes different forms. Among them, two are of specific interests in our research: i) descriptive: when a person joins an assembly representing a group based on shared characteristics, such as sex or race; and ii) substantive: when the representative acts “in the interest of the represented, in a manner that is receptive (responsive) to them.” That is, when they carry out and promote the interests of the groups they represent (Pitkin Reference Pitkin1967, 209; see also Childs and Lovenduski Reference Childs, Lovenduski and Waylen2013, 490). As it stands, descriptive representation focuses on how representative institutions, parliament or congress: “[…] mirror the broad spectrum of ascriptive characteristics of the population” (Bailer et al. Reference Bailer, Breunig, Giger and Wüst2022, 536). It follows from the above, that an assembly would be more representative of society when different groups are sufficiently present according to criteria such as class, race, sex, age, and the like. Meanwhile, substantive representation focuses more on how those politicians, here legislators, promote the demands and interests of specific groups when performing their parliamentary roles. This is not equivalent to saying that substantive representation is only about outcomes of the policy process. As Mansbridge (Reference Mansbridge1999, 629–30) identified, substantive representation relates to the deliberative aspect of the dynamic of democratic representation and not only, or necessarily, to the aggregative function.
In this context, the interplay between descriptive and substantive representation of disadvantaged groups has been a subject of debate in the literature. For example, works focused on the Latin American context show that mechanisms fostering descriptive representation, such as quotas, which may increase the presence of marginalized groups, do not necessarily translate into effective or substantive representation (Htun Reference Htun2016).
The general debate about the representation of disadvantaged groups has been a topic of interest for scholars from diverse traditions (i.e., Bailer et al. Reference Bailer, Breunig, Giger and Wüst2022; Carnes and Lupu Reference Carnes and Lupu2015; Crenshaw Reference Crenshaw1989; Dwidar Reference Dwidar2022; Mansbridge Reference Mansbridge1999; Weldon Reference Weldon2012; Williams Reference Williams1998). Now, the specific item of which agents are more likely to assume the representation of these groups in the political system has attracted less attention, and the available evidence is mixed. For example, some works have considered the role of social movements in channeling the demands of those excluded and disadvantaged groups, such as workers (Elsässer and Schäfer Reference Elsässer and Schäfer2022). Nonetheless, empirical studies have provided evidence that interest groups, which may include cause groups or movements, fail to represent their most disadvantaged constituents, such as racial, gender, or social class minorities (Strolovitch Reference Strolovitch2006, 895). Other factors add further complexity about who represents disadvantaged groups more actively. For example, parties may also orchestrate the representation of minorities such as ethnic groups and women, fostering competence between marginalized groups rather than inclusion, as evidenced by the Dutch case and Belgium (Celis and Erzeel Reference Celis and Erzeel2013). By the same token, Htun (Reference Htun2004) noted that the logic behind the demands for inclusion of women’s movements and indigenous groups may be completely different, as are the mechanisms designed to address them (i.e., quotas and reservations).
Notoriously, it has been the feminist literature stream that has examined the topic of disadvantaged groups’ representation more extensively. This, as noted earlier, focuses mostly on the representation of women’s interests. This literature on substantive representation of women provides strong evidence that women parliamentarians are the main agents promoting women’s interests in the public debates (Dodson Reference Dodson2006; Lloren Reference Lloren2015). For example, they introduce more bills promoting women’s interests, as evidence from Latin America shows (i.e., Htun et al. Reference Htun, Lacalle and Pablo Micozzi2013; Schwindt-Bayer Reference Schwindt-Bayer2006; Taylor-Robinson and Heath Reference Taylor-Robinson and Michelle Heath2003). At this point, it is important to note that the scope of the findings is biased towards examining how women represent the interests of women as a group more actively. Indeed, as Erzeel and Rashkova (Reference Erzeel and Rashkova2023, 440) pointed out, almost 60 percent of the research available about substantive representation refers to women parliamentarians representing women as a group exclusively. This may constrain our understanding of the general patterns of representation for disadvantaged groups. Furthermore, substantive representation studies focus mostly on how the representatives of disadvantaged groups represent the interests of their own groups. The somehow tacit assumption is that to observe substantive representation, there should be a correspondence between ascriptive characteristics of representatives and actions. Taking a different approach, in this research we conceive that representatives or legislators from specific disadvantaged groups (i.e., women) may represent more actively the interests of different marginalized communities to which they do not belong from a descriptive criterion (i.e., LGBT, the poor, immigrants).
Two main arguments stand out. First, a role and identity-based model maintains that women legislators perform their duties as representatives with a perspective of social sensibility of specific vulnerable groups’ “wellbeing” (Norris Reference Norris1996, 1; Piscopo Reference Piscopo2014). At such, women may endorse a genderized “style of politics” encompassing language and behavior (Childs Reference Childs2000). This approach has been criticized, though. It has been argued that women representatives should not be viewed merely as goodwill representatives of women. As Reyes-Housholder (Reference Reyes-Housholder2019, 431) argues, the approach mentioned earlier rests on the assumption that socially constructed gender identities may explain behavioral disparities, potentially leading to substantive representation. However, she noted, female representatives may have more than one identity. Similarly, O’Brien and Piscopo (Reference O’Brien, Piscopo, Franceschet, Lena Krook and Tan2019, 55) point out that it is not correct to assume that all women share a single vision of their gender identity. Second, there is a more persuasive argument based on the premise that women parliamentarians are more collaborative in their behavior. At this point, we follow Tiffany Barnes (Reference Barnes2016, iii), who argues that women parliamentarians are: “[…] like all legislators, strategic politicians and they collaborate to be more effective representatives.” This line of reasoning assumes that women’s representatives’ choice of what type of representation to embrace, particularly a more collaborative one, is endogenously derived from the “structural barriers” that limit their capacity to influence the policy process (Barnes Reference Barnes2016, 2–5). Indeed, women are marginalized in Latin American legislatures (i.e., Barnes Reference Barnes2016; Heath et al. Reference Heath, Schwindt-Bayer and Taylor-Robinson2005; Kerevel & Rae Atkeson, Reference Kerevel and Rae Atkeson2013; Schwindt-Bayer Reference Schwindt-Bayer2010).Footnote 3 All this may induce women in parliament to develop more collaborative behavior. Collaboration would foster inclusion, because “through collaboration, excluded groups can enhance their strength and influence […]” (Barnes Reference Barnes2016, 5). In the case of Bolivia, for example, female legislators have surpassed the differences between groups such as indigenous women, those with particular backgrounds, urban feminists, and white women, in order to cooperate around common goals (Htun & Pablo Ossa, Reference Htun and Pablo Ossa2013). Henceforth, among other possibilities of causal mechanisms representing disadvantaged groups, a choice of female legislators looking for mechanisms to foster their careers from a starting point of institutional marginalization may be a possibility. Now, beyond the underlying causal mechanism, either for strategic reasons or role-identity, the empirical expectation converges.
Existing empirical work approximates the core element of our research problem, primarily using data from the United States case. For instance, when studying female legislators’ legislative success in the US Congress, Volden et al. (Reference Volden, Wiseman and Wittmer2018) show that women focus more on topics such as workers, migrants, social services, and community development, some of which may be considered as disadvantaged groups, following the operationalization adopted here. Also studying legislative effectiveness, Bratton and Haynie (Reference Bratton and Haynie1999, 659) discuss how women legislators in state assemblies introduce more legislation about vulnerable communities such as the poor, black people, and children. Studies focused on the differential impact of women in public offices also report that female State legislators not only introduce more bills on women’s rights but also initiatives related to education, health care, welfare and families (Carroll Reference Carroll1994). It is intuitive to find vulnerable populations in those issues or policy areas. Even in works that focus on women’s issues, gender and reproductive rights, and so on, women are more likely than men to promote greater government action in protecting marginalized groups, and wellbeing (Reingold Reference Reingold2006, 19). Building upon the literature mentioned earlier, we derive a first expectation regarding the representation of disadvantaged groups by women legislators:
Hypothesis 1: Women legislators are more active in representing the disadvantaged groups of society.
Research on substantive representation suggests that there may be other factors that, in parallel to gender, may explain legislators’ decisions on which groups to represent more actively. Among those factors, ideology and party identification stand out. Indeed, previous studies have shown that representatives belonging to left-wing parties are more likely to advocate for groups who are said to have suffered historical marginalization, such as women and the feminist movement (i.e., Bektas and Issever-Ekinci Reference Bektas and Issever-Ekinci2019; Erzeel and Celis Reference Erzeel and Celis2016). But the available findings are not restricted to the relationship between ideology or party identity and the promotion of women’s interests exclusively. The literature has examined the role of party identity in representing communities considered vulnerable or historically marginalized more broadly (i.e., González Juenke and Preuhs Reference González Juenke and Preuhs2012; Preuhs and Hero Reference Preuhs and Hero2011; McAndrews et al. Reference McAndrews, Goldberg, John Loewen, Rubenson and Allen Stevens2021). The logic is straightforward. Take the representation of the poor, a prominent disadvantaged group, as an illustration. As Maks-Solomon and Rigby (Reference Maks-Solomon and Rigby2020) noted, it is well known that scholars assume that Democrats in the United States support more actively the poor in comparison to Republicans. Comparatively, the same can be said about the link that exists between social movements embracing cultural, environmental, and other potentially disadvantaged demands or interests to leftists’ parties (Kitschelt Reference Kitschelt1988, 194–95). Recent evidence supports the claim. For instance, Acquarone and Di Landro (Reference Acquarone and Di Landro2025) show how, controlling for other partisan variables, legislators from “historically marginal groups” are more likely to be leftists. Similarly, González Juenke and Preuhs (Reference González Juenke and Preuhs2012) provide evidence where the presence of black and Latino constituencies in the district anticipates observing more ideologically liberal representatives. Thus, in addition to the predominance of gender, which is the main theoretical expectation of our model, we also propose that the prominence given to marginalized groups is conditioned by ideology.
Hypothesis 2: left-wing legislators are more active in representing disadvantaged groups of society.
Case, Method, and Data
Chile is a suitable case for examining our arguments, and therefore, the evidence produced will contribute to the comparative analysis. On the one hand, the case selected is a consolidated democracy, which has shown high indices of democratic quality for several decades, like those of several Western democracies. Similarly, in terms of female representation policies, it has also followed in the footsteps of many Western democracies, such as the implementation of gender-equal cabinets (2006) or the quota law (2015). Both measures were implemented during the administration of Michelle Bachelet, who governed the country twice, being the first female president.
As noted earlier, in recent years, institutional reforms have been adopted that seek to increase the participation of women in the legislative arena in Chile. For example, for the first time, in 2017, the Quota Law was applied, which establishes that neither men nor women can represent more than 60 percent of the total number of candidates of each party in the parliamentary elections. While women’s representation in the Chamber of Deputies reached 22.6 percent in the 2017 election, they obtained 35.5 percent of the seats in the next election, held in 2021. Thus, Chile moved upward in the Inter-Parliamentary Union’s ranking of women‘s presence in legislatures worldwide (El Mostrador Reference Mostrador2022). However, there are assessments indicating that several shortcomings still affect the participation of women in Chilean politics. For example, in 2017, women candidates were given less money in donations, transfers from parties, and loans (Piscopo et al. Reference Piscopo, Hinojosa, Thomas and Siavelis2022). Thus, the problem of women’s inclusion is still considered a serious issue (Le Foulon and Suárez-Cao Reference Le Foulon and Suárez-Cao2019, 95).Footnote 4 Thereby, in the constitutional process opened in 2020, one of the most prominent debates was precisely about the fostering of gender rights both in the electoral mechanism to elect delegates and then the content of the draft. Indeed, the proposal, rejected by around 62 percent of Chilean voters, was labeled as the first “feminist constitution” (Deutsche Welle 2022).Footnote 5
Both speeches and meetings of parliamentarians from the 2014–18 and 2018–22 legislatures were coded. Each of the 7,606 speeches given in the “Incidents Hour” by parliamentarians in the 2014–18 and 2018–22 legislatures was manually coded, separately recording whether they referred to any of the interest groups included in this study:Footnote 6 women,Footnote 7 indigenous peoples, people living in poverty, young people, the LGBT community, the disabled or migrants. The same procedure was applied to the 9,303 meetings registered on the Infolobby portal. Examples of the coding procedure may help to make the interpretation of the data easier. For an intervention to be coded as representative of women, it must promote or defend their interests before the rest of society. Thus, for example, the intervention by deputy Carvajal (Party for Democracy) in October 2014, in which she advocated prioritizing the allocation of resources to women microentrepreneurs, was coded as such. Similarly, the intervention by deputy Cariola (Communist Party) in May 2018, in which she congratulated the Chilean feminist movement for its actions against sexism and patriarchy, falls into this category. In the case of indigenous groups, for example, the intervention by deputy Poblete (Socialist Party) in July 2017, in which he called for the regularization of land titles for members of various indigenous communities, was coded as such. In the same vein, the intervention of deputy Torrealba (National Renewal), June 2018, in which he requested an investigation into discriminatory actions against the migrant population, was coded as representative of immigrants.
With regard to the venues where the representation of disadvantaged groups occurs, our research design is consistent with the comparative literature focused on the legislative arena, besides other venues such as cabinets and bureaucracy. In this article, the identification strategy focuses on two mechanisms through which legislators may “act in the interest” of marginalized groups: non-legislative speeches and exchanges between parliamentarians and interest groups, where legislators enjoy a considerable leeway in comparison to, for instance, roll call votes and bill sponsorship. Regarding this, a caveat needs to be addressed: an almost exclusive focus on results, for instance, new laws or policies, would dismiss exchanges in meetings and speeches as forms of substantive representation. However, following Pitkin and the framing specified above, it is reasonable to argue that speeches and meetings are concrete and tangible forms of acting for disadvantaged groups, or forms of democratic deliberation that Jane Mansbridge considers a key element of substantive representation. In sum, by examining these two mechanisms or types of activities within the assembly, it is possible to derive non-biased estimates of legislators’ propensity to champion the substantive representation of different groups in society, particularly the most disadvantaged.
The unit of observation is legislators: a total of 275 deputies. The dependent variables are the number of speeches referring to disadvantaged groups, on the one hand, and the number of meetings associated with these groups, on the other. Given that the dependent variable is a count and is over-dispersed, the most appropriate estimation technique is a negative binomial regression. The correlation of errors is considered due to the repetition of the parliamentarians who were in both periods.
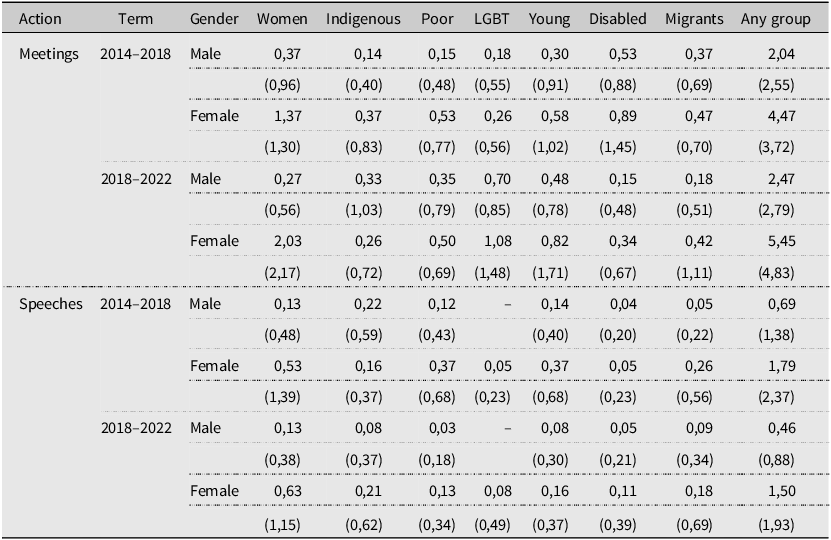
Table 1 shows the average number of meetings and speeches regarding each disadvantaged group observed per term, according to the legislator’s gender. The first independent variable is gender, introduced as a dummy variable which identifies each of the 54 women (20 percent of the total). The second independent variable corresponds to parliamentarians’ political position, which was extracted from the PELA-USAL project, associating each parliamentarian with the position of their party on the left-right spectrum in each period. This ranges between 1.52 on the left and 9.44 on the right. Control variables are the total number of speeches or meetings, whichever is the case, in addition to electoral safety,Footnote 8 the legislator’s age at the beginning of the legislative session (a continuous variable), and the distance of the district from the capital (logarithm). In turn, in the cases of the separate models for women, indigenous peoples, and people living in poverty, additional controls were included in each, namely: the relevant magnitude in their district; the proportion of female heads of household; the proportion of indigenous people in the population; and the poverty rate.Footnote 9 To control for whether tenure may induce legislators, including female ones, to stop representing disadvantaged groups, as previous evidence suggests (Bailer et al. Reference Bailer, Breunig, Giger and Wüst2022), we include a variable Tenure, which represents the number of terms in office.
Mean Number of Meetings and Speeches Regarding Disadvantaged Groups, by Term and Legislator’s Gender (Standard Deviations in Parentheses)

Source: Authors’ own data.
Results
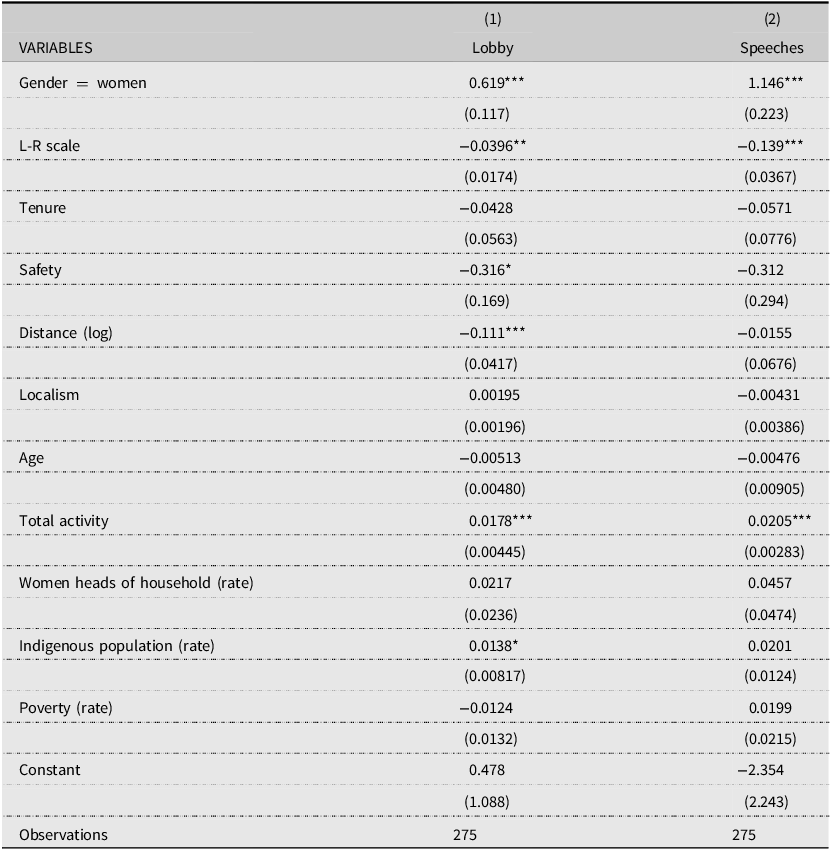
To evaluate the hypotheses, we estimate the effect of a legislator’s gender and ideology on the number of speeches and meetings with groups coded as disadvantaged. Table 2 presents two models. We count meetings with and speeches about any of the disadvantaged groups considered. Of the 9,303 meetings, 7.9 percent were with a disadvantaged group. The frequency of speeches directed at any of these groups is 2.5 percent of the total 7,606 speeches given. Both in the lobby and speeches, being a woman has a positive effect on representing disadvantaged groups, even after controlling for other determinants of legislators’ behavior. As previously indicated, the effect of gender on the number of speeches and lobbying meetings depends on whether the groups involved are marginalized or disadvantaged groups or not. Regarding our second hypothesis, one finding stands out: the variable capturing the position within the left-right scale is negatively correlated with the outcome in the two mechanisms considered in our research: speeches and meetings. Hence, legislators located at the right of the ideological distribution are, overall, less likely to represent disadvantaged groups.
Models for Any Disadvantaged Group
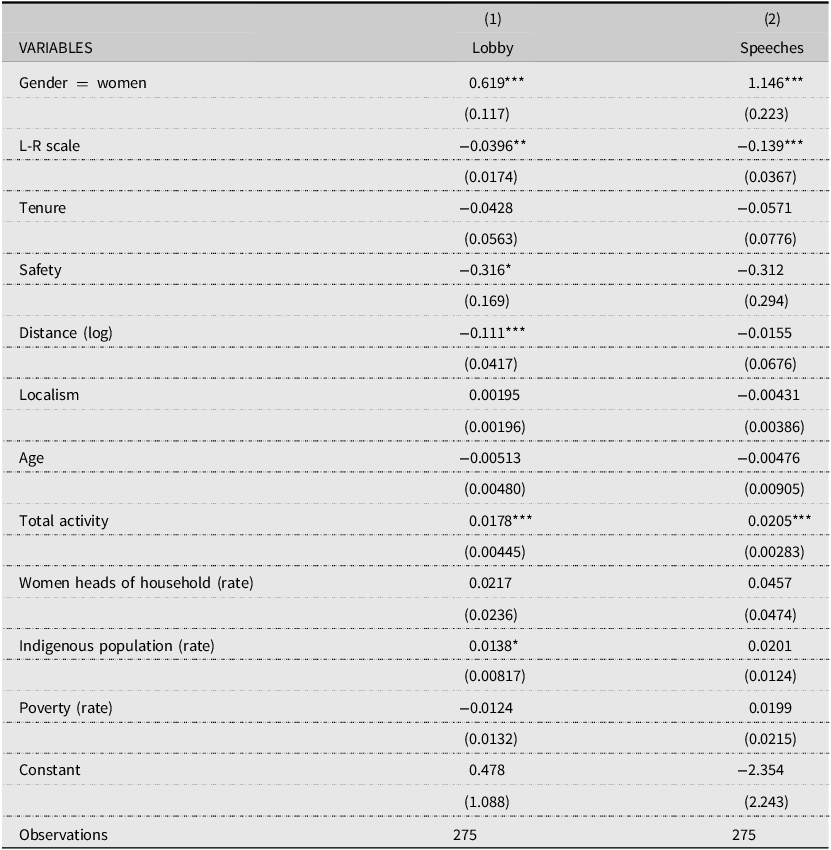
Note: Models estimated using negative binomial regression for the count of meetings and speeches per legislator. Robust standard errors in parentheses. *** p<0.01, ** p<0.05, * p<0.1.
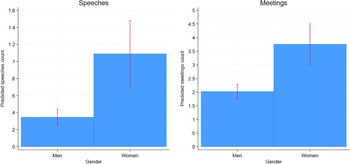
A useful way of observing these results is plotting the predicted number of meetings and speeches regarding disadvantaged groups. Figure 1 shows them separating out men and female legislators. An average woman legislator would have 1.1 speeches, compared to just 0.3 in the case of a male legislator. Regarding meetings, predicted counts are 3.8 and 2.0, respectively. Although the counts are low, the 95 percent confidence intervals provided demonstrate a statistically significant difference by gender, where women are more likely to represent disadvantaged groups in both speeches and meetings.
Predicted Counts of Speeches and Meetings, by Gender.
Note: Based on models 1 and 2 of Table 1. Mean values for all control variables.

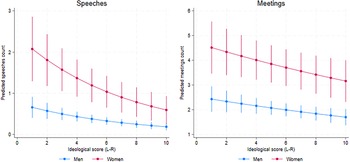
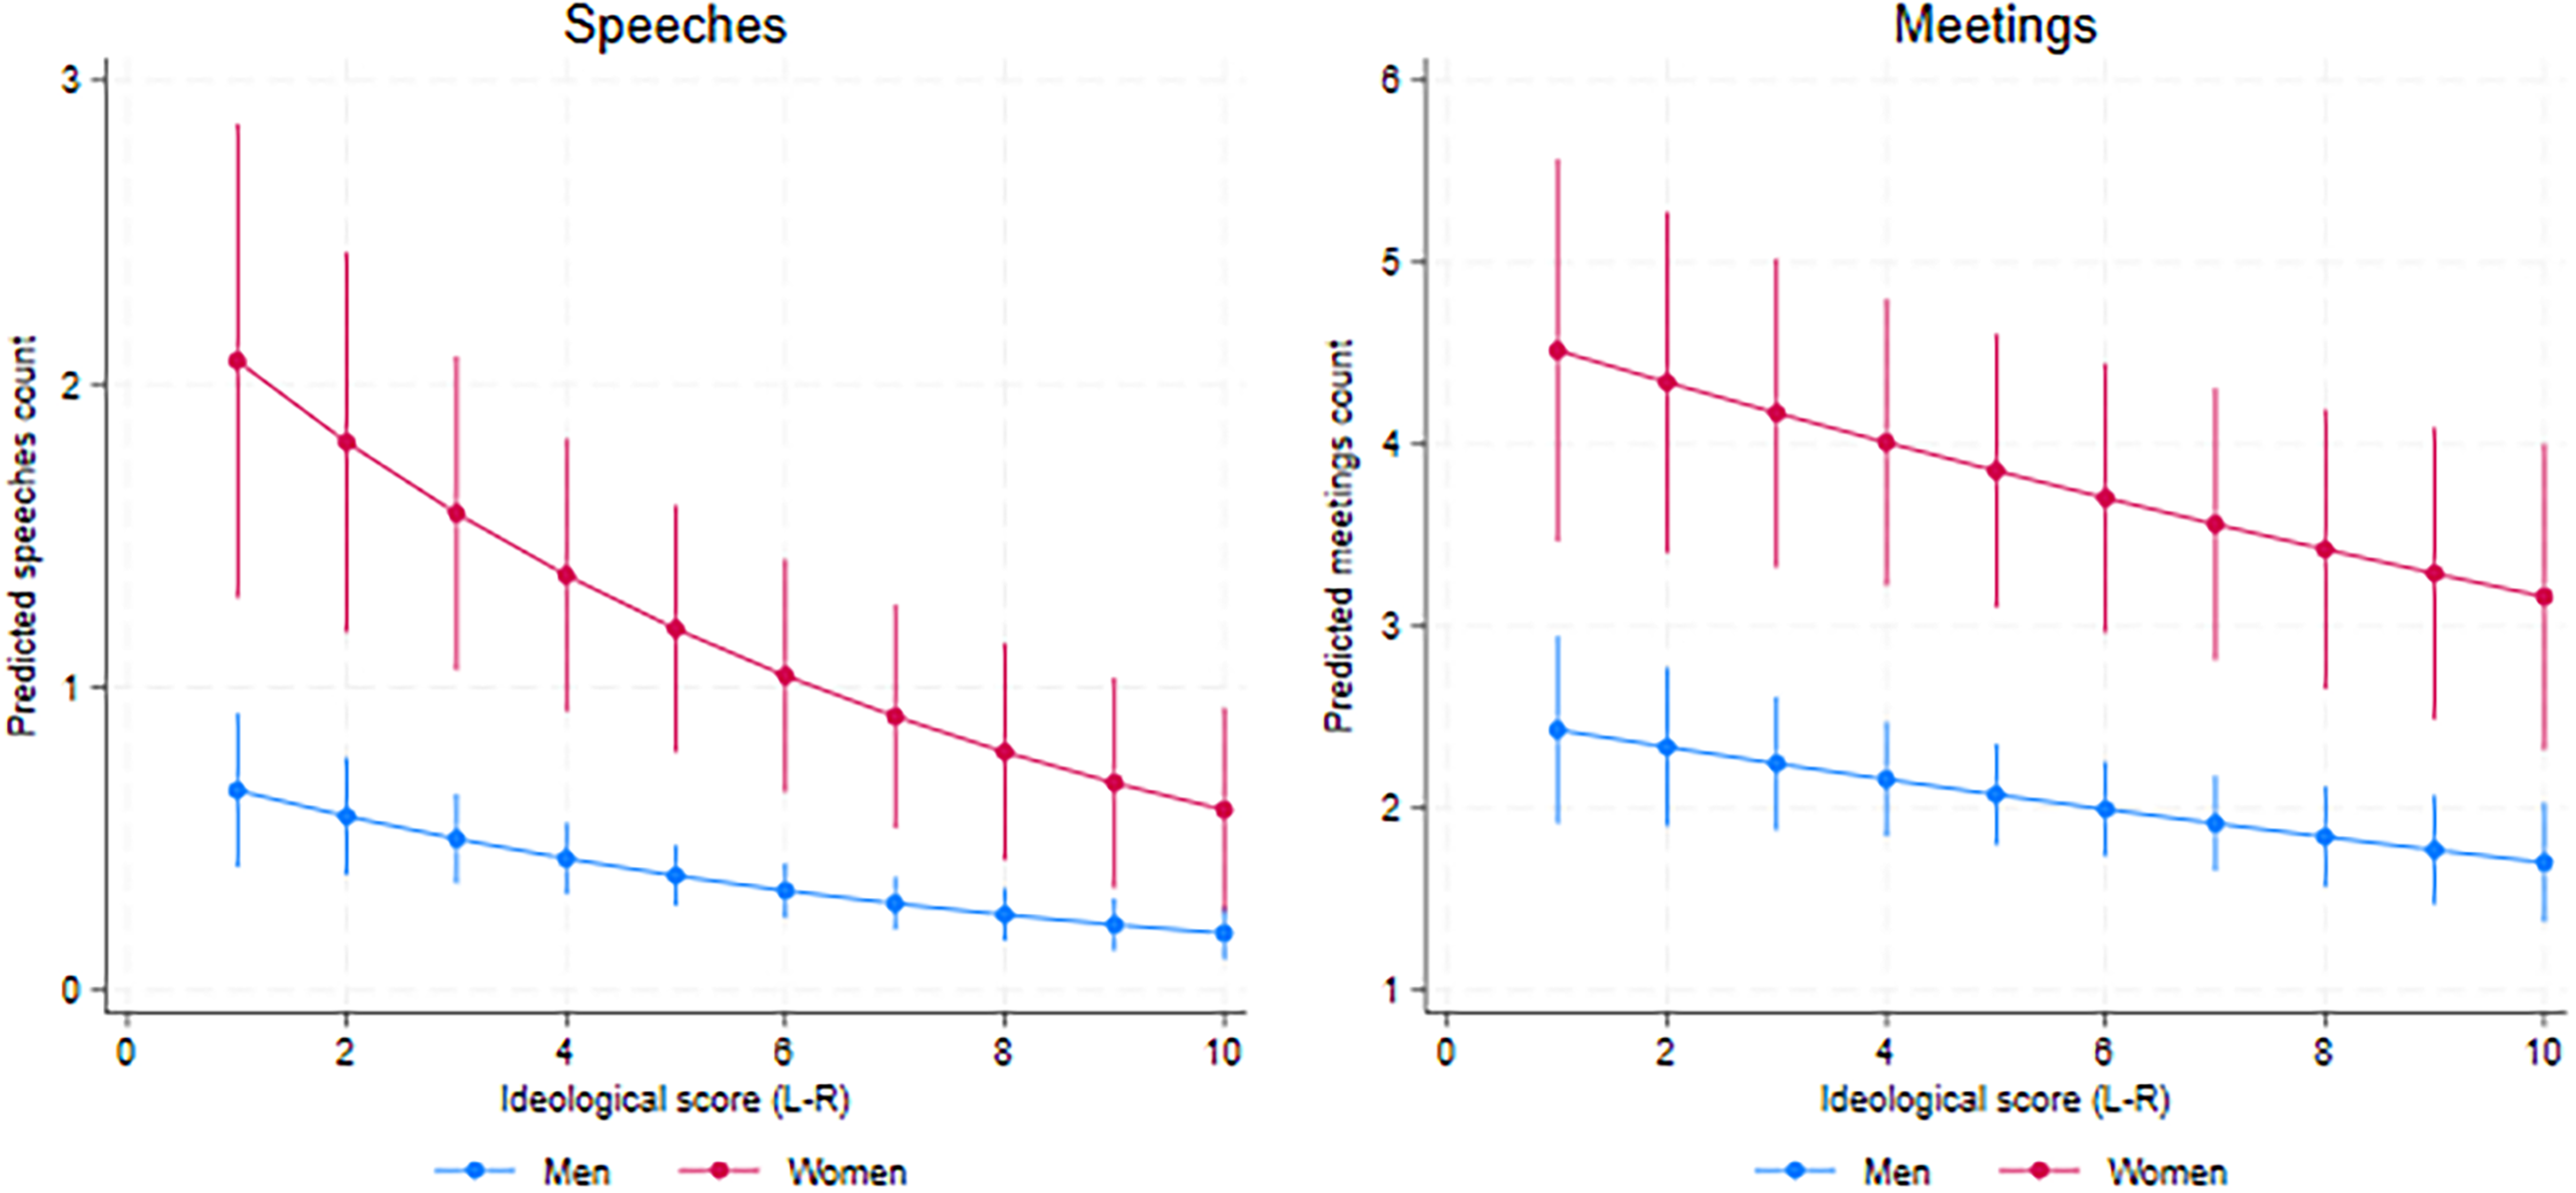
Figure 2 also includes the effect of the left-right political scale, for an average legislator in the rest of the variables. At any position, women show a statistically significant positive difference in the number of both speeches and meetings, which can be seen using the 95 percent confidence intervals provided. A legislator in a centrist position (5.5) would hold 3.8 meetings if being a woman, compared to 2.0 if being male. This plot also shows that the more leftist a legislator is, the more active they are in representing disadvantaged groups. For example, an average legislator who is a woman located at the extreme left of the scale would do 4.5 meetings, compared with 2.4 of a male counterpart. At the other extreme of the left-right scale, predicted counts are 3.2 and 1.7, respectively. In the case of speeches, counts are lower, but substantive results are the same: women are more active than men and the left is more active than the right.10 This corroborates previous research that shows how women legislators in Chile introduce more bills in policy areas classified as part of women‘s interests (Dockendorff et al. Reference Dockendorff, Gamboa and Aubry2022).
Predicted Counts of Speeches and Meetings, by Gender and Ideology.
Note: Based on models 1 and 2 of Table 1. Mean values for all variables not shown in the plots.
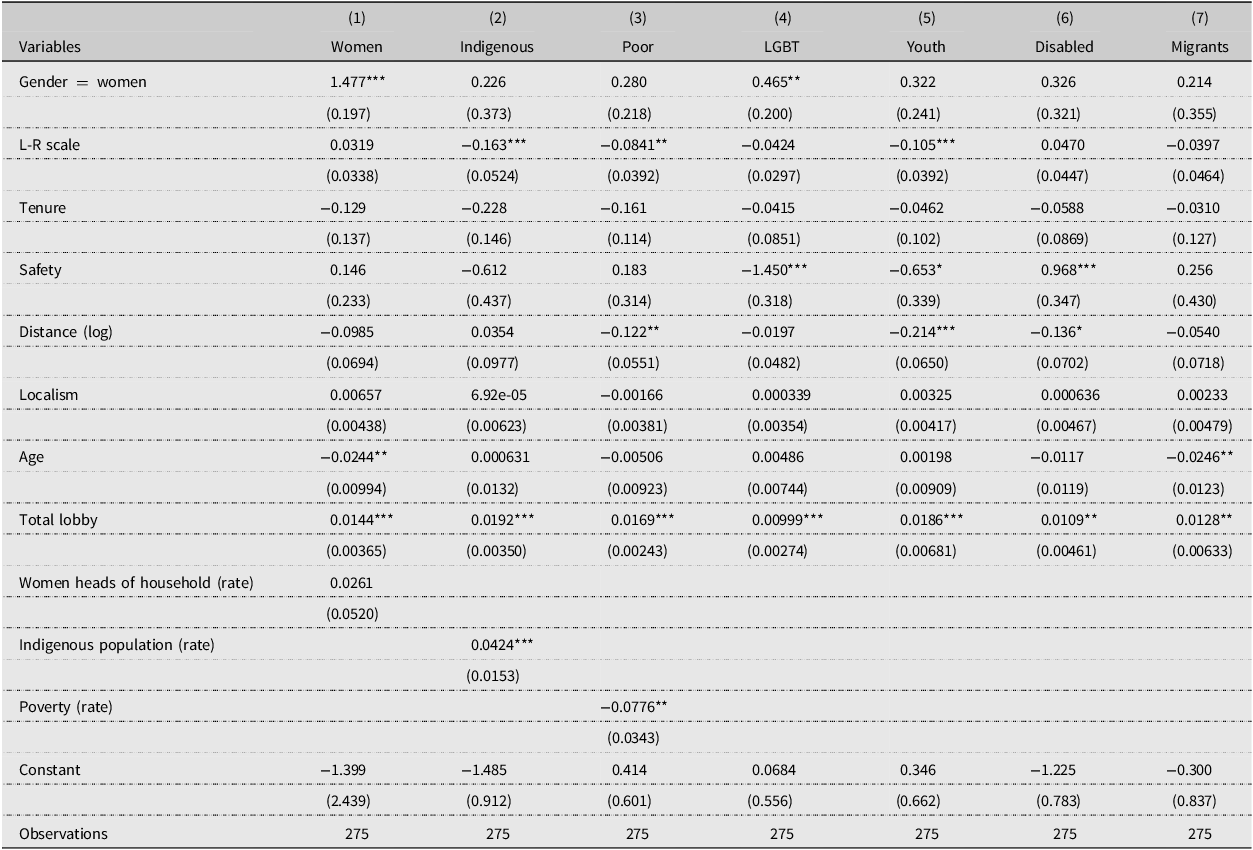
Now, recall that the estimates reported above are obtained for any of the disadvantaged groups considered. It is reasonable to assume that there may be differences in how women represent the different groups classified as disadvantaged in our data. Thus, the analysis that follows will focus on the individual representation of each group separately. Each model captures the relationship between our predictors with the outcome for every group. Table 3 presents the models that refer to meetings. Being a woman has a statistically significant positive effect in the case of meetings with women and with LGBT groups. In all the other cases, women’s behavior is indistinguishable from men’s: although the coefficients are positive, they are not statistically significant at any level. As for ideological position, it has a negative effect—a movement to the right of the spectrum decreases the expected number of speeches—in the case of indigenous peoples, people living in poverty, and young people.
Models for Meetings

Note: Models estimated using negative binomial regression for the count of meetings per legislator. Robust standard errors in parentheses. *** p<0.01, ** p<0.05, * p<0.1.
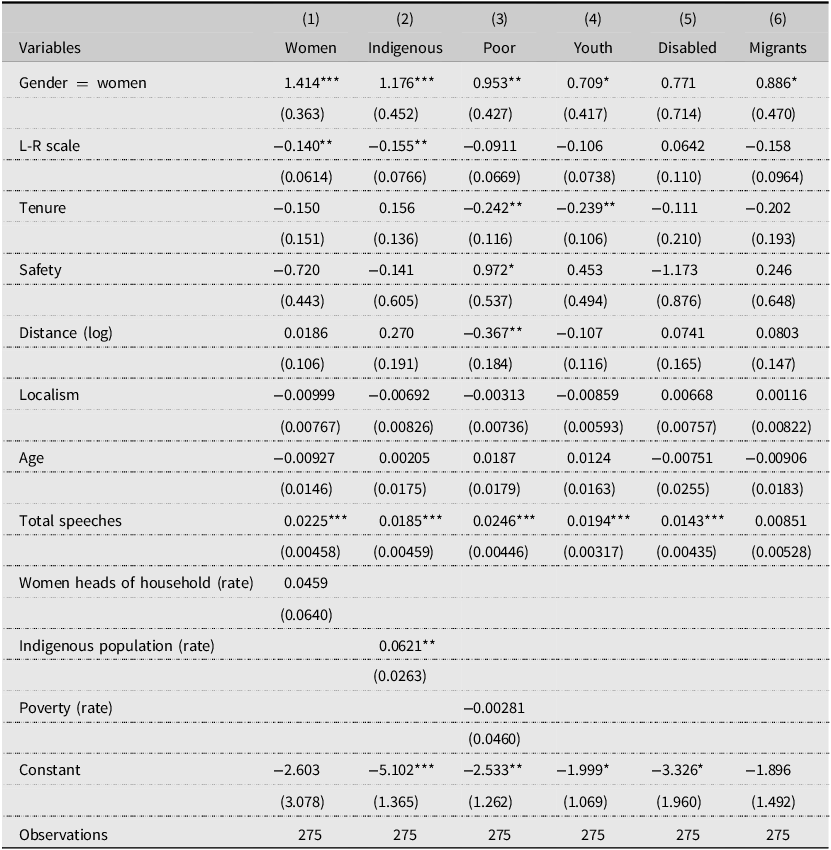
Table 4 shows the models that refer to speeches for each individual group coded in our data. Being a woman has a positive and statistically significant effect on the number of speeches about women, indigenous peoples, poverty, and migrants, although in the latter case, the result is only statistically significant at p<0.1. There is no significant effect in the case of young people and disabled. In the case of ideological position, this has a negative effect in two cases: women and indigenous peoples.
Models for Speeches

Note: Models estimated using negative binomial regression for the count of speeches per legislator. Robust standard errors in parentheses. *** p<0.01, ** p<0.05, * p<0.1.
Finally, it is worth addressing the reform that introduced the quota in the 2017 election. Even though that is not directly related to our theoretical model, we consider it interesting to comment on the potential effect of the quota law on substantive representation. Descriptive statistics show that overall, the total number of meetings with any disadvantaged group increased but not dramatically. The percentage of meetings involving any disadvantaged group rose slightly, from 7.5 percent to 9.5 percent when we move from the pre quota to the reformed period. In the case of speeches, the percentage mentioning any disadvantaged group remained about the same, rising from 2.6 percent to 3.2 percent.
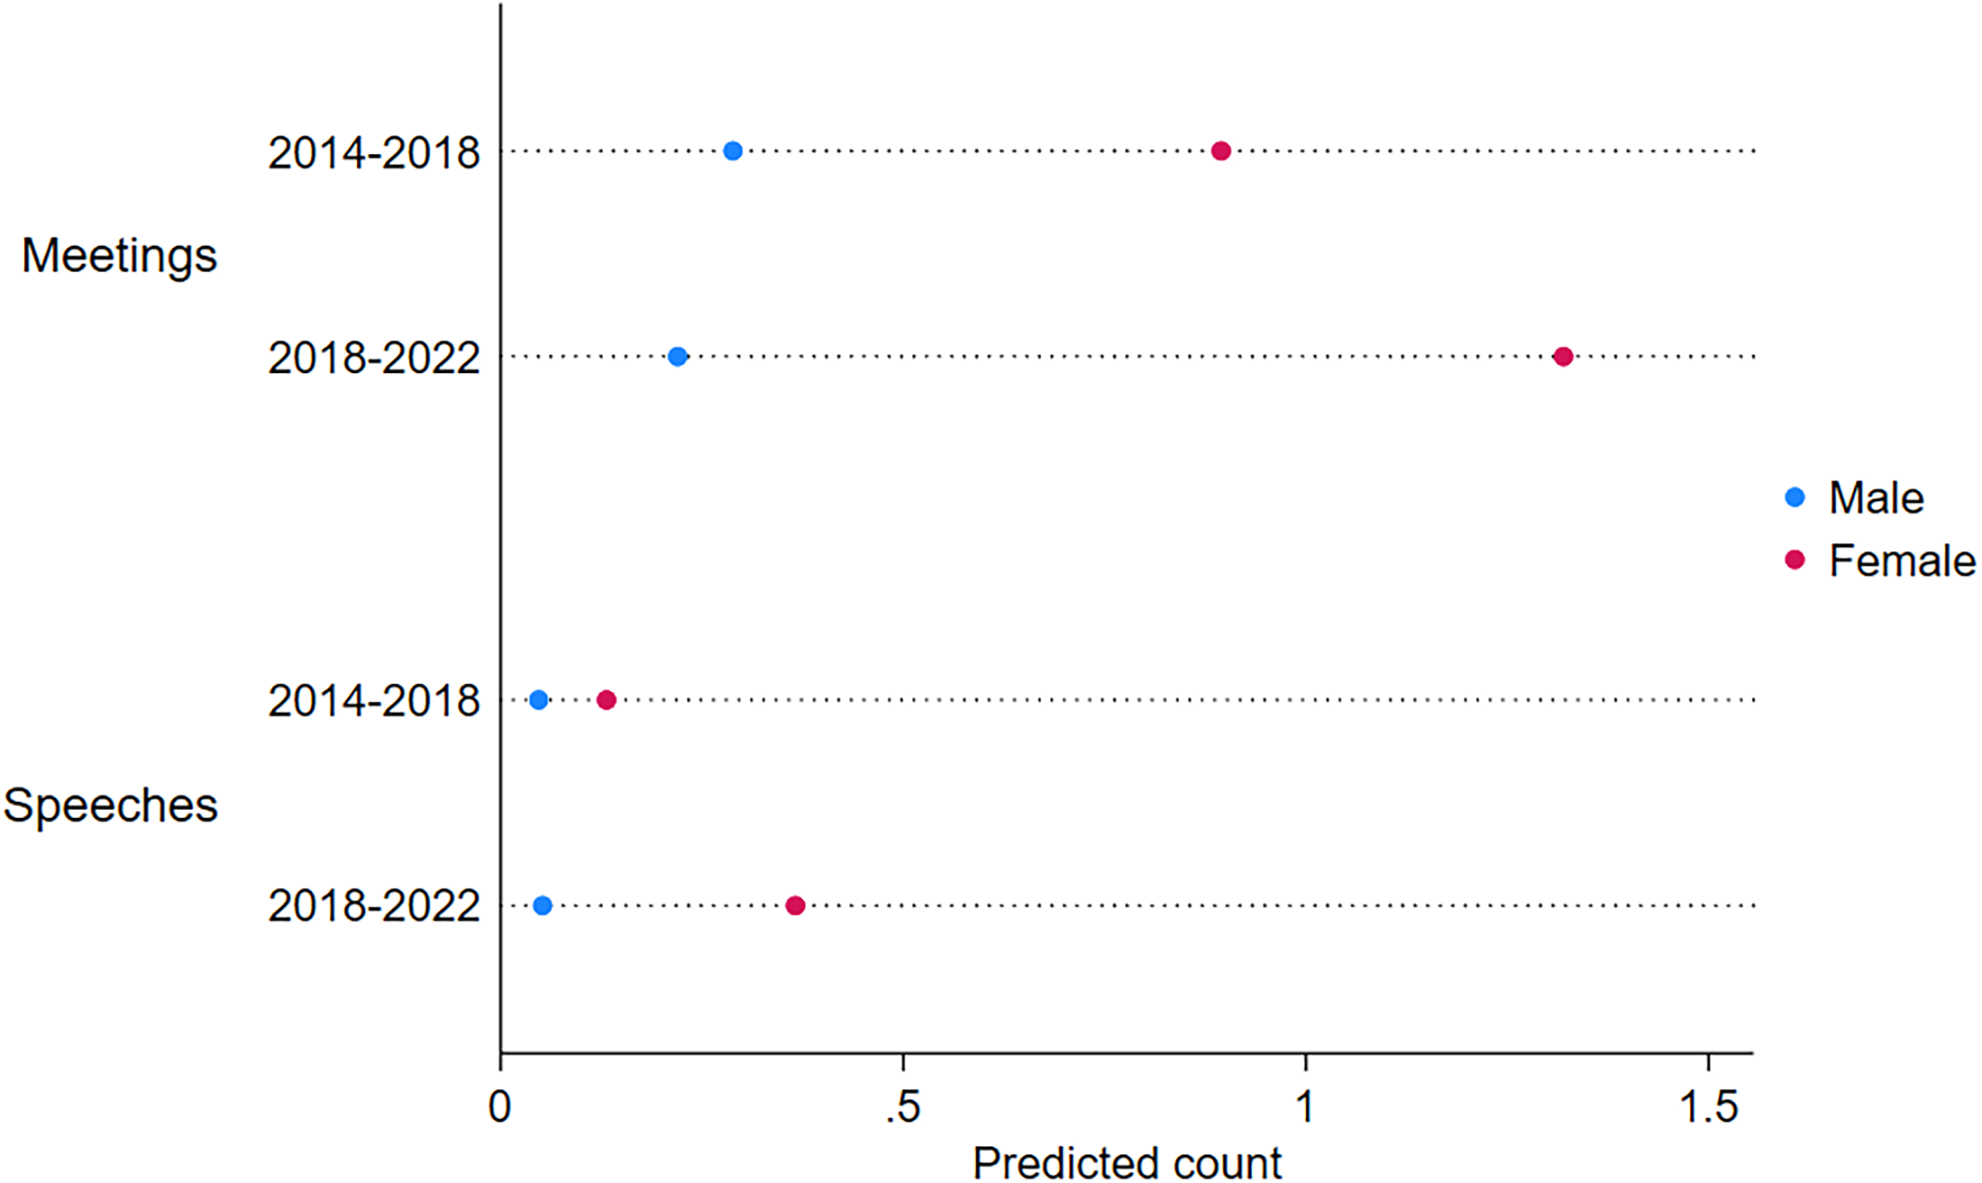
To see whether the quota makes a difference on parliamentarians’ behavior, we re-estimated the models separately by legislative term, even though it reduces the number of observations. We considered only women-related matters. The results show that women have a significantly larger number of meetings with women’s organizations on each of the legislative terms, with a significantly bigger difference in the second term (when the quota was implemented). Regarding speeches, that only happens during the second term, while we cannot detect such an effect earlier (see Figure 3). All this may indicate some small effect due to the introduction of the quota law.

Overall, the outcomes of our models are consistent with our baseline theoretical expectations: we anticipated that women are more likely to represent disadvantaged groups and that this is correlated to ideology: left-wing deputies represent more those marginalized groups. Overall, we find support for our hypotheses but with nuance, which we discuss in the next section.
Discussion
Women deputies in Chile make a difference. They demonstrate greater willingness to open channels of communication with marginalized groups and act in their interest. Ideology also plays a role. This may be understood as a way of representing substantively those groups, since this involves the representative, as Pitkin noted, acting in a way that is receptive to them. As it stands, providing access to those groups and voicing their demands is a form of substantively representing them. The results suggest that substantive representation of marginalized groups is not necessarily channeled only by actors who share descriptive characteristics of the represented. All that said, the identification strategy here does not allow us to isolate the causal mechanism, even though we assume that it is linked to the legislative marginalization of women legislators. Future research needs to address this issue in depth.
A suggestive result indicates that women do not represent all marginalized groups equally. In the case of meetings, being a woman is associated with providing more access to groups representing mainly women and the LGBT community. There are many underlying causes. One possibility is the affinity between women’s interests and LGBT, which may result in similar advocacy coalitions or joint mobilizations. Thus, it may be possible that LGBT groups have incentives to seek access to female politicians because they may be more receptive to their demands. In the case of speeches, women appear to represent more groups in comparison to meetings. Perhaps it may be the case that deputies enjoy more leeway in crafting the speechmaking portfolios compared to lobbying exchanges, because the latter requires the agency of lobbies or groups as a first move in the access dynamic. All this, however, is somewhat speculative and demands further analysis.
Additionally, it is quite interesting to note the difference between gender and ideology when disaggregating the analysis by group. In both speeches and meetings, the groups where being a woman predicts greater representation are not the same ones where ideological distribution has an effect. This may be indicative of a gendered pattern of representation beyond political cleavages or partisan politics, but again, this deserves further analysis.
Finally, a somehow normative implication of our results refers to the assumption that a democratic assembly would be more representative when groups are sufficiently represented by elected politicians. If the dynamic observed in Chile is representative of what happens in other latitudes, this would suggest a pattern where women are agents of a more inclusive democratic representation, even in the absence of (descriptive) representatives of marginalized groups. Extrapolating from the above, this suggests that substantive representation is not achieved only with descriptive mechanisms. Other actors may perform this function, in this case: women.
All that said, the scope conditions of our research design require testing our arguments in other Latin American cases to see if our findings hold in those contexts: for example, in societies where indigenous represents a greater percentage of the population, where quotas to foster female representation have been in place for longer, or in other political systems with different percentages of women in the assembly. Considering our identification strategy, further analysis may include other mechanisms such as legislators’ bills, amendments and the like. For instance, analyzing legislative outcomes would allow us to see whether women achieve effective changes in favor of disadvantaged groups. Also, since part of our data consists of speeches, further research may explore predominant discourses qualitatively, which may allow researchers to reveal relevant nuances: for example, the intensity of speeches claiming to represent disadvantaged groups, or specific topics and interpretations that remain obscure in quantitative analyses.
Competing interests
The authors declare that they have no competing interests.
Funding
This work was supported by Fondecyt Regular Grant No. 1241567 and No. 1230531; ANID Millenium Science Initiative Program (grant NCS2024_007).