Implications
The metabolic state of lactating sows was monitored to assess phenotypic relations with follicular development at weaning. Lactational backfat loss was related to a higher backfat thickness at parturition and to a higher average follicle size at weaning. These results could implicate that sows with more backfat are able to mobilise more energy from backfat during lactation and could thereby spare protein reserves to support follicular development. A better understanding of the relation between energy mobilisation of different substrates during lactation in relation to follicular development could eventually be used for optimal breeding and feeding strategies for lactating sows.
Introduction
Over the last decades, pigs have been genetically selected to produce larger litters. Sows with larger litter sizes usually have lower average piglet birth weights (Tuchscherer et al., Reference Tuchscherer, Puppe, Tuchscherer and Tiemann2000) and higher birth weight variation (Tuchscherer et al., Reference Tuchscherer, Puppe, Tuchscherer and Tiemann2000; Milligan et al., Reference Milligan, Fraser and Kramer2002; Wientjes et al., Reference Wientjes, Soede, Van der Peet-Schwering, Van Den Brand and Kemp2012) which are related to higher piglet mortality during subsequent lactation (Milligan et al., Reference Milligan, Fraser and Kramer2002). Lower piglet birth weights and higher birth weight variation therefore strongly impact pig welfare and profitability (Fix et al., Reference Fix, Cassady, Holl, Herring, Culbertson and See2010). The cause and underlying mechanism of highly variable piglet birth weights and consequently higher birth weight variation are not completely clear. One factor that has been identified to increase birth weight variation is a negative energy balance (NEB) during lactation (Wientjes et al., Reference Wientjes, Soede, Knol, Van den Brand and Kemp2013). This NEB negatively influences, during and after lactation, the development of follicles that will give rise to the next litter (reviewed by Prunier and Quesnel, Reference Prunier and Quesnel2000). Therefore, we hypothesise that decreased piglet birth weights and increased variation in birth weight could result from impaired and more variable follicular development during the previous lactation.
Evidence for this hypothesis comes from studies in which the pre-mating metabolic state of sows affects embryonic development and uniformity (e.g. Ferguson et al., Reference Ferguson, Slevin, Edwards, Hunter and Ashworth2006; Patterson et al., Reference Patterson, Smit, Novak, Wellen and Foxcroft2011) and subsequent piglet birth weights and uniformity (van den Brand et al., Reference Van den Brand, Soede and Kemp2006). In addition, a study by Wientjes et al. (Reference Wientjes, Soede, Knol, Van den Brand and Kemp2013) showed that body condition loss during lactation was related to increased variation in birth weight of the next litter. The influence of the metabolic state during lactation on variation in birth weight of the next litter may be explained by metabolic influences on follicular development during lactation. For instance, feed restriction during lactation has been shown to result in a decreased LH pulse frequency during lactation and around weaning (Quesnel et al., Reference Quesnel, Pasquier, Mounier and Prunier1998a; van den Brand et al., Reference Van den Brand, Dieleman, Soede and Kemp2000), a smaller follicle size at weaning and 48 h later (Quesnel et al., Reference Quesnel, Pasquier, Mounier and Prunier1998a) and decreased oocyte maturation rates when isolated 38 h before the anticipated onset of oestrus (Zak et al., Reference Zak, Xu, Hardin and Foxcroft1997).
Furthermore, follicular heterogeneity has been related to embryonic heterogeneity (Pope et al., Reference Pope, Wilde and Xie1988 and Reference Pope, Xie, Broermann and Nephew1989; Xie et al., Reference Xie, Broermann, Nephew, Bishop and Pope1990) which, in turn, is an important determinant of variation in birth weights (Van der Lende et al., Reference Van der Lende, Hazeleger and De Jager1990).
These observations together indicate the importance of a more detailed analysis of follicular development during lactation in order to identify possible causes for variation in birth weight. Therefore, the aim of the current study is to identify possible causes of variation in birth weight by studying follicular development and oocyte quality of sows directly after weaning. To investigate this, we compared sows with a high v. low estimated breeding value (EBV) for variation in birth weight. In addition, the metabolic state of the sows is monitored to assess phenotypic relations between the metabolic state and follicular development at weaning.
Material and methods
Animals
A total of 30 multiparous Dutch Landrace sows (parity (PAR) 3 to 5; Topigs Norsvin, Vught, the Netherlands) housed at a local farm were selected based on EBV for variation in birth weight. Breeders can produce an EBV for each individual sow and it is regarded as the best estimate of the genetic potential for heritable traits such as variation in birth weight. The EBV is expressed as the standard deviation of the piglet birth weights within a litter in grams and is calculated based on genetic background and previous performance. Average EBV of all PAR 3 to 5 animals on the farm was −6.3±17.1 (−41.9 to 28.0). A total of 15 sows were selected with a high EBV for variation in birth weight (High-EBV; 15.8±1.6; 5.4 to 28.0) and 15 sows were selected with a low EBV (Low-EBV; −24.7±1.5; −14.9 to −31.1). Average PAR was 3.7±0.3 for High-EBV sows and 3.9±0.2 for Low-EBV sows. The sows were fed a standard lactation diet (ca. 12.5 MJ Net energy/kg, 154 g/kg CP, 9.3 g/kg lysine; Lacto Excellent, Agrifirm, Apeldoorn, The Netherlands) and feed intake was assessed daily. Within 24 h after parturition, piglets were cross-fostered to ensure 13 suckling piglets per sow. The sows had a lactation period of 26.1±0.2 (25 to 27) days and the experiment took place over a period of 10 weeks. Each week, 1 or 2 sows of each group (High-EBV and Low-EBV; so a total of 2 to 4 sows per week) entered the experiment. The sows were slaughtered at the slaughterhouse by stunning and exsanguination within 2 h after weaning.
BW and backfat thickness
The sows were weighed approximately 1 week before parturition and immediately after weaning. Weight after parturition was estimated according to Bergsma et al. (Reference Bergsma, Kanis, Verstegen, van der Peet–Schwering and Knol2009) by correcting the BW of the sows as measured 1 week before parturition for weight of the foetuses, placenta and intra-uterine fluid. Backfat thickness was measured 6.5 cm from the midline over the last rib both on the left and the right side using A-mode ultrasonography (Renco Lean-Meater; Renco Corporation, Golden Valley, MN, USA) 1 week before parturition, within 12 h after parturition and immediately after weaning. Weight loss during lactation was calculated by subtracting BW at weaning from the estimated BW at parturition. A correction according to Bergsma et al. (Reference Bergsma, Kanis, Verstegen, van der Peet–Schwering and Knol2009) was used for water content of mammary glands to prevent underestimation of BW loss, since mammary glands contain more water at the end of lactation compared with the start of lactation. Body weight loss was expressed as a percentage of BW at parturition. Piglets were weighed within 24 h after parturition and at weaning (26.1±0.2 days postpartum). Litter growth during lactation, as a measure for sow milk production, was calculated and corrected for mortality weight of the piglets that died during lactation, according to Bergsma et al. (Reference Bergsma, Kanis, Verstegen, van der Peet–Schwering and Knol2009).
Collection of ovaries and blood samples
The left ovary was stored in a thermo-container and covered with the uterus to keep the ovaries at a temperature above 30°C for subsequent follicle aspiration. The right ovary was cut in two halves, immediately frozen in liquid nitrogen and stored at −80°C until further analysis. Blood was collected from the jugular vein at slaughter in 9 ml serum clot activator collection tubes and in 9 ml Ethylenediaminetetraacetic acid (EDTA)-coated tubes (Greiner Bio-One, Monroe, NC, USA), to obtain serum and plasma samples, respectively. The serum collection tubes and the EDTA coated tubes were stored on ice and transported to the laboratory. In the lab, the EDTA tubes were immediately centrifuged at 500×g for 10 min at 4°C to collect plasma. The serum tubes were first incubated overnight at 4°C and subsequently centrifuged to collect serum. Both plasma and serum samples were stored in −20°C until further analysis.
Measurements left ovary (fresh)
The left ovary was, after transportation to the lab, placed in phosphate-buffered saline (PBS) pH 7.4 in a water bath at 37°C. Within 5 h after slaughter, the ovaries were used for follicle aspiration. The 15 largest follicles were aspirated as these are assumed to represent approximately half of the ovulatory follicle pool, as ovulation rates in modern sows are around 25 to 30 (da Silva et al., Reference da Silva, Laurenssen, Knol, Kemp and Soede2016). The contents were collected in a tube and allowed to settle for 5 min. The supernatant was removed and centrifuged at 1900×g at 4°C for 30 min to collect the follicular fluid and assess the amount of follicular fluid. The recovered cumulus-oocyte complexes (COCs) were morphologically classified under a dissection microscope as normal (intact cumulus and normal-shaped oocyte) or atretic (degraded cumulus or degenerated oocyte), according to Alvarez et al. (Reference Alvarez, Dalvit, Achi, Miguez and Cetica2009).
Right ovary (frozen)
The two halves of the right ovary were used to measure follicle size. Of each half of the ovary, three cutting planes were made in a cryostat in order to study (almost) all follicles on the surface of the ovary. Of each of these cutting planes, photographs were taken; the ovaries were held against a ruler to measure the size of the follicles. Follicle size was determined as the largest macroscopically visible diameter of the follicle.
To determine if the follicles were healthy or atretic, cryo-sections of the right ovary were made and immunohistochemical staining for the presence of cleaved-Caspase 3 was performed (Supplemental Figure S1), a marker for cells in apoptosis similar to Slot et al. (Reference Slot, Voorendt, de Boer-Brouwer, van Vugt and Teerds2006). In short, cryo-sections were mounted on superfrost plus glass slides (Menzel-Gläser, Braunschweig, Germany). Sections were fixed in 4% buffered formalin for 10 min, washed in H2O, microwaved for 3×5 min in 0.1 M sodium citrate buffer (pH 6) for epitope antigen retrieval, cooled down to room temperature and subsequently rinsed PBS pH 7.4. Endogenous peroxidase activity was blocked with 3% (v/v) hydrogen peroxide in methanol solution for 30 min and aldehyde residues were blocked with 0.3% glycine in PBS for 10 min. After rinsing with PBS, sections were pre-incubated with 5% (wt/v) normal goat serum in PBS for 60 min at room temperature. Subsequently, the sections were incubated overnight at 4°C in a humid chamber with primary polyclonal rabbit anti-cleaved-Caspase 3 antibody (9661S; Cell Signalling Technology, Danvers, MA, USA) diluted 1 : 1000 (v/v) in PBS-BSA-c (Aurion, Wageningen, The Netherlands). Next, sections were rinsed with PBS and treated with a secondary biotin labelled goat-anti-rabbit antibody (Vector Laboratories, Burlingame, CA, USA) diluted 1 : 400 (v/v) in PBS-BSAc for 1 h at room temperature. After a wash with PBS and incubation with avidin-biotin complex diluted 1 : 1500 (v/v) in PBS-BSAc (Vector stain kit Elite; Vector Laboratories) for 60 min at room temperature, sections were rinsed with PBS and bound antibody was visualised using the Immpact DAB kit (stock solution diluted 1 : 400 (v/v); Vector Laboratories). Sections were briefly counterstained with Mayer’s haematoxylin (Klinipath, Duiven, The Netherlands), visualised using light microscopy (Axioskop 2; Carl Zeiss Microscopy, Thornwood, NY, USA) and imaged using imaging software (Axiovision 4.8; Carl Zeiss Microscopy).
Assay procedures
All assay procedures were performed according to manufacturer’s instructions, unless stated otherwise. All analyses were performed in duplo and only samples with an intra-assay CV⩽15% were included.
Plasma insulin and leptin concentrations were measured using a radioimmunoassay kit (Porcine Insulin PI-12K and Multi-Species Leptin XL-85K, respectively; EMD Millipore Corporation, Billerica, MA, USA), fibroblast growth factor 21 (FGF21) was measured using an ELISA kit (Abbexa, Cambridge, UK) and plasma urea and creatinine were measured using an enzymatic colorimetric test (Urea liquicolor; Human Gesselschaft fur Biochemica und Diganostica mbH, Wiesbaden, Germany and Creatinine PAP FS; DiaSys Diagnostic Systems GmbH, Holzheim, Germany, respectively). Plasma IGF1 was measured with an immunoradiometric assay according to the manufacturer’s protocol (A15729; Beckman Coulter, Woerden, The Netherlands) supplemented with additional acid-ethanol extraction (87.5% v/v EtOH and 2.9% v/v 12N HCl). For serum non-esterified fatty acid (NEFA) analysis, a calorimetric detection method was used (NEFA-HR(2) kit; Wako Chemicals, Neuss, Germany). Different from the manufacturer’s protocol, we added 5 µl serum to the plate and 100 µl of reagent 1 was added to the wells and incubated for 10 min at 37°C. Subsequently, 50 µl of reagent 2 was added and another incubation step of 10 min at 37°C followed.
Statistical analyses
One of the animals of the High-EBV group ovulated during lactation and was excluded from further analyses. Body weight of one animal was not recorded before farrowing and 2 FGF21 values were removed because the CV values were ⩾15%.
Distributions of the means and residuals were examined to verify model assumptions of normality and homogeneity of variance. The presence of outliers was tested by calculating the studentised residuals using proc REG and 2 outliers (1 NEFA and 1 urea value) were removed from further analyses. Follicular and metabolic differences between EBV classes (High-EBV, N=14 and Low-EBV, N=15), follicle size classes (FS: large: >5.1 mm average follicle size of the 15 largest follicles of the right ovary (N=14) and small: <5.0 mm average follicle size (N=15)), variation in follicle size classes (VARFS: large: >0.09 mm SD in follicle size of the 15 largest follicles of the right ovary (N=15) and small: <0.09 mm (N=14)) were analysed using proc GLM in SAS 9.4 (Cary, NC, USA) in models that also contained the factor PAR (PAR3 (PAR 3, N=14) and PAR4+5 (PAR 4 and 5, N=15)) and the interaction with PAR. Interactions were excluded from the models when not significant. All values are presented as least squares means. In addition, relations between metabolic parameters and between metabolic and follicular parameters were estimated using the model: Y ijk =μ+EBV+PAR+βX ijk +EBV×PAR+βX×PAR+ε ijk , where Y ijk is the dependent variable and either a metabolic or follicular parameter, β the regression coefficient and X ijk one of the metabolic parameters. The interactions were excluded from the models when not significant.
Results
Follicular parameters
Right ovary (frozen)
Average follicle size of the 15 largest follicles was 5.04±0.74 mm, whereas average follicle size of the 10 largest healthy follicles was 5.11±0.82 mm. Of the 15 largest follicles, 67.1±17.3% was classified as healthy based on cleaved-Caspase 3 staining.
Left ovary (fresh)
In total, 72.1±21.1% of the COCs isolated from the 15 largest follicles was classified as healthy. The total amount of follicular fluid of the 15 largest follicles was 369 ±153 µl.
Estimated breeding value class for within-litter variation in piglet birth weight
High-EBV sows had an average EBV for variation in birth weight of 15.8±1.6 and Low-EBV had an average EBV of −24.7±1.5 (P<0.001). High-EBV and Low-EBV sows did not differ in body condition or any of the measured metabolic parameters nor did they differ in any of the piglet parameters (average birth weight, variation in birth weight (SD), litter growth during lactation; Table 1).
Effects of estimated breeding value (EBV) classes for within-litter variation in piglet birth weight (high (N=14) v. low (N=15)) and parity classes (PAR; 3 (N=14) v. 4+5 (N=15)) on gestation and lactation parameters, body condition and metabolic parameters at weaning in sows

All values are presented as least squares means.
RMSE=root mean square error; EBV=estimated breeding value; LVR=within-litter variation in piglet birth weight (SD); FGF=fibroblast growth factor; NEFA=non-esterified fatty acid.
1 Interactions between EBV and PAR were never significant.
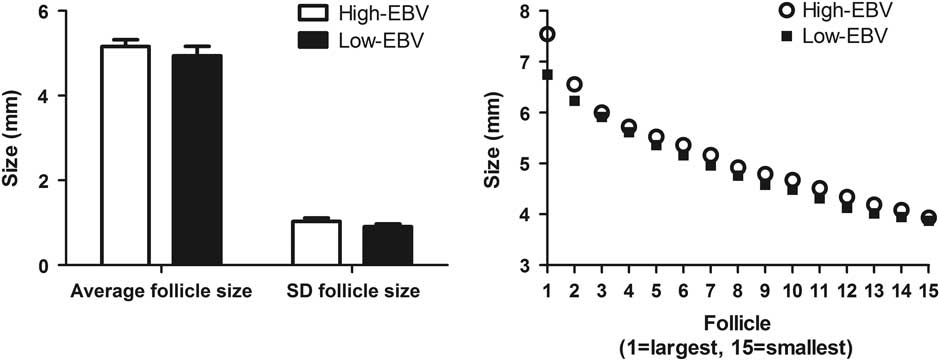
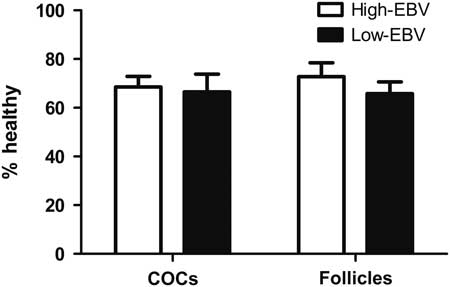
In addition, follicular parameters at weaning did not differ between sows with High-EBV and Low-EBV; neither average FS or VARFS of the 15 largest follicles (Figure 1), nor percentage healthy COCs or percentage healthy follicles (Figure 2; all Supplemental Table S1). Interactions between EBV class and PAR were never significant.
(a) Average follicle size and variation (SD) in follicle size of the 15 largest follicles of the right ovary for estimated breeding value (EBV) class for within-litter variation in piglet birth weight (High-EBV (N=14) and Low-EBV (N=15)). (b) Average size (cm) of the 15 largest follicles (1=largest, 15=smallest) of the right ovary for High-EBV and Low-EBV sows.

Percentage healthy cumulus-oocyte complexes (COCs) of the left ovary and percentage healthy follicles of the right ovary for estimated breeding value (EBV) class for within-litter variation in piglet birth weight (High-EBV (N=14) and Low-EBV (N=15)) in sows. The COCs were morphologically classified as healthy or atretic according to Alvarez et al. (Reference Alvarez, Dalvit, Achi, Miguez and Cetica2009) and follicles were classified as healthy or atretic using the cleaved-Caspase 3 staining as a marker for cells in apoptosis.

Follicle size class
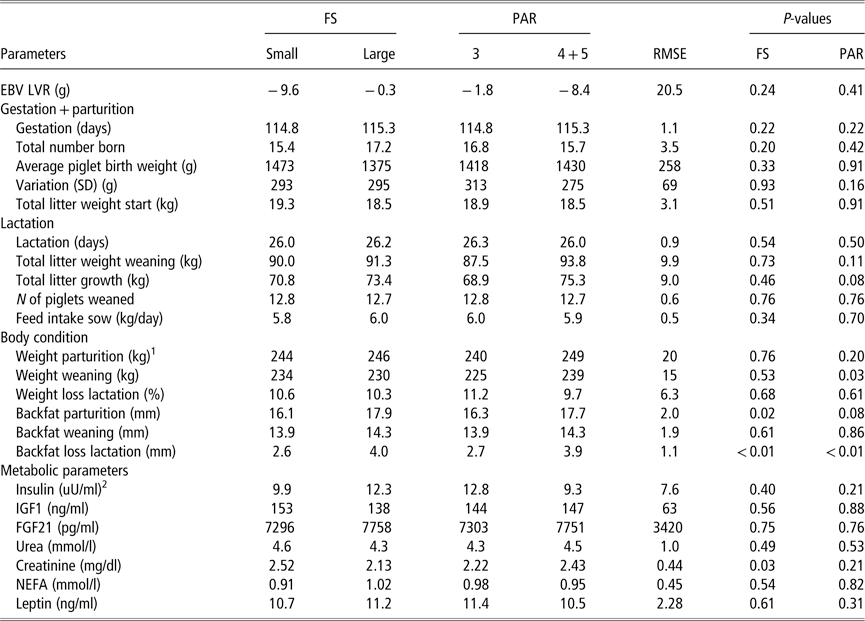
Large-FS sows (average follicle size of the 15 largest follicles >5.1 mm) had a higher backfat thickness at parturition (17.9 v. 16.1; P=0.02), higher backfat loss during lactation (4.0 v. 2.6; P<0.01) and lower creatinine levels at weaning (2.13 v. 2.52; P=0.03) compared with small-FS (<5 mm) sows (Table 2). Large-FS sows did not differ in any of the follicular parameters except for follicle size (Supplemental Table S2). Interactions between FS and PAR were only significant for BW at parturition (small-FS×PAR3=228, small-FS×PAR4+5=259, large-FS×PAR3=252, large-FS×PAR4+5=239; P<0.01) and plasma insulin levels at weaning (small-FS×PAR3=8.5, small-FS×PAR4+5=11.3, large-FS×PAR3=17.2, large-FS×PAR4+5=7.3; P=0.03).
Effects of average sow follicle size classes (FS; small<5.0 mm (N=15) v. large>5.1 mm (N=14)) and parity classes (PAR; 3 (N=14) v. 4+5 (N=15)) on gestation and lactation parameters, body condition and metabolic parameters at weaning in sows

All values are presented as least squares (LS) means.
RMSE=root mean square error; EBV=estimated breeding value; LVR=within-litter variation in piglet birth weight (SD); FGF=fibroblast growth factor; NEFA=non-esterified fatty acid.
1 LS means estimates for the interaction FS×PAR (P<0.01): small-FS×PAR3=228, small-FS×PAR4+5=259, large-FS×PAR3=252, Large-FS×PAR4+5=239.
2 LS means estimates for the interaction FS×PAR (P=0.03): small-FS×PAR3=8.5, small-FS×PAR4+5=11.3, large-FS×PAR3=17.2, large-FS×PAR4+5=7.3.
Variation in follicle size class
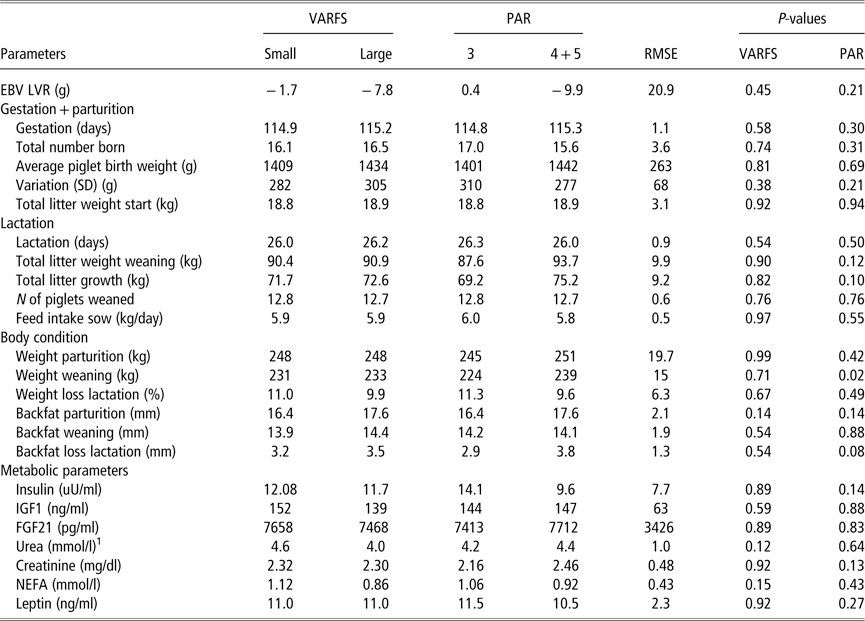
Large-VARFS sows (variation (SD) in follicle size of the 15 largest follicles >0.09 mm) v. small-VARFS sows (<0.09 mm) did not differ in any of the metabolic (Table 3) or follicular parameters, except for VARFS (Supplemental Table S3). Interactions between VARFS and PAR were only significant for urea levels at weaning (small-VARFS×PAR3=4.1, small-VARFS×PAR4+5=5.1, large-VARFS×PAR3=4.3, large-VARFS×PAR4+5=3.7; P=0.04).
Effects of average sow variation (SD) in follicle size classes (VARFS; small<0.09 mm (N=14) v. large>0.09 mm (N=15)) and parity classes (PAR; 3 (N=14) v. 4+5 (N=15)) on gestation and lactation parameters, body condition and metabolic parameters at weaning in sows

All values are presented as least squares (LS) means.
RMSE=root mean square error; EBV=estimated breeding value; LVR=within-litter variation in piglet birth weight (SD); FGF=fibroblast growth factor; NEFA=non-esterified fatty acid.
1 LS means estimates for the interaction VARFS×PAR (P=0.04): small-VARFS×PAR3=4.1, small-VARFS×PAR4+5=5.1, large-VARFS×PAR3=4.3, Large-VARFS×PAR4+5=3.7.
Parity class
Parity 4+5 sows had a higher BW at weaning (239 v. 225; P=0.02) and higher creatinine levels at weaning (2.51 v. 2.15; P=0.05) and lost more backfat during lactation (3.5 v. 2.3; P=0.02) compared with PAR3 sows (Table 1). Sows with a different PAR class did not differ in any of the measured follicular parameters (Supplemental Table S1).
Weight loss during lactation
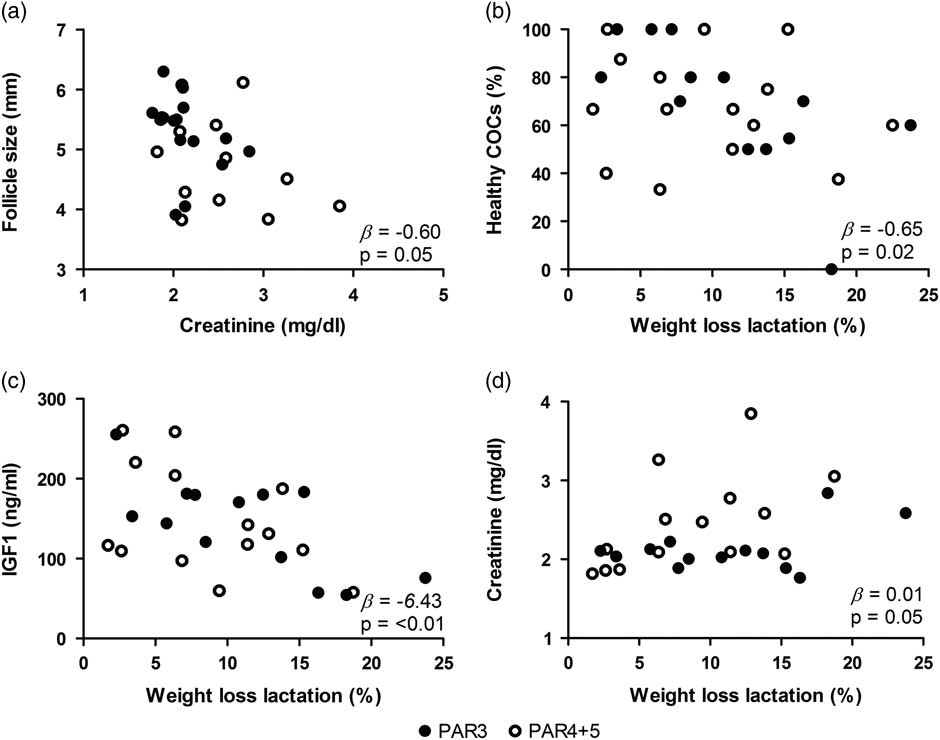
More BW loss during lactation was related to lower plasma IGF1 levels at weaning (β=−6.43 ng/ml per %, P<0.01), higher serum creatinine levels at weaning (β=0.01 mg/dl per %, P=0.05) and to a smaller percentage healthy COCs (β=−0.65%/%, P=0.02; all Figure 3). Furthermore, higher IGF1 levels tended to be related to a higher percentage healthy COCs (β=0.001%/ng per ml, P=0.10), whereas higher creatinine levels were related to a smaller average follicle size (β=−0.60 mm/mg per dl, P=0.05; Figure 3) and serum urea levels were not related to any of the measured metabolic or follicular parameters.
Regression equations (β) for the relations between (a) creatinine levels at weaning (mg/dl) and follicle size of the 15 largest follicles at weaning and weight loss during lactation (%) and (b) percentage healthy cumulus-oocyte complexes (COCs); (c) IGF1 (ng/ml) levels at weaning and (d) creatinine levels (mg/dl) at weaning in sows. The COCs were morphologically classified as healthy or atretic according to Alvarez et al. (Reference Alvarez, Dalvit, Achi, Miguez and Cetica2009). No interactions with parity class (PAR) have been found.

Backfat loss during lactation
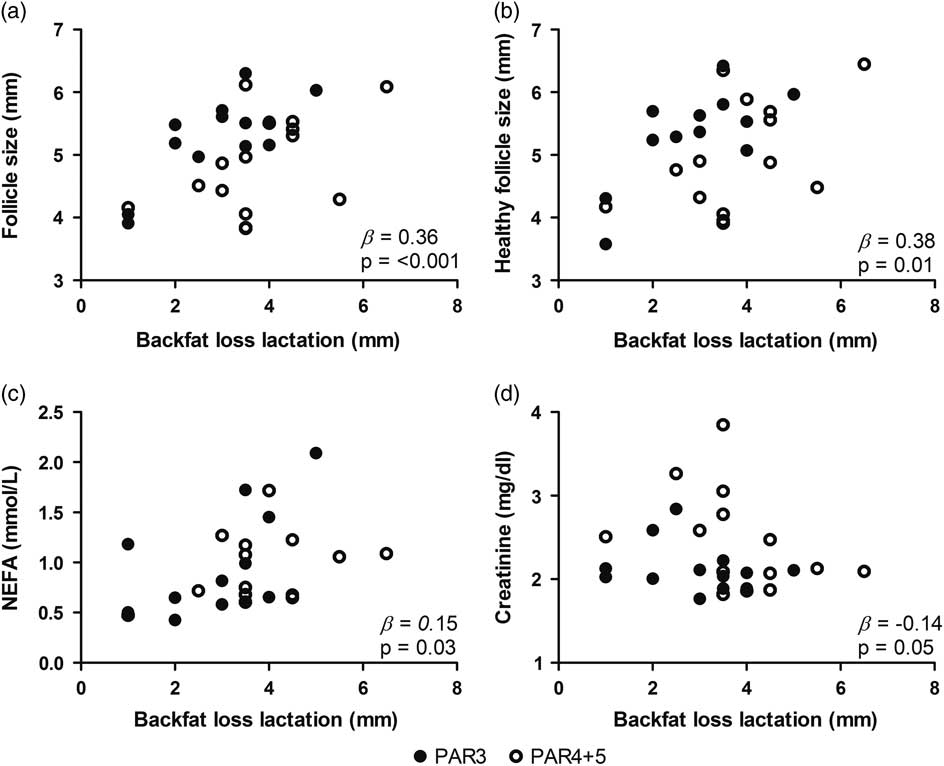
A higher backfat thickness at parturition was related to a higher backfat loss during lactation (β=0.92 mm/mm, P<0.01; Supplemental Figure S2). In addition, a higher backfat loss during lactation was related to higher serum NEFA levels at weaning (β=0.15 mmol/l per mm, P=0.03; Figure 4) and lower creatinine levels (β=−0.14 mg/dl per mm, P=0.05; Figure 4). A higher backfat thickness at parturition and a higher backfat loss during lactation were both related to a higher average follicle size of the 15 largest follicles at weaning (β=0.19 mm/mm, P=0.01 and β=0.36 mm/mm, P<0.001; Figure 4, respectively). A higher backfat loss during lactation was also related to a higher average follicle size of the 10 largest healthy follicles (β=0.38 mm/mm, P=0.01; Figure 4).
Regression equations (β) for the relation between backfat loss during lactation and (a) average follicle size of the 15 largest follicles, (b) average follicle size of the 10 largest healthy follicles, (c) serum non-esterified fatty acid (NEFA) levels (mmol/l) at weaning and (d) serum creatinine (mg/dl) levels at weaning in sows. No interactions with parity class (PAR) have been found.

Discussion
We hypothesised that variation in the follicle pool may be a cause for variation in birth weight. In order to test this, sows were selected based on their EBV for variation in birth weight to apply a contrast in expected phenotypical variation in birth weight and to correlate this to variation in follicular development. We therefore have explored variation in follicular development in the follicle pool at weaning as from this antral follicle pool follicles will be recruited for ovulation to give rise to the next litter. This recruitment is due to the weaning associated change in pulsatile gonadotropin releasing hormone and LH patterns: these patterns change from a low frequency and high amplitude pattern to a high frequency and low amplitude pattern while FSH levels increase (Shaw and Foxcroft, Reference Shaw and Foxcroft1985). Since it has been reported that the antral follicle pool is very heterogeneous regarding size and biochemical status in sows at 48 h after weaning (Foxcroft et al., Reference Foxcroft, Shaw, Hunter, Booth and Lancaster1987), it is very well possible that variation in birth weight is caused by variation in the follicle pool at weaning.
The results of the present study do not support this assumption, as no relations could be found between (variation in) follicular development at weaning and EBV for variation in birth weight. One explanation for this unexpected finding may be that the contrast in EBV for variation in birth weight that we were able to obtain in this study or the heritability of the trait variation in birth weight (mean h 2=0.08; Bidanel, Reference Bidanel2011) might be too small to detect phenotypic differences with the present sample size (N=14 and N=15 for High-EBV and Low-EBV, respectively). In addition, the repeatability of the trait variation in birth weight might be too low to relate the sows’ previous performance in variation in birth weight to variation in follicular development of the follicle pool that will give rise to the next litter. Generally low repeatability’s for variation in piglet birth weight are found in literature (0.14, Quesnel et al., Reference Quesnel, Brossard, Valancogne and Quiniou2008), although for the genetics used higher repeatability’s (0.19) are seen (E.G.Knol, Personal communication). Furthermore, we were able to obtain a difference between High-EBV and Low-EBV of 40.5 g (15.8±1.6 v.−24.7±1.5), whereas the average EBV of all the sows on the nucleus farm was −6.3±17.1. In addition, no linear relations between EBV for variation in birth weight and follicular and metabolic parameters could be found which confirms that EBV for variation in birth weight was not related with any of the measured parameters.
Another explanation could be that variation in birth weight is not related to variation in the follicle pool at weaning but is related with variation in follicular development later in the follicular phase after recruitment.
Following recruitment, follicles are either selected to ovulate or degenerate; indeed several studies have shown that many small and medium-sized antral follicles become atretic (reviewed by Guthrie, Reference Guthrie2005). It is therefore likely that some of the follicles that we have studied at weaning will become atretic in a later stage, will not ovulate and will therefore not be related to the EBV for variation in birth weights. Support for the assumption that follicular development after weaning may be an important phase in determining variation in birth weights comes from a study by van den Brand et al. (Reference Van den Brand, Soede and Kemp2006) which show that feeding insulin-stimulating diets in the post-weaning period can reduce variation in birth weights. On the other hand, Wientjes et al. (Reference Wientjes, Soede, Knol, Van den Brand and Kemp2013) show that more BW and backfat loss during lactation is related to more variation in birth weight of the subsequent litter, which indicates that variation in birth weight could also originate from follicular development during lactation.
These studies both indicate that sow metabolic status during and immediately after lactation can affect follicular development. Indeed, we observed phenotypic relations between the metabolic state and follicular development at weaning.
More BW loss during lactation was related to lower plasma IGF1 levels and higher creatinine levels at weaning. This is expected since insulin and IGF1 are usually suppressed in catabolic states (Quesnel et al., Reference Quesnel, Pasquier, Mounier, Louveau and Prunier1998b; van den Brand et al., Reference Van den Brand, Prunier, Soede and Kemp2001), whereas creatinine levels are higher when sows lose more weight due to restricted feeding (Baidoo et al., Reference Baidoo, Aherne, Kirkwood and Foxcroft1992) or when they receive less lysine in their diet (Yang et al., Reference Yang, Heo, Jin, Yun, Choi, Yoon, Park, Yang and Chae2009). Unexpectedly, we did not find any relations between weight loss during lactation and insulin levels at weaning.
We also find that a larger BW loss during lactation is related to a lower percentage healthy COCs. This corroborates findings by Zak et al. (Reference Zak, Xu, Hardin and Foxcroft1997), who reported decreased maturation rates of oocytes isolated 38 h before the anticipated onset of oestrus in primiparous sows that were feed restricted from days 21 to 28 of lactation compared with sows that were fed ad libitum from days 21 to 28.
We do not observe relations between BW loss and follicle size. This is in contrast to a study by Quesnel et al. (Reference Quesnel, Pasquier, Mounier and Prunier1998a) who found that feed restriction during a 28-day-lactation period (50% ad libitum v. ad libitum) resulted in smaller follicles at weaning in primiparous sows. Similar to our study, these investigators did not observe effects of feed restriction on follicular atresia.
Body weight loss consists of loss of fat mass or loss of lean mass. In general, sows lose around fivefold more kilograms of fat during lactation compared with protein (Bergsma et al., Reference Bergsma, Kanis, Verstegen, van der Peet–Schwering and Knol2009). As sows lose both fat and protein simultaneously, it is difficult to establish which of the two is responsible for the negative effects of weight loss during lactation on follicular development. Some studies suggest that especially protein loss during lactation is detrimental for follicular development. In a study by Clowes et al. (Reference Clowes, Aherne, Foxcroft and Baracos2003a) first-parity sows were fed either 50, 35 or 24 g of lysine/day during a 23-day-lactation period. The sows lost approximately 7%, 9% and 16% of the calculated body protein mass, whereas no differences in backfat loss were found. When the eight largest follicles of both ovaries were analysed, it was found that sows which lost more protein during lactation had a lower percentage follicles larger than 4 mm at weaning (23.6% v. 55.4% for high v. low protein loss) and follicles contained less follicular fluid (32 v. 68 µl, respectively) with lower concentrations of estradiol and IGF1. In addition, the follicular fluid of protein-restricted sows reduced oocyte maturation in vitro. Yang et al. (Reference Yang, Foxcroft, Pettigrew, Johnston, Shurson, Costa and Zak2000) found similar results to Clowes et al. (Reference Clowes, Aherne, Foxcroft and Baracos2003a) when analysing the 15 largest pre-ovulatory follicles at pro-oestrus in primiparous sows. Moreover, the severity of the effects of lysine restriction on follicle size and follicular fluid content is larger for sows with a lower calculated protein mass at parturition (Clowes et al., Reference Clowes, Aherne, Schaefer, Foxcroft and Baracos2003b). In line with these studies, we find that increased creatinine levels, which can be considered a marker for protein loss (Yang et al., Reference Yang, Heo, Jin, Yun, Choi, Yoon, Park, Yang and Chae2009), are related to a lower average follicle size of the 15 largest follicles at weaning. This indicates that increased protein loss during lactation has a negative effect on follicle size at weaning. We found no relation between urea levels, which is a marker for protein turnover, and follicle size.
In our study, the amount of fat loss during lactation was estimated by measuring backfat thickness after parturition and at weaning. Higher backfat loss during lactation is related to a higher backfat thickness at parturition. In addition, higher backfat loss is related to higher serum NEFA levels at weaning which, when measured in a fasted state as has been done in our study, is a marker for lipid mobilisation (Lafontan and Langin, Reference Lafontan and Langin2009). Together these findings suggest that the sows, which had more backfat at parturition, mobilised more lipid during lactation. Unexpectedly, in our study, no relations between the amount of backfat and leptin levels at weaning are found, in contrast to the findings of a study by De Rensis et al. (Reference De Rensis, Gherpelli, Superchi and Kirkwood2005).
In order to further elucidate relations between backfat loss during lactation, NEFA levels and follicular development at weaning, we measured FGF21, a hormone-like circulating protein recently identified as a metabolic regulator of glucose and lipid metabolism (reviewed by Fisher and Maratos-Flier, Reference Fisher and Maratos-Flier2016). We observe a tendency towards higher FGF21 levels in Low-EBV sows compared with High-EBV (P=0.06). However, no relations between FGF21 and any of the other measured metabolic or follicular measurements can be found. More studies need to be performed to elucidate possible relations between FGF21 and follicular development.
As mentioned previously, it is not known to which extent negative effects of energy mobilisation during lactation on follicular development, can be attributed to either protein or fat loss, since studies investigating effects of feed restriction on follicular development report a simultaneous loss of fat mass and lean mass. Most studies find that weight loss and backfat loss of sows during lactation, so the simultaneous loss of lean and fat mass, is related to a smaller follicle size (Zak et al., Reference Zak, Xu, Hardin and Foxcroft1997; Quesnel et al., Reference Quesnel, Pasquier, Mounier and Prunier1998a, respectively). Surprisingly, in our study, more backfat loss during lactation is related to a higher average size of the 15 largest follicles and higher average size of the 10 largest healthy follicles at weaning. In addition, higher serum NEFA levels at weaning tended to be related to a higher average follicle size at weaning. Together, these findings suggest that increased lipid mobilisation during lactation is related to an increased follicle size.
One hypothesis for these surprising findings could be that sows which have low levels of backfat at parturition mobilise less backfat during lactation to fulfil the energy requirements of milk production and therefore have to use their protein reserves, which might have a detrimental effect on follicular development. Indeed, in our study, lower backfat loss during lactation was related to higher creatinine levels at weaning and high creatinine levels were related to a smaller follicle size at weaning. So the relation between increased backfat loss during lactation and a larger average follicle size at weaning might be explained by protein sparing effects. It may be worthwhile to study relations between energy mobilisation of different energy substrates during lactation and follicular development using reliable measurements of lean mass and fat mobilisation, such as balance trials and body composition measurements.
To conclude, in this study, follicular development at weaning appeared to be similar for sows with a High- v. Low-EBV for variation in birth weight. It is possible that variation in birth weights is (partly) explained by variation in the follicle pool at weaning, but this is not reflected in EBV. Another possibility is that variation in birth weight is explained by follicle development at a later time point during the follicular phase or by other factors which play a role after ovulation. Our study does show that energy mobilisation from different sources during lactation, adipose tissues or muscle reflecting fat or lean mass, respectively, could have divergent effects on follicular development at weaning. These relations need to be further elucidated.
Acknowledgements
The authors acknowledge the Wageningen Institute for Animal Sciences (WIAS) and NWO for providing the NWO-WIAS Graduate Programme 2015 grant. The authors are grateful to Quirijn Dees, MSc, for helping with the measurements during his MSc thesis.
Declaration of interest
The authors declare that there is no conflicts of interest that could be perceived as prejudicing the impartiality of the results reported.
Ethics statement
The experiment was approved by the Animal Care and Use Committee of Wageningen University (DEC2016036) and performed according to National and EU Guidelines.
Software and data repository resources
None of the data were deposited in an official repository.
Supplementary material
To view supplementary material for this article, please visit https://doi.org/10.1017/S1751731118001684