Introduction
Long-term changes in the morphological characteristics of a population, occurring gradually from generation to generation and progressing in a constant direction, despite possible short-term fluctuations, are most often described as intergenerational changes, transformation trends (Wolański, Reference Wolański1979) or secular trends (Tanner, Reference Tanner1966). They are most fully documented with basic morphological traits such as body height and weight, and pubescence as determined by the age of consecutive stages of pubic hair and breast development, as well as age at menarche in girls. The secular trend in body height and weight of young people in Poland has been studied in Warsaw (Charzewska et al., Reference Charzewska, Chabrom, Rogalska-Niedźwiedź, Górowska and Wilczewski1991; Łaska-Mierzejewska & Olszewska, Reference Łaska-Mierzejewska and Olszewska2007), Wroclaw (Ignasiak & Sławińska, Reference Ignasiak and Sławińska1993), Poznan (Osiński, Reference Osiński1989) and Lodz (Stolarczyk et al., Reference Stolarczyk, Malinowski, Lorkiewicz and Jopkiewicz1997). The study of these secular trends, and also of the prevalence of overweight and obesity, was initiated in Krakow by Chrzanowska et al. (Reference Chrzanowska, Gołąb, Bocheńska and Panek1988, Reference Chrzanowska, Gołąb, Żarów, Sobiecki and Brudecki2002, Reference Chrzanowska, Koziel and Ulijaszek2007). However, none of the above studies carried out detailed analysis of body composition. This study is the first in Poland to focus on changes in the body composition of children living in Krakow over the last three decades.
The health-threatening phenomenon of improper or excessive accumulation of fat in fat tissues is a recent observation (Donohoe et al., Reference Donohoe, Doyle and Reynolds2011). It most often results from poor nutrition (Willett & Leibel, Reference Willett and Leibel2002), an increase in the consumption of energy-dense foods and a decrease in physical activity and the adoption of a more sedentary lifestyle (Carvalhal et al., Reference Carvalhal, Padez, Moreira and Rosado2006; Doak et al., Reference Doak, Visscher, Renders and Seidell2006). The accumulation of fat leads to overweight and obesity, which can cause medical, economic and psychosocial problems (Chu, Reference Chu2001) for both adults and children (Yücel et al., Reference Yücel, Kinik and Aka2011). Research shows that this is becoming a problem for populations in an ever greater number of countries (Vignerová et al., Reference Vignerová, Humeníkowá, Paulová and Riedlowá2008) – not only developed, but also developing ones (Silva et al., Reference Silva, Pelegrini, de Lima, Silva and Petroski2011). However, in some countries a stabilization of rates of childhood overweight and obesity has been observed (Aeberli et al., Reference Aeberli, Henschen, Molinari and Zimmermann2010; Olds et al., Reference Olds, Tomkinson, Ferrar and Maher2010). This could be the result of prevention programmes and/or an increase in public awareness of the problem (Aeberli et al., Reference Aeberli, Ammann, Knabenhans, Molinari and Zimmermann2009). Also, research carried out in the countries of the former Eastern bloc suggests that overweight and obesity is occurring more and more often – and unfortunately in children of younger and younger ages (see Zellner et al. (Reference Zellner, Ulbricht and Kromeyer-Hauschild2007) in East Germany; Vignerová et al. (Reference Vignerová, Humeníkowá, Paulová and Riedlowá2008) in the Czech Republic; or Jahns et al. (Reference Jahns, Baturin and Popkin2003) in Russia). However, the problem should be assessed with due caution.
A preferred criterion for determining overweight or obesity in an individual is their weight–height ratio expressed as the body mass index (BMI). However, this has some limitations (Peltz, Reference Peltz, Aguirre, Sanderson and Fadden2010), especially when assessing obesity in children. Indeed, it informs us about excessive body weight in relation to body height, but not about excessive body fat (Kolle et al., Reference Kolle, Steene-Johannessen, Holme, Andersen and Anderssen2009), and that is why the values of this ratio correlate both with body fat and fat-free mass (McCarthy & Ashwell, Reference McCarthy and Ashwell2006). It has been found that the body can accumulate fat without a change in BMI, since an increase in body fat mass may occur at the expense of lean body mass (Kolle et al., Reference Kolle, Steene-Johannessen, Holme, Andersen and Anderssen2009). Thus the analysis of body composition by means of BMI is not justified (Gerver & de Bruin, Reference Gerver and de Bruin1996; Kolle et al., Reference Kolle, Steene-Johannessen, Holme, Andersen and Anderssen2009). It should also be noted that BMI values give no indication of the distribution of fat tissue (McCarthy & Ashwell, Reference McCarthy and Ashwell2006), which is significant because abdominal obesity appears to be the most dangerous in terms of health complications (Kolle et al., Reference Kolle, Steene-Johannessen, Holme, Andersen and Anderssen2009).
Hence many researchers advocate the use of a simple skinfold measurement as a more reliable way of analysing the level and distribution of body fat (Kolle et al., Reference Kolle, Steene-Johannessen, Holme, Andersen and Anderssen2009; Kurtoglu et al., Reference Kurtoglu, Mazicioglu, Ozturk, Hatipoglu, Cicek and Ustunbas2010), and the preventive monitoring of the BMI trend is not justified (Kolle et al., Reference Kolle, Steene-Johannessen, Holme, Andersen and Anderssen2009).
An increasing occurrence of overweight and obesity has also been noted in Poland's neighbouring countries, which underwent a similar transformation to Poland in the late 20th century (Jahns et al., Reference Jahns, Baturin and Popkin2003; Zellner et al., Reference Zellner, Ulbricht and Kromeyer-Hauschild2007; Vignerová et al., Reference Vignerová, Humeníkowá, Paulová and Riedlowá2008; Godina, Reference Godina2011).
Therefore, this survey aimed to find out whether contemporary children and adolescents of Krakow, in comparison with their peers measured 10 and 30 years ago, have different mean adiposity, body bone and muscle mass and BMI values, and also to assess how overweight and obesity frequencies have developed over the period.
Methods
The samples analysed in the present study were included in three cross-sectional surveys conducted in randomly selected kindergartens and primary and secondary schools in Krakow in 1983, 2000 and 2010. The 1983 and 2000 surveys were part of the scientific project The Child of Cracow (Chrzanowska et al., Reference Chrzanowska, Gołąb, Bocheńska and Panek1988, Reference Chrzanowska, Gołąb, Żarów, Sobiecki and Brudecki2002). The cohort was a representation of each of the four traditional residential districts of Krakow. The age range of the survey was 3–20 years, and the analysis comprised only males aged 3.5–18.5 years. Age brackets were determined taking into consideration the year of birth, e.g. the group of 3.5-year-olds included boys aged 3.00–3.99, etc. The data from the contemporary (2010) survey series were compared with the results from the previous survey series in 1983 (1934 males) and in 2000 (2323 males). The newest (2010) sample size was 1863 males. The 2010 examinations were conducted according to the procedures in force, i.e. with the consent of the Bioethics Committee at the Regional Medical Association in Krakow (No. 26/KBL/OIL/2007), and the consent of the children's parents or legal guardians.
All the anthropometric measurements were performed by well-trained anthropometrists (research workers from the Department of Anthropology, University School of Physical Education in Krakow), following previously published methods (Martin & Saller, Reference Martin and Saller1957). Body weight was measured with the subjects wearing only their underwear and without shoes using a Tanita BC-418 (Japan), to the nearest 0.1 kg. Body height was measured, without shoes, to the nearest 1 mm using an anthropometer (Switzerland). Using these measurements BMI was calculated as weight/height2 (kg/m2). In all cohorts skinfold thickness was measured using a Harpenden skinfold caliper (Switzerland) with a constant spring pressure of 10 g/mm2 on the right side of the body. Only subscapular, suprailiac, abdominal and triceps skinfolds were used in this analysis. As an indicator of fatness the sum of these four skinfolds was used (Kolle et al., Reference Kolle, Steene-Johannessen, Holme, Andersen and Anderssen2009; Kagawa et al., Reference Kagawa, Uenishi, Mori, Uchida, Kerr, Binns and Hills2010; Freitas et al., Reference Freitas, Beunen, Maia, Claessens, Thomis, Marques, Gouveia and Lefevre2012). The epiphysis width was measured by means of a spreading caliper (Switzerland). Bone mass was calculated only for the children surveyed in 2000 and 2010, since in the children surveyed in 1983 the width of the epiphysis was not measured. Bone mass was calculated using the Von Döbeln equation (Reference Von Döbeln and Blix1964), modified by Rocha (Reference Rocha1975):

, where E is height (m), R is wrist breadth (m) and F is femur breadth (m). A tape-measure was used to measure the arm circumference, and the mid-arm circumference (cm) and triceps skinfold measurement (mm) were used to calculate corrected arm muscle area (CAMA). Total body muscle mass (kg) was calculated from CAMA using a prediction equation that relates CAMA and height to muscle mass (Heymsfield et al., Reference Heymsfield, McManus, Smith, Stevens and Nixon1982):

, where TSF is the triceps skinfold thicknesses, MAC is the mid-arm circumference (cm) and the term 10 refers to the correction for bone area in males.

, where H is the height (cm). Child height and weight measurements were used to calculate BMI (kg/m2). The International Obesity Task Force (IOTF) curves were developed by Cole et al. (Reference Cole, Bellizzi, Flegal and Dietz2000) in an effort to produce an international reference standard by compiling data from six heterogenous countries. In this approach the 85th and the 95th percentiles of the sex-specific BMI for age curves were projecting through the adult BMI cut-off points for overweight (25 kg/m2) and obesity (30 kg/m2) at the age of 18 years (Cole et al., Reference Cole, Bellizzi, Flegal and Dietz2000).
Skinfold thickness is distinguished by a skewed distribution, so direct data were expressed on a logarithmic scale and the sizes of individual skinfolds for each of the survey series were presented as graphs with standard errors. The analysis of differences between individual cohorts was made by means of one-way analysis of variance (ANOVA) and the Tukey test. In the case of differences in bone mass, Student's t-test was employed.
Fatness, muscle mass and BMI in the boys were compared between the three study series: 1983 (A series), 2000 (B series) and 2010 (C series). Changes in bone mass were observed only between 2000 and 2010 (C-B).
In order to determine the overweight and obesity trend, the series from 2000 was compared with that from 1983 (B-A) and the series from 2010 was compared with that from 2000 (C-B). The significance of differences was assessed by χ 2 test.
All the statistical analyses were made using the Statistica 8.0 software.
Results
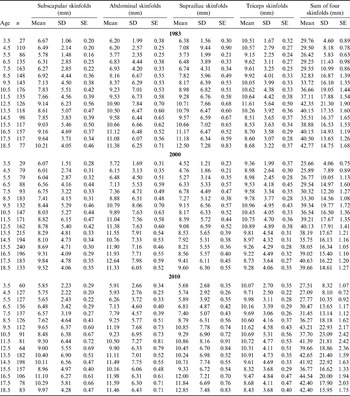
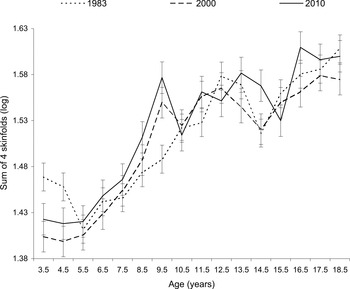
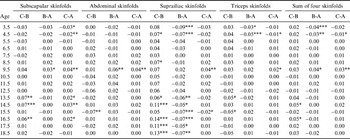
Of the three groups of surveyed Krakow subjects, the highest total fatness, measured by the sum of four skinfold thicknesses in the pre-school period (age 3.5–6.5 years), was found in the children surveyed in 1983, whereas the lowest was found in the children measured in 2000 (Table 1). Statistically significant differences were found between the 3.5- and 4.5-year-olds measured in 1983 and 2000, and between the 4.5-year-olds measured in 1983 and 2010. In a consecutive stage of ontogenetic development the level of adiposity increased in all the series surveyed, and the highest adiposity appeared in the series from 2010. At about the age of 18.5, the male subjects surveyed presently and 30 years ago were characterized by a similar fatness, and the lowest adiposity was found in the series from 2000. The differences between the boys measured in 2010 and the remaining survey series were statistically insignificant, except for the 14.5- and 16.5-year-olds (Table 3; Fig. 1).
Descriptive statistics of four skinfolds and their sum for Krakow boys, 1983, 2000 and 2010

Mean (logarithmically transformed) and SE of sum of four skinfolds for Krakow boys, 1983, 2000 and 2010.

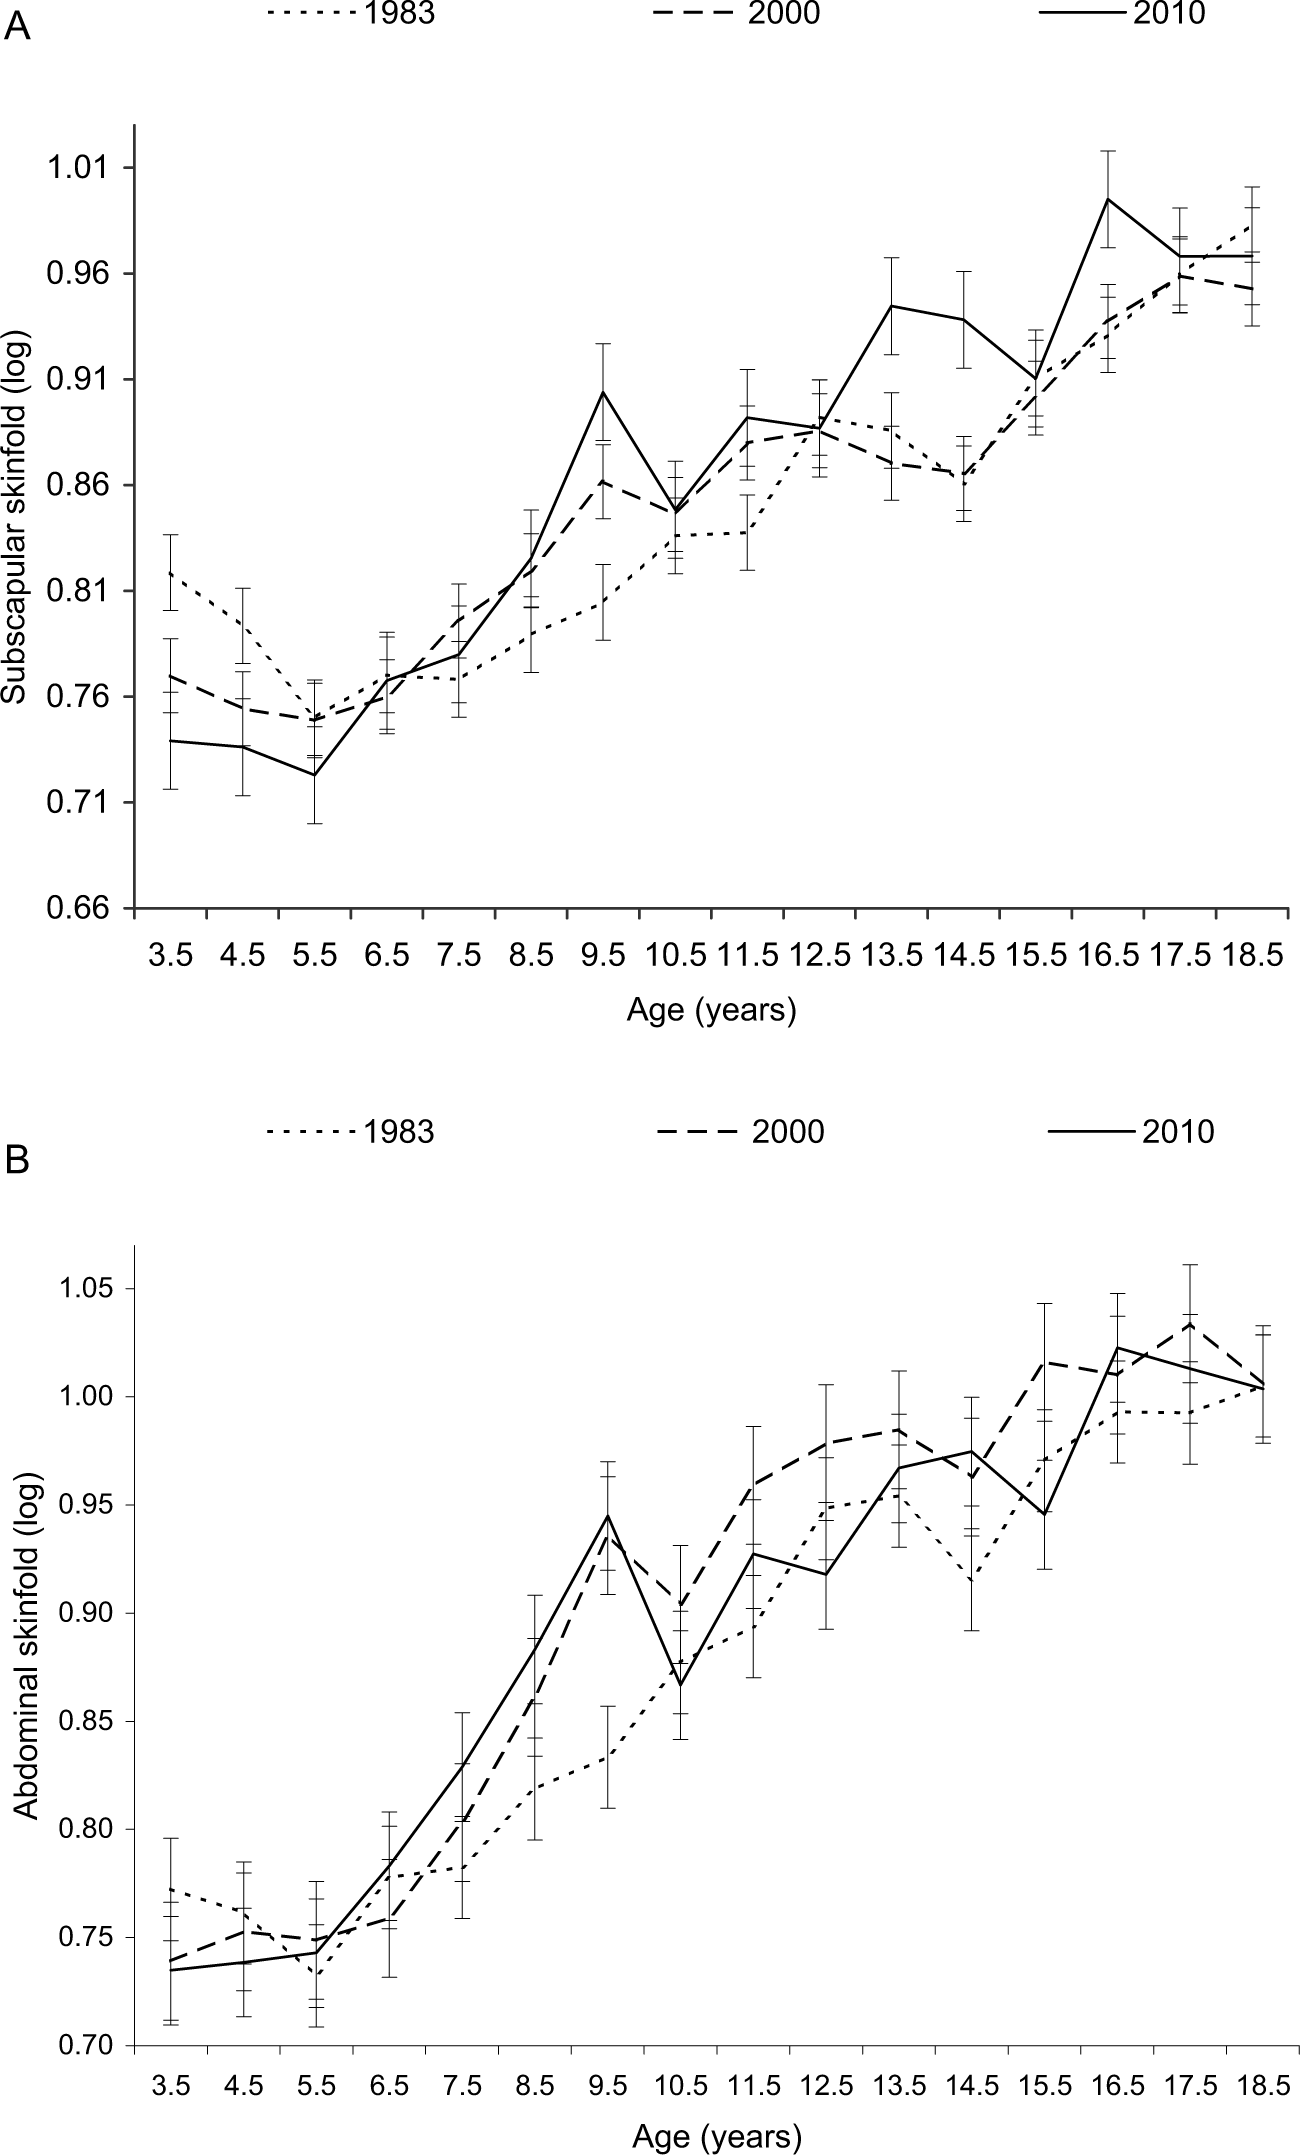
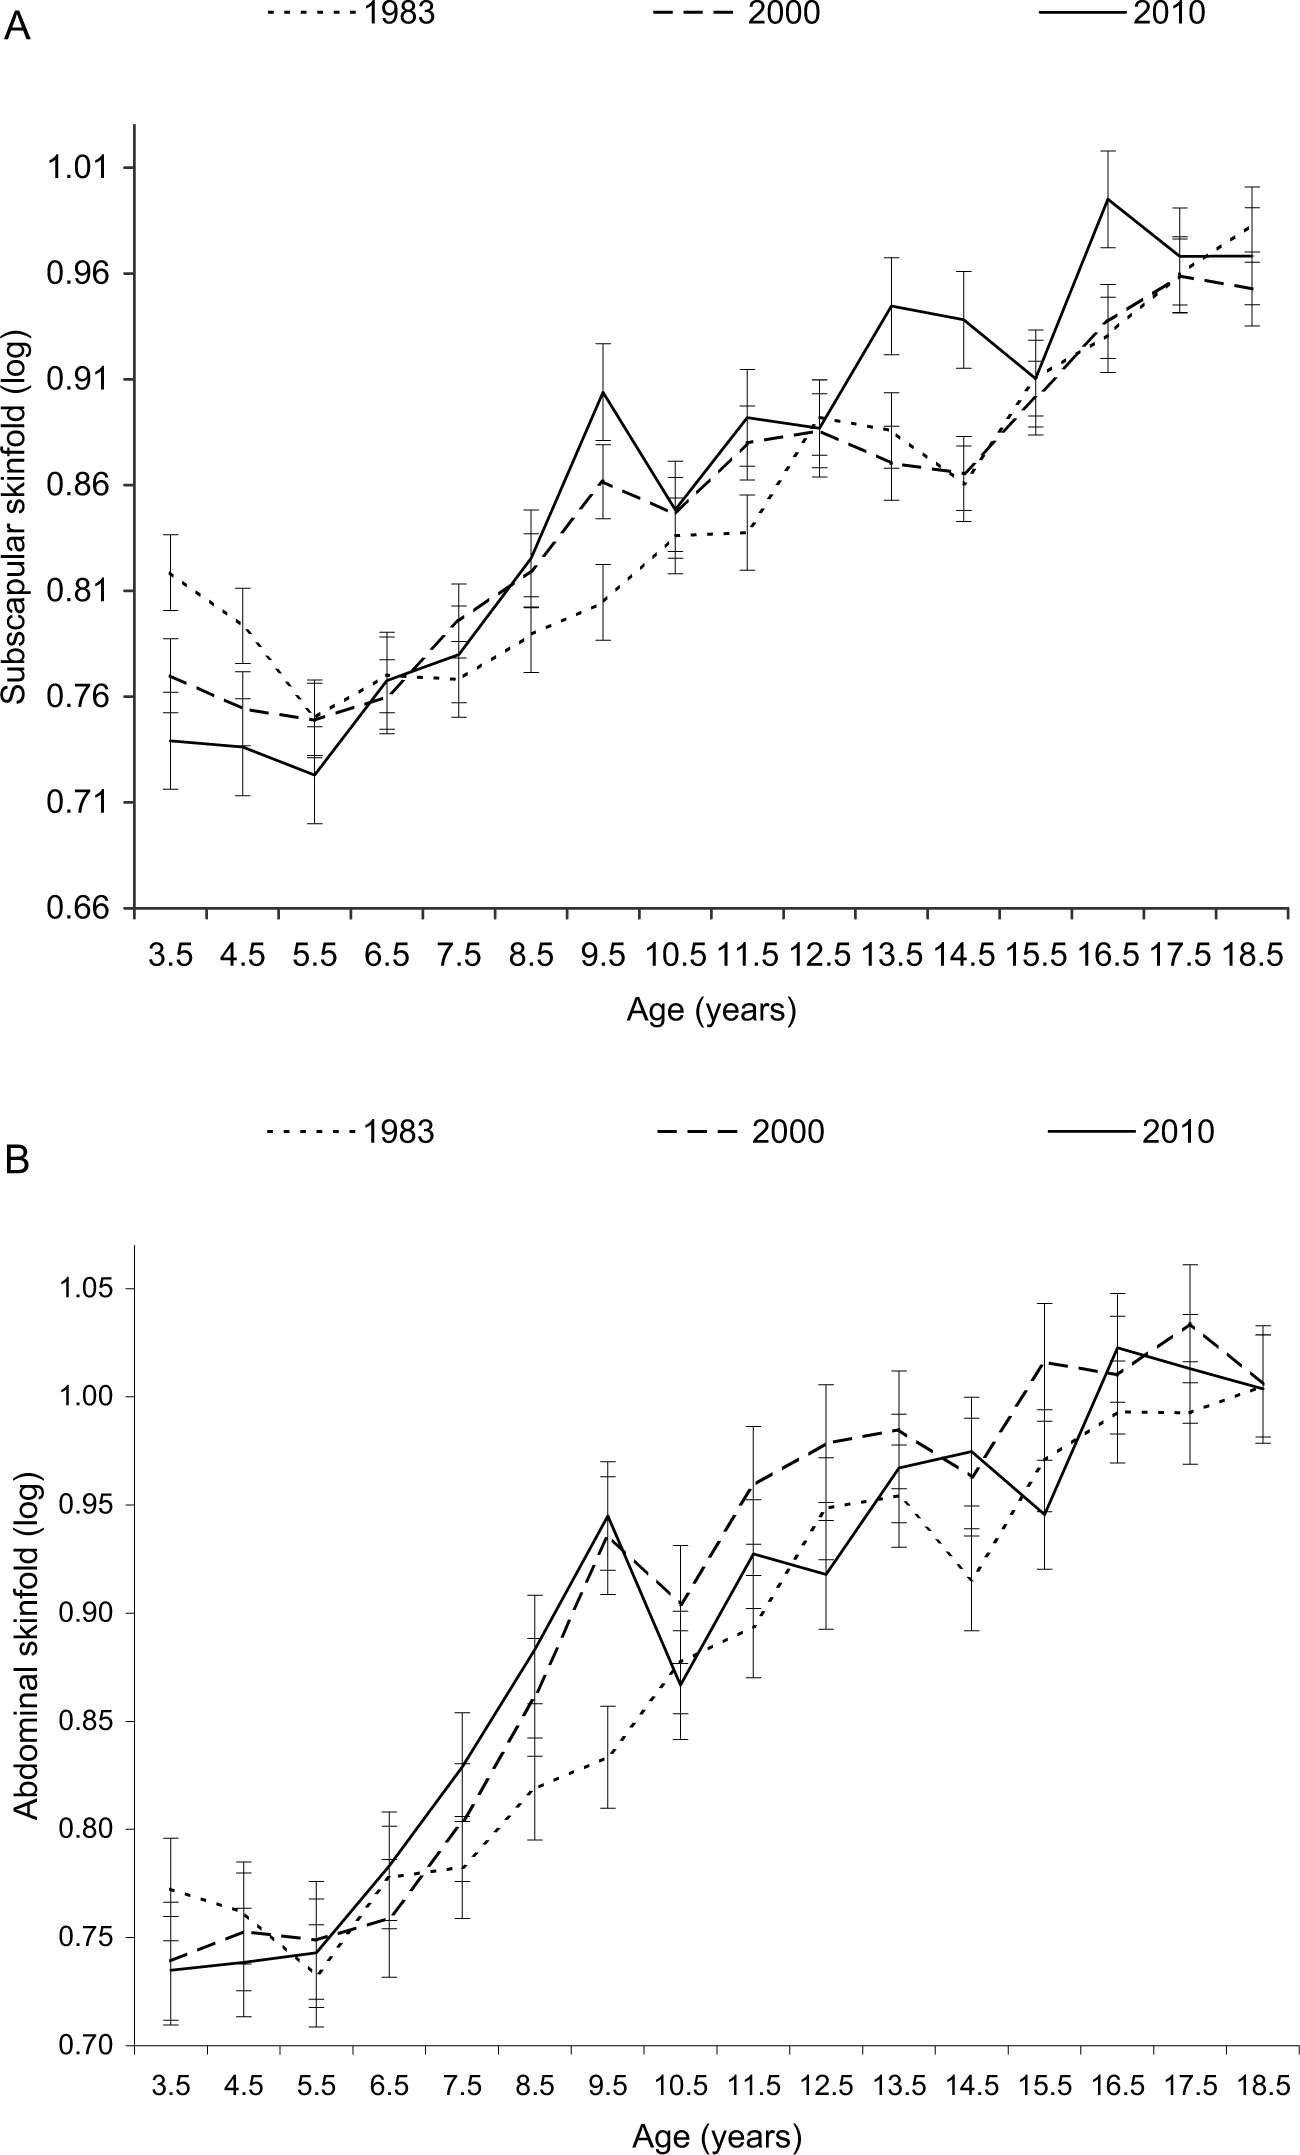
The analysis of body fat distribution showed that the boys surveyed in the latest series had lower subscapular adiposity at pre-school age than their peers measured 10 and 30 years ago. Statistically significant differences were found in the 3.5- and 4.5-year-olds measured now and in 1983. The children surveyed presently, at the age of 7, were fatter on the scapula than their peers from previous survey series, and that tendency remained until the end of the survey period, i.e. until age 18.5 years. Statistically significant differences were noted between the boys measured presently and those measured 30 and 10 years ago only in some age categories (Table 3; Fig. 2A).
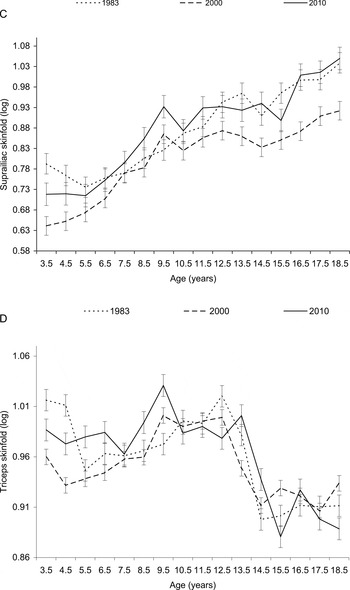
Mean (logarithmically transformed) and SE of subscapular (A), abdominal (B), suprailiac (C) and triceps (D) skinfolds for Krakow boys, 1983, 2000 and 2010.
Continued

At the beginning of the measurement period (age 3.5–6.5 years) there were no greater differences in the size of abdominal skinfolds between the series of subjects (Table 1). In a following developmental stage, the children from the cohorts from 2000 and 2010 had, on average, higher abdominal adiposity than their peers measured 30 years ago. However, the highest adiposity appeared in the case of the 2000 series (Table 3; Fig. 2B). The boys measured 10 years ago had the lowest suprailiac adiposity, while in the case of contemporary boys and those measured 30 years ago their adiposities were almost identical, but slightly higher in the latest survey series in most of the older age groups of children (Table 3; Fig. 2C). Fat in the limbs measured by the triceps skinfold thickness in the case of 3.5- and 4.5-year-old contemporary subjects was lower than in the boys measured 30 years ago and greater than in the boys measured a decade ago. At the age of 6.5–13.5 years, in almost all groups, boys measured in 2010 had a larger amount of fat in the limbs as compared with their peers from the groups surveyed earlier. Statistically significant differences between the contemporary group of subjects and their peers from earlier survey series occurred sporadically (Table 3; Fig. 2D).
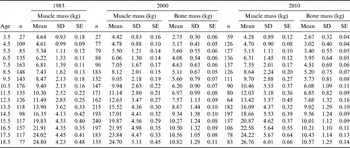
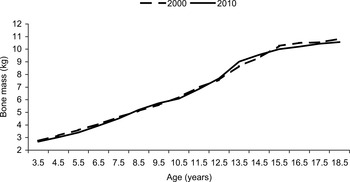
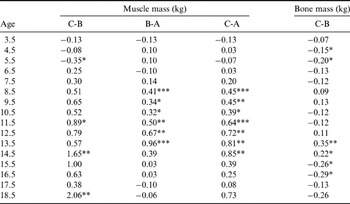
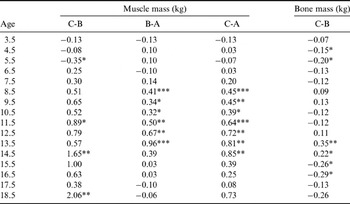
In the analysis of total bone mass (Table 2; Fig. 3) it was seen that boys aged 3.5–12.5 measured presently and those measured 10 years ago showed almost identical values of that trait. At the age of 12.5 the boys from the latest survey series had higher bone mass, but after the age of 15.5 a reverse phenomenon occurred, namely that those from 2000 had a higher bone mass (Table 4).
Descriptive statistics of muscle mass and bone mass of Krakow boys, 1983, 2000 and 2010

Differences between means (logarithmically transformed) of four skinfolds and their sum (per decade) for Krakow boys between 1983 and 2010 (C-A), 1983 and 2000 (B-A) and 2000 and 2010 (C-B)

*p<0.05; **p<0.01; ***p<0.001.
Mean bone mass for Krakow boys, 2000 and 2010.

Differences between means (logarithmically transformed) of muscle mass and bone mass (per decade) for Krakow boys between 1983 and 2010 (C-A), 1983 and 2000 (B-A) and 2000 and 2010 (C-B)
*p<0.05; **p<0.01; ***p<0.001.
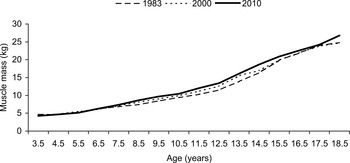
In the pre-school period, the boys measured in all three series had a similar muscle mass (Table 2; Fig. 4). At the age of 6.5 years until the end of the survey period the subjects from 2010 dominated their peers from the remaining cohorts in the case of muscle mass (Table 4).
Mean muscle mass for Krakow boys, 1983, 2000 and 2010.

Boys surveyed presently had higher adiposity, lower bone mass and higher muscle mass then their peers measured 10 or 30 years ago.
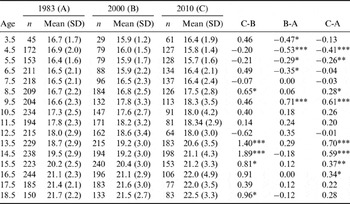
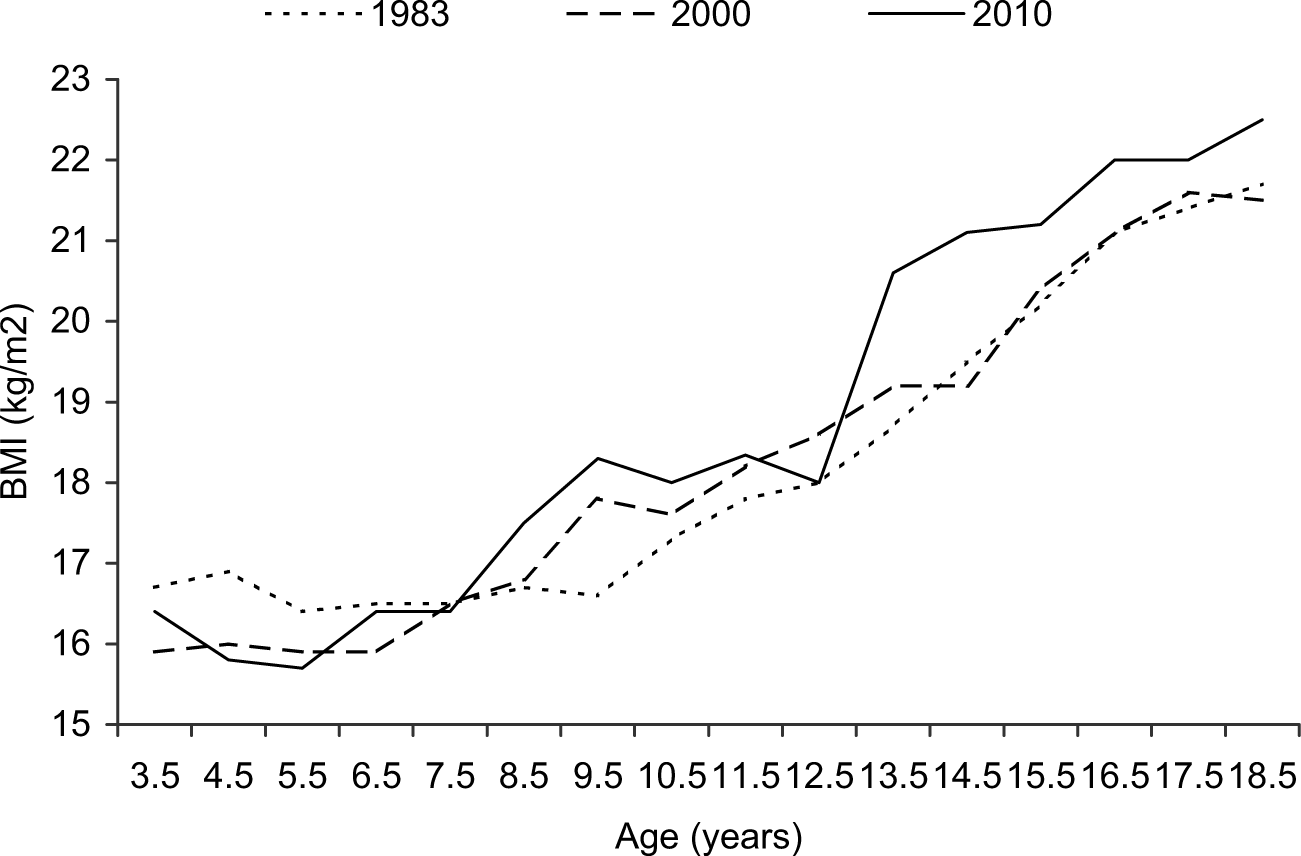
On the basis of the BMI values (Table 5; Fig. 5) it was found that in the pre-school period the subjects measured in 2010, like their peers measured 10 years earlier, were slimmer than the boys measured in 1983, and there were statistically significant differences between the oldest and the youngest series in the categories of 4.5- and 5.5-year-olds. However, at the age of 7.5 children became slightly heavier than those in previous cohorts, and that trend, except for the 12.5-year-olds, was maintained until late adolescence. Statistically significant differences between the boys measured presently and those in previous cohorts were seen at the ages of 8.5 and 9.5, and also in early adolescence (13.5–15.5 years).
Means and standard deviations (SD) of BMI for Krakow boys in three successive cohorts and differences (per decade) between mean value between 1983 and 2010 (C-A), 1983 and 2000 (B-A) and 2000 and 2010 (C-B)

*p<0.05; **p<0.01; ***p<0.001.
Mean BMI for Krakow boys, 1983, 2000 and 2010.
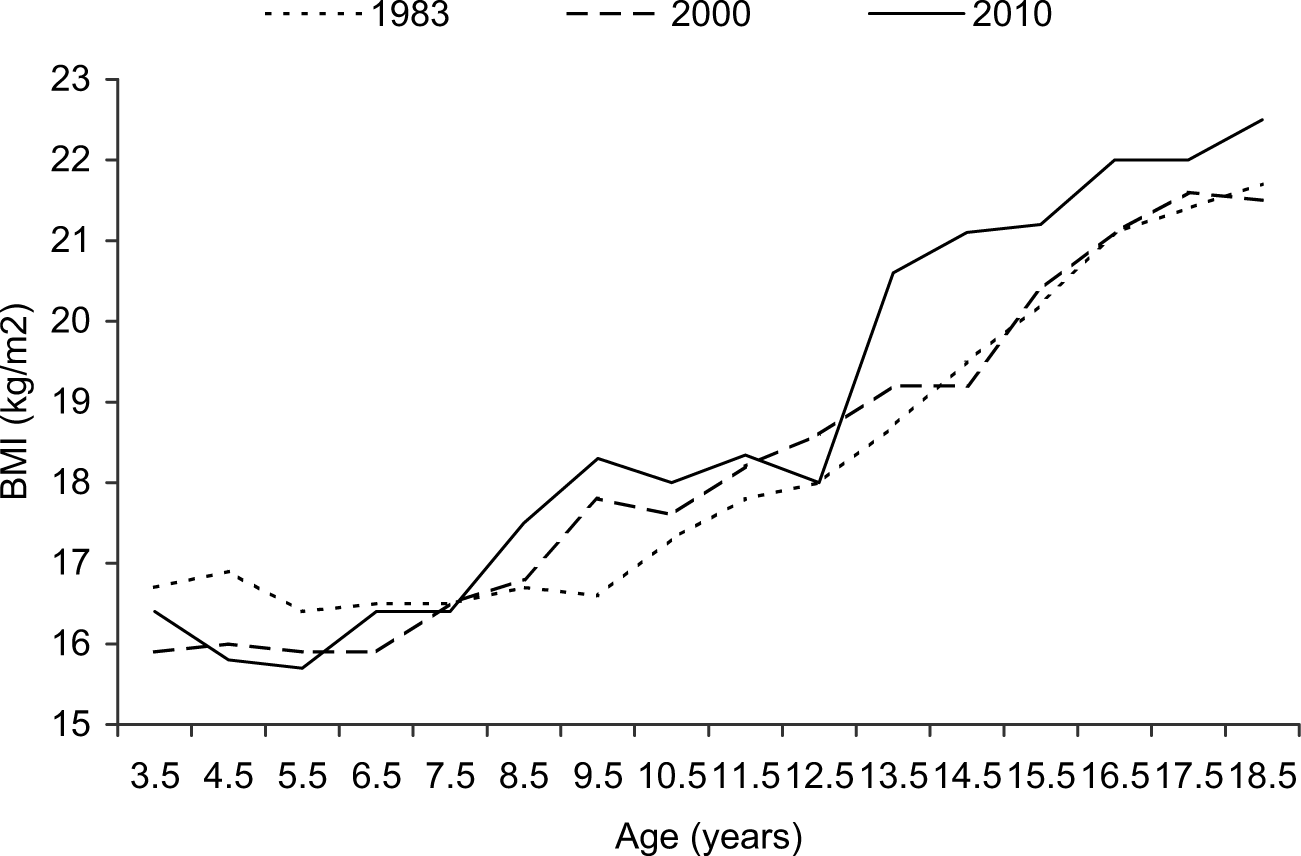
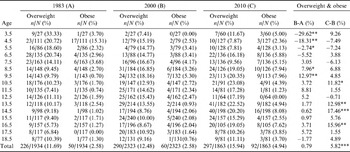
Table 6 presents the frequency of overweight and obesity in individual age groups for the three survey series analysed. The group surveyed in the last series, in comparison with previous groups, showed a slight increase in overweight and almost two-fold increase in obesity frequency. The results show that in 2000, in comparison with 1983, the frequency of overweight and obesity was smaller in pre-school children, whereas it increased in children older than 7.5 years. Comparing the group of children surveyed in the last series with the subjects measured 10 years ago, it can be seen that the problem of overweight and obesity affected children from younger and younger age groups (3.5 and 6.5). On dividing the surveyed population into childhood periods (until the age of 12.5), early adolescence (12.5–15.5 years) and late adolescence (16.5–18.5 years), it was found that in 2000, as compared with 1983, the frequency of overweight and obesity decreased in childhood (−1.45%), but increased in early (1.12%) and late adolescence (2.55%). A similar comparison of the group surveyed presently with the group surveyed a decade earlier showed that the frequency of overweight and obesity increased in all the distinguished groups, i.e. in childhood by 1.67%, in early adolescence by 12.1% and in late adolescence by 7.45%.
Prevalences of overweight and obesitya in Krakow boys in three subsequent cohorts by age, and changes in prevalences (percentage points) of overweight and obesity between 1983 and 2000 (B-A) and 2000 and 2010 (C-A)

a Estimated using IOTF criteria (Cole et al., Reference Cole, Bellizzi, Flegal and Dietz2000).
*p<0.05; **p<0.01; ***p<0.001.
Discussion
The survey results show that presently surveyed boys had greater total body adiposity than their peers surveyed 10 years ago. The analysis of fat distribution shows that the children from the last survey series, in comparison with those measured in 2000, from the age of 7 had a higher subscapular adiposity, and higher suprailiac adiposity, in the entire age range analysed. The boys from the latest survey series, in comparison with their peers measured 10 years earlier, showed slightly greater abdominal adiposity only in the pre-school period, whereas triceps skinfold thickness was greater in them up until the age of 14.5. Further analysis of body composition shows that contemporary subjects have a higher muscle mass but lower bone mass in comparison with their peers measured a decade ago. Such changes in body composition contribute to the fact that presently surveyed boys have a higher mean BMI. What is more – as compared with the previous cohorts – an increase in the frequency of overweight and obesity was seen in the present survey series.
The body fatness findings are similar to worldwide trends. Research carried out in 30 developed countries (Olds, Reference Olds2009), in groups of children aged 0–18 years, found the 1951–2003 increase in subscapular and triceps skinfold thicknesses to be 0.04–0.05 mm per decade. They also estimated that the percentage of adipose tissue increased in that period by 0.9% per decade. A similar trend was noticed in Norwegian children between 1971 and 2007 (Júlíusson et al., Reference Júlíusson, Roelants, Eide, Hauspie, Waaler and Bjerknes2007) and in Spain in the period 1985–2000 (Zaragozano et al., Reference Zaragozano, Rodriguez Martinez, Mur De Frenne, Moreno Aznar and Bueno Lozano2000).
The increase in body fatness observed in this study follows the worldwide trend, observed for 25 years, of an increasing frequency of overweight and obesity in younger and younger people (Ariza et al., Reference Ariza, Chen, Binns and Christoffel2004). Over the last 15 years in western Austria the percentage of obese 18-year-olds increased from 9.6% to 13.65% (Schober et al., Reference Schober, Rami, Kirchengast, Waldhar and Sefranek2007) and in Hungary from 1.5% to 8.5% (Mészáros et al., Reference Mészáros, Mészáros, Völgyi, Szica, Polydoros, Prókai and Szmodis2008). Croatia saw no increase in overweight frequency, but an increase in obesity from 4.32 to 6.22% was noted (Bralić et al., Reference Bralić, Tahirović and Matanić2011). The present data show that 35% of school children in the USA are classified as overweight or obese; the figure in Australia is almost 23%, in the Mediterranean countries 27–36%, in Great Britain almost 20% and in Scandinavian countries 15–20% (Kolle et al., Reference Kolle, Steene-Johannessen, Holme, Andersen and Anderssen2009; Loviselli et al., Reference Loviselli, Ghiani, Velluzzi, Piras, Minerba, Vona and Calò2010). Portugal has also seen a considerable increase in the frequency of overweight and obesity over the last three decades, and the current estimate for children is 31.5% (Padez et al., Reference Padez, Fernandes, Mourão, Moreira and Rosado2004). The data from Switzerland are not so alarming, but the problem is becoming more and more common. In the years 1960–65, 3.5% of boys aged 6–12 years were overweight, none (0%) was obese; in 2002 the rate had already reached 16.6% (overweight) and 3.8% (obesity) (Zimmermann et al., Reference Zimmermann, Gübeli, Püntener and Molinari2004). However, a stabilization of childhood overweight and obesity in Switzerland has been observed (Aeberli et al., Reference Aeberli, Henschen, Molinari and Zimmermann2010).
The results of this study point to an increase in obesity in Polish boys over the period 1983–2010. However, the increase is not as large as the worldwide trend. Also, the frequencies of overweight and obesity only increased considerably in the last decade, but the problem has begun to concern younger and younger children. The cause of this could undoubtedly be sought in the transformations that occurred in Poland at the turn of the 20th and 21st centuries. It should be borne in mind that the years 1966–1970 and 1973–1989 (the time when the 1983 and 2000 series subjects were born) were periods of economic slump in Poland. In the latter period, there was a stage (1982–1985) when Polish people had to cope with food rationing (Charzewska, Reference Charzewska, Rogalska-Niedźwiedź, Chojnowska, Chabrom, Woszczyk, Lachowicz, Kaszak and Kozak1995). The end of the 20th century (1990–91) was another period of economic crisis in Poland, caused by the costs sustained during the transformation from a centrally managed to a market economy (Piech, Reference Piech, Piech and Szczodrowski2003). The years 2002–2005 (i.e. the time when the subjects of the last research series were born) saw a return to economic growth. It was a period of intensive preparation for European integration. The period under analysis saw a considerable increase in the gross domestic product (US$1547/person in 1990; US$12,000/person in 2004; www.indexmundi), but a decrease in the price of goods and services (Krakowińska, Reference Krakowińska, Ryć and Dusza2007). The accession of Poland to the EU in 2004 caused the opening of international borders between different member states of the EU and intensive Westernization. Unfortunately, that process also resulted in the acceptance of a Western lifestyle, creating favourable conditions for the development of overweight and obesity: a decrease in physical activity and increase in consumption of highly processed, calorie-rich but nutrient-poor food (Suchocka, Reference Suchocka2003), and increasing frequency of environmental factors that encourage obesity (Tabachii, Reference Tabacchi, Giammanco, La Guardia and Giammanco2007).
Over the last 20 years, many European countries have witnessed a decline in the physical activity of children and adolescents (Molnár & Livingstone, Reference Molnár and Livingstone2000; Rey-Lopez et al., Reference Rey-Lopez, Vicente-Rodríguez, Biosca and Moreno2008), this being especially noticeable in the last decade (Drygas et al., Reference Drygas, Kwaśniewska, Kaleta and Ruszkowska-Majzel2008). Fast industrial and urban and economic development have mainly been responsible for this (Drygas et al., Reference Drygas, Kwaśniewska, Kaleta and Ruszkowska-Majzel2008), as they have brought an increase in the quality of information and communication technology, and easy access to television and digital games (Rey-Lopez et al., Reference Rey-Lopez, Vicente-Rodríguez, Répásy, Mesana, Ruiz and Ortega2011). Access to the internet, digital games and television makes children and adolescents spend more and more time watching television or using computers, unfortunately at the expense of time that could be devoted to physical activity (Shi & Mao, Reference Shi and Mao2010).
Data on time spent watching TV or using computers are alarming. Canadian surveys estimate that pre-school children spend between 1 and 5 hours a day on screen-viewing activites (He et al., Reference He, Irwin, Bouck, Tucker and Pollett2005). Similar data have been obtained in the UK, the USA and France (Molnár & Livingstone, Reference Molnár and Livingstone2000). In Poland, approximately 20% of 2-year-olds spend 3 hours a day in front of a screen, and in the case of 4- to 12-year-old the figure is almost 40% (Drygas et al., Reference Drygas, Kwaśniewska, Kaleta and Ruszkowska-Majzel2008). What is more, analysis of data shows that adolescents spend an average of 4.5 hours per day on sedentary activity (homework, watching TV, video and computer work). More then 30% of 11- to 15-year-old boys spend more than 5 hours per day in this way (Chabros et al., Reference Chabros, Charzewska, Rogalska-Niedźwiedź, Wajszczyk, Chojnowska and Fabiszewska2008). Also, research has found that the only exercise undertaken by most adolescents is during obligatory physical education classes at school (Chabros et al., Reference Chabros, Charzewska, Rogalska-Niedźwiedź, Wajszczyk, Chojnowska and Fabiszewska2008; Mazur & Wojnarowska, Reference Mazur, Wojnarowska, Januszewicz and Szymborski2001; Wojtyła et al., Reference Wojtyła, Biliński, Bojar and Wojtyła2011).
Watching TV or using a computer in itself is not the only problem. Surveys show that those activities are often accompanied by the consumption of high-calorie food like chips, pizzas, hamburgers, sweets or sweet drinks (Shi & Mao, Reference Shi and Mao2010; Hare-Bruun et al., Reference Hare-Bruun, Nielsen, Kristensen, Møller, Togo and Heitmann2011). This is particularly a problem with boys (Hare-Bruun et al., Reference Hare-Bruun, Nielsen, Kristensen, Møller, Togo and Heitmann2011). It should also be noted that the problem of eating snacks becomes more serious as children get older, as their parents do not control their meals so strictly (Kersting et al., Reference Kersting, Sichert-Hellert, Lausen, Alexy, Manz and Schöch1998; Hare-Bruun et al., Reference Hare-Bruun, Nielsen, Kristensen, Møller, Togo and Heitmann2011). Undoubtedly, television commercials are to some extent to blame. According to surveys, 50% of television programmes for children are accompanied by commercials for food, of which 91% are products rich in fat, sugar and salt, and none of them features fruit or vegetables. It turns out that pre-school and school-age children are especially susceptible to the influence of television, and more often reach for the products advertised, even though they know that they are unhealthy (Tabacchi et al., Reference Tabacchi, Giammanco, La Guardia and Giammanco2007; Andreyeva et al., Reference Andreyeva, Kelly and Harris2011; Hare-Bruun et al., Reference Hare-Bruun, Nielsen, Kristensen, Møller, Togo and Heitmann2011). Hence the results of surveys on pre-school children's diets emphasize that meals of such small children are already high in fats (especially saturated ones), salt and sugar, and low in fruit, calcium and fibre (Bellows et al., Reference Bellows, Anderson, Gould and Auld2008).
Irregular eating habits, especially typical of older age groups (de Gouw et al., Reference de Gouw, Klepp, Vignerová, Lien, Steenhuis and Wind2010), should also be counted among the factors that create favourable conditions for developing overweight and obesity in children and adolescents. According to some surveys, overweight and obesity most often occur in the group of pupils who start their day without breakfast (Dubois et al., Reference Dubois, Girard and Kent2006).
Shortening sleep time also contributes to the development of fat tissue. This problem was surveyed in a pre-school group (Carter et al., Reference Carter, Taylor, Williams and Taylor2011), but it should be remembered that it concerns especially older children and adolescents who watch TV or play computer games at the expense of sleeping, and at the same time drink sparkling sweet drinks like Coca-Cola, which contain caffeine (Shi & Mao, Reference Shi and Mao2010).
This study's analysis of fat distribution showed that the boys from the latest cohort, as compared with the subjects measured in 2000, had higher trunk adiposity, noticeable by greater thickness of subscapular and suprailiac skinfolds.
The study results may confirm the supposition that the currently measured subjects had low levels of physical activity. Wądołowska & Cichon (Reference Wądołowska and Cichon2000) found that the boys with low physical activity had higher subscapular and suprailiac adiposity. Przybyłowicz et al. (Reference Przybyłowicz, Cichon and Jaworowska2006) obtained similar results; they found that physically active boys had lower subscapular adiposity.
The results concerning the remaining components of the body, i.e. muscle and bone mass, are puzzling. The analysis shows that the boys from the last cohort, as compared with the subjects from the previous one, had higher muscle mass and lower skeletal bone mass. It is a well-known fact that obese people have a higher muscle mass, indispensable for supporting and moving a greater body weight, and their bones have a greater muscle-attachment surface (Ducher et al., Reference Ducher, Bass, Naughton, Eser, Telford and Daly2009; Cole et al., Reference Cole, Harvey, Kim, Ntani, Robinson, Inskip and Godfrey2011; El Hage et al., Reference El Hage, Theunynck, Jacob, Moussa, Baddoura, Kamlé and El Hage2011). The phenomenon of greater strength is explained by Frost's mechanostat theory, which assumes that bones adapt primarily to muscle contraction and not to static force imposed by extra fat mass (Ducher et al., Reference Ducher, Bass, Naughton, Eser, Telford and Daly2009). However, it is vital that bones, despite their greater dimensions, have lower mineral content and lower density (Farr et al., Reference Farr, Chen, Lisse, Lohman and Going2010), and it can be assumed that they also have lower mass. Additionally, leptin produced, among others, by adipocytes (Farr et al., Reference Farr, Chen, Lisse, Lohman and Going2010) may have an unfavourable effect on the process of osteogenesis in boys, so people with excessive fat tissue will have higher levels of this.
Lower bone mass may also result from the disturbances in bone mineralization caused by vitamin D deficiency. Numerous research has shown that obese people had lower vitamin D levels in their bodies (Khor et al., Reference Khor, Chee, Shariff, Poh, Arumugam, Rahman and Theobald2011; Lagunova et al., Reference Lagunova, Porojnicu, Lindberg, Aksnes and Moan2011; Soares et al., Reference Soares, Chan She Ping-Delfos and Ghanbari2011). It has been suggested that vitamin D deficiency in these people is connected to a lower level of physical activity in the fresh air, and therefore less exposure of the body to sunshine, essential for the synthesis of vitamin D. It has also been found that fat tissue accumulates vitamin D causing its level in blood serum to drop (Arunabh et al., Reference Arunabh, Pollack, Yeh and Aloia2003). In vitro examinations have shown that a high level of vitamin D in adipocytes creates favourable conditions for lipogenesis and lowers the process of lipolysis (Boon et al., Reference Boon, Koppes, Saris and Van Mechelen2005).
It is clear that these are not the only factors influencing the development of particular body components. The prenatal interaction between genes and the environment plays an important role in determining the postnatal phenotype. The fetus comes under ‘metabolic programming’ during gestation, and this can affect the metabolism all life long, e.g. great weight gain or cigarette smoking by mothers during pregnancy can increase the risk of obesity in their children (Tabacchi et al., Reference Tabacchi, Giammanco, La Guardia and Giammanco2007).
The present subjects' increase in adiposity, and at the same time in muscle tissue, is reflected in BMI values. Children and adolescents from the last cohort, almost during the whole survey period, had higher BMI values than their peers measured 10 years earlier. Only pre-school children had lower BMI values then their peers measured decades earlier; this is a result of a greater mean body height than in the years 1983 and 2000 (Kryst et al., Reference Kryst, Kowal, Woronkowicz, Sobiecki and Cichocka2012).
However, one should be rather careful when assessing overweight and obesity frequency. In people with high BMI, a greater body weight is affected by increased mass of both fat and muscle tissue (Ducher et al., Reference Ducher, Bass, Naughton, Eser, Telford and Daly2009), which was as shown by the current survey. Similar observations have been made in Australia (Henneberg & Ulijaszek, Reference Henneberg and Ulijaszek2010). It should also be mentioned that the method used and recommended by the IOTF has some limitations. A high percentage of overweight and obese boys in the cohort may result from the criterion used, i.e. BMI. In boys, the mean BMI values are higher and increase more dynamically with age, while the cut-off points, according to Cole, are only slightly diversified in regard to sex, and hence the standards suggested by him are stricter for boys than for girls (Chrzanowska, Reference Chrzanowska2006).
Acknowledgments
The study survey was part of a project financed by the Polish Council for Science and Technology (NN404 177 035) and by University School of Physical Education in Krakow (204/KA/206). The authors declare that they have no conflict of interest.