1. Introduction
Nonenzymic proteins capable of binding lipids exist for a variety of different purposes within cells, as evidenced by a host of recent publications (Blind et al. Reference Blind, Sabling, Kuchenbecker, Chiu, Deacon, Das, Fletterick and Ingraham2014; De Libero & Mori, Reference De Libero and Mori2012; Drin, Reference Drin2014; Garzón et al. Reference Garzón, Anselmi, Bond and Faraldo-Gómez2013; Hashikawa et al. Reference Hashikawa, Shindou, Harayama, Ogasawara, Suwabe and Shimizu2013; Holthuis & Menon, Reference Holthuis and Menon2014; Kono et al. Reference Kono, Ohto, Hiramatsu, Urabe, Uchida, Satow and Arai2013; Luoma et al. Reference Luoma, Castro and Adams2014; Maceyka & Spiegel, Reference Maceyka and Spiegel2014; Maeda et al. Reference Maeda, Anand, Chiapparino, Kumar, Poletto, Kaksonen and Gavin2013; Mesmin et al. Reference Mesmin, Bigay, von Filseck, Lacas-Gervais, Drin and Antonny2013; Olkkonen & Li, Reference Olkkonen and Li2013; Ren et al. Reference Ren, Lin, Pathak, Temple, Nile, Mousley, Duncan, Eckert, Leiker, Ivanova, Myers, Murphy, Brown, Verdaasdonk, Bloom, Ortlund, Neiman and Bankaitis2014; Roulin et al. Reference Roulin, Lötzerich, Torta, Tanner, van Kuppeveld, Wenk and Greber2014; Sandhoff & Harzer, Reference Sandhoff and Harzer2013; Schulze & Sandhoff, Reference Schulze and Sandhoff2014). The purposes include: (i) presentation of lipids to hydrolytic proteins for degradation and salvage of breakdown products to rebuild and recycle needed lipid components; (ii) presentation of lipids to proteins of the immune system during development of antigenicity; (iii) sensing of intracellular lipid compositions in membranes of various organelles; and (iv) transfer of lipids between intracellular membranes of different organelles. These latter two functions play roles in regulating intracellular signaling events and lipid homeostasis. Not surprisingly, a wide array of proteins exists for such purposes because of the many different lipid types found in mammalian cells. However, relatively few protein-folding motifs have been identified that can ensheath the entire lipid molecule, i.e. both polar headgroup and nonpolar aliphatic chains. Even fewer have been structurally characterized and molecularly mapped.
Over the past decade, the glycolipid transfer protein (GLTP) and related homologs have emerged as a new superfamily of nonenzymic sphingolipid transfer/binding proteins. The name, GLTP superfamily, reflects the function of its founding member, GLTP, a soluble 23.8 kDa protein originally detected in mammalian cells over three decades ago based on its ability to accelerate the selective transfer of glycolipids between membranes (Abe et al. Reference Abe, Yamada and Sasaki1982; Abe & Sasaki, Reference Abe and Sasaki1985; Brown et al. Reference Brown, Stephenson, Markello, Barenholz and Thompson1985, Reference Brown, Jarvis and Hyland1990; Metz & Radin, Reference Metz and Radin1980, Reference Metz and Radin1982). Prior to recognition of the GLTP superfamily, molecular cloning had revealed high sequence homology of GLTPs in various mammalian tissues and wide-spread occurrence in eukaryotes (Lin et al. Reference Lin, Mattjus, Pike, Windebank and Brown2000). However, the uniqueness of GLTP as a structural motif did not become evident until X-ray crystallography revealed the novel two-layer ‘sandwich’ topology dominated by α-helices (Airenne et al. Reference Airenne, Kidron, Nymalm, Nylund, West, Mattjus and Salminen2006; Malinina et al. Reference Malinina, Malakhova, Teplov, Brown and Patel2004, Reference Malinina, Malakhova, Kanak, Lu, Abagyan, Brown and Patel2006). This discovery led to designation as the ‘GLTP-fold’ by the Protein Data Bank (PDB) and analyses by the Structural Classification of Proteins database (http://scop.mrc-lmb.cam.ac.uk/scop/). Soon, the human GLTP-fold was deemed the structural prototype for the GLTP superfamily (Brown & Mattjus, Reference Brown and Mattjus2007; Malinina et al. Reference Malinina, Malakhova, Kanak, Lu, Abagyan, Brown and Patel2006) by the Superfamily Genome Library (http://supfam.org/SUPERFAMILY/).
Recent major breakthroughs have significantly advanced our understanding of the important role(s) played by GLTP superfamily members in human cells (Maceyka & Spiegel, Reference Maceyka and Spiegel2014; Simanshu et al. Reference Simanshu, Kamlekar, Wijesinghe, Zou, Zhai, Mishra, Molotkovsky, Malinina, Hinchcliffe, Chalfant, Brown and Patel2013; Stahelin, Reference Stahelin2014). A protein encoded by glycolipid transfer protein-containing domain 1 (GLTPD1), a gene predicted to exist in the human genome only by computer annotation, has been shown to form a GLTP-fold that specifically transfers ceramide-1-phosphate (C1P) rather than glycolipids between membranes. Accordingly, the GLTPD1 protein has been designated as ceramide-1-phosphate transfer protein (CPTP). In vivo, RNAi-induced depletion of CPTP triggers a dramatic elevation of C1P in trans-Golgi-enriched membrane fractions, stimulating arachidonic acid release by Group IV cytosolic phospholipase A2α (cPLA2α ) and generating downstream pro-inflammatory eicosanoids. The findings show that CPTP plays a critical role in cellular homeostasis by preventing C1P accumulation at the trans-Golgi, thereby functioning as a novel regulator of pro-inflammatory eicosanoid production (Maceyka & Spiegel, Reference Maceyka and Spiegel2014; Simanshu et al. Reference Simanshu, Kamlekar, Wijesinghe, Zou, Zhai, Mishra, Molotkovsky, Malinina, Hinchcliffe, Chalfant, Brown and Patel2013). A recent outcome of the initial CPTP study has been renaming of GLTPD1 as CPTP in the human genome by the HUGO Gene Nomenclature Committee (http://www.genenames.org/cgi-bin/gene_symbol_report?hgnc_id=28116).
In the human genome, the differing origins of CPTP and GLTP are clear. CPTP (214 amino acids) is encoded by a three-exon transcript originating from CPTP on chromosome 1 (locus 1p36.33) (Simanshu et al. Reference Simanshu, Kamlekar, Wijesinghe, Zou, Zhai, Mishra, Molotkovsky, Malinina, Hinchcliffe, Chalfant, Brown and Patel2013). GLTP (209 amino acids) is encoded by a five-exon transcript originating from GLTP on chromosome 12 (locus 12q24.11) (Zou et al. Reference Zou, Chung, Lin, Malakhova, Pike and Brown2008). The shared protein-folding topology encoded by CPTP and GLTP, despite only limited sequence homology and different lipid specificity, provides a striking example of evolutionary convergence and emphasizes the structural premium placed on conservation of the GLTP-fold by eukaryotes.
Concurrently with the CPTP studies, major efforts were underway to elucidate the structure/function relationships of accelerated cell death 11 protein (ACD11, Arabidopsis CPTP homolog), a GLTP-like ortholog in the model plant, Arabidopsis thaliana (Simanshu et al. Reference Simanshu, Zhai, Munch, Hofius, Markham, Bielawski, Bielawska, Malinina, Molotkovsky, Mundy, Patel and Brown2014). Over a decade ago, transposon knock-out of the acd11 gene had first revealed its involvement in the regulation of a programmed cell death-like process known as ‘accelerated cell death’ in Arabidopsis, while also demonstrating limited sequence homology between GLTP and ACD11, but an inability to transfer glycolipid (Brodersen et al. Reference Brodersen, Petersen, Pike, Olszak, Skov, Odum, Jorgensen, Brown and Mundy2002). Recently, sphingolipidomics analyses of acd11 knockout plants revealed dramatic alterations in the in vivo balance of sphingolipid mediators known to regulate eukaryotic-programmed cell death (Simanshu et al. Reference Simanshu, Zhai, Munch, Hofius, Markham, Bielawski, Bielawska, Malinina, Molotkovsky, Mundy, Patel and Brown2014). The normally low C1P levels detectable in wild-type plants become elevated and the relatively abundant cell death inducer phytoceramide rises acutely in the acd11 knockout plants. ACD11 can specifically transfer C1P and phyto-C1P over related sphingolipids (sphingosine-1-phosphate (S1P)) and glycerol-based phosphatidic acid (PA) while adopting a GLTP-fold, albeit containing a novel π-bulge located near its C1P lipid-binding cleft.
The discovery and characterization of plant ACD11 and human CPTP provide evidence for a previously unknown branch of the GLTP superfamily and support the evolutionary premium placed on conservation of the GLTP-fold, while undergoing adaptive diversification of lipid specificity (Simanshu et al. Reference Simanshu, Kamlekar, Wijesinghe, Zou, Zhai, Mishra, Molotkovsky, Malinina, Hinchcliffe, Chalfant, Brown and Patel2013, Reference Simanshu, Zhai, Munch, Hofius, Markham, Bielawski, Bielawska, Malinina, Molotkovsky, Mundy, Patel and Brown2014). At the heart of this structural motif is a novel protein fold dominated by α-helices arranged in a two-layer ‘sandwich’ topology. Herein, we assess the current state of knowledge regarding the GLTP-fold while comparing and evaluating newly discovered homologs from a structure/function perspective. For a recent review focused on the membrane interactions of mammalian GLTPs and phosphoinositol 4-phosphate adaptor protein-2 (FAPP2) and their regulation by lipid compositional changes to membranes, readers are referred to Tuuf & Mattjus (Reference Tuuf and Mattjus2014).
2. GLTP-fold defines the GLTP superfamily
2.1 Discovery of a new fold
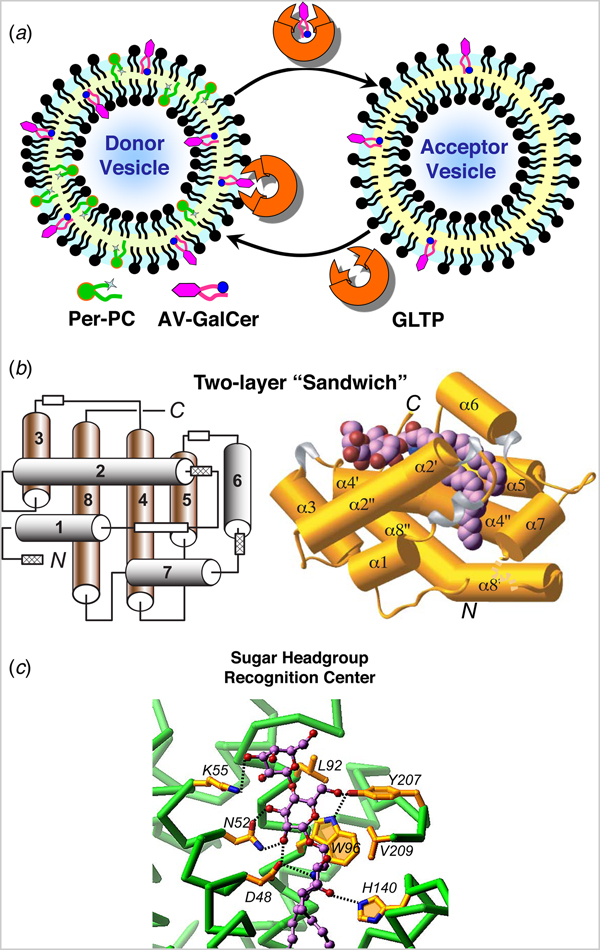
The presence of lipid transfer proteins with specificity for glycolipids initially was detected in various mammalian tissues in the early-to-mid 1980s. The proteins soon came to be known as GLTPs (Abe et al. Reference Abe, Yamada and Sasaki1982; Abe & Sasaki, Reference Abe and Sasaki1985; Brown et al. Reference Brown, Stephenson, Markello, Barenholz and Thompson1985, Reference Brown, Jarvis and Hyland1990; Gammon et al. Reference Gammon, Vaswani and Ledeen1987; Metz & Radin, Reference Metz and Radin1980, Reference Metz and Radin1982; Wong et al. Reference Wong, Brown, Barenholz and Thompson1984). Functionality was defined using radiolabeled and fluorescent glycolipids in conjunction with either natural membranes or lipid vesicles comprised mainly of a 1-palmitoyl-2-oleoyl-sn-glycero-3-phosphocholine (POPC) matrix (Brown et al. Reference Brown, Jarvis and Hyland1990; Brown & Mattjus, Reference Brown and Mattjus2007; Mattjus et al. Reference Mattjus, Molotkovsky, Smaby and Brown1999). GLTP action measured in vitro by fluorescence resonance energy transfer is depicted schematically in Fig. 1a . Purifications from animal tissues were long laborious undertakings, involving many combinations of different liquid chromatographic approaches. The low abundance of protein in tissues and the instability of some protein preparations necessitated an early focus on lipid transfer specificity as well as on regulatory factors that might influence the kinetics of glycolipid transfer activity by GLTP. Not surprisingly, conflicting outcomes were sometimes reported especially with regards to the mechanism by which GLTP transferred glycolipid between membranes. These early studies have been discussed in previous reviews (Brown & Mattjus, Reference Brown and Mattjus2007 and references therein).
GLTP action and structural organization. (a) GLTP-mediated transfer of glycolipid between phosphatidylcholine bilayer vesicles. The fluorescence signal of anthrylvinyl (AV)-GalCer in the donor vesicle is minimal because of resonance energy transfer to perylenoyl-PC. Removal of AV-GalCer from the donor vesicle by GLTP (catalytic amount) and transfer to the excess PC acceptor vesicles results in time-dependent increase in AV-GalCer emission signal. (b) GLTP-fold architecture (PDB: 1SX6). Left panel: Two-layer topology of the α-helices located between front (1, 2, 6 and 7 in gray) and back (3, 4, 5, and 8 in brown). White boxes indicate 310-helices, three of which (hatched boxes) are formed only when glycolipid ligand binds to GLTP. Right panel: The LacCer–GLTP complex with α-helices represented by cylinders (gold); 310-helices, by ribbons (silver), loop segments, by ribbons (gold), and bound LacCer as space-filling. The bound glycolipid atoms are colored lavender, red and blue for carbon, oxygen, and nitrogen atoms, respectively. (c) Glycolipid sugar headgroup recognition center in human GLTP. The headgroup recognition center residues are shown interacting with the two sugars and the Cer amide group of bound LacCer. Hydrogen bonds are shown by dashed lines. The bound glycolipid atoms are colored lavender, red and blue for carbon, oxygen and nitrogen atoms, respectively. The GLTP backbone is colored green, the side chains are shown in gold, and oxygen and nitrogen atoms are red and blue, respectively.

During the 1990s, the GLTP field was dormant. Then, successful molecular cloning of gltp transcript by hot-start, semi-nested polymerase chain reaction (PCR), and rapid-amplification-of-cDNA-ends PCR from bovine, porcine, human, and murine sources fueled a renewal of advancements (Li et al. Reference Li, Malakhova, Lin, Pike, Chung, Molotkovsky and Brown2004; Lin et al. Reference Lin, Mattjus, Pike, Windebank and Brown2000). Heterologous expression and rapid purification of large quantities of active protein opened the door for gaining insights into GLTP structure and for developing the means to directly track GLTP protein itself during interactions with membranes. In 2004, the first high-resolution structures of GLTP were obtained by collaborative efforts in the labs of R. E. Brown (GLTP purification, crystallization, and functional analyses by M. L. Malakhova) and D. J. Patel (X-ray structures by L. Malinina). The crystal structures of human GLTP, both in glycolipid-free form (1.65 Å) and in complex with lactosylceramide (LacCer) (1.95 Å), revealed a novel protein conformational architecture (Malinina et al. Reference Malinina, Malakhova, Teplov, Brown and Patel2004), designated as the GLTP-fold by the PDB in conjunction with analyses by the Structural Classification of Proteins database.
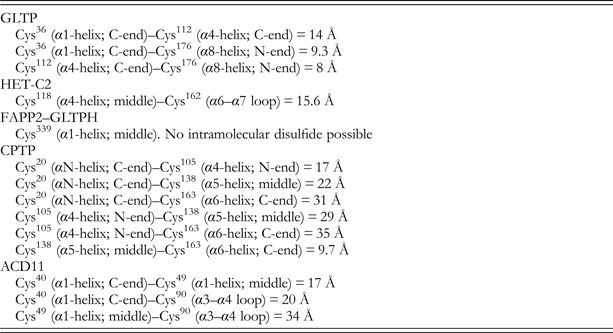
The GLTP-fold is dominated by α-helices, arranged as two orthogonal layers able to ‘sandwich’ a single glycolipid without stabilization by intramolecular disulfide bridging (Fig. 1b ). Currently deposited in the PDB are almost two dozen crystal structures of human GLTP (or point mutants) in glycolipid-free form or complexed with different glycolipids. These structures all indicate that GLTP-fold architecture markedly contrasts the structures of other lipid-binding and transfer proteins which use motifs dominated by β-sheet, i.e. β-grooves/concave cups and β-barrels, or helical bundles stabilized by multiple disulfide bridges, i.e. saposin folds. Such proteins include sphingolipid activator proteins, CD1 proteins, ceramide (Cer) transfer protein, phosphoglyceride transfer proteins, other START-related proteins, nonspecific plant lipid transfer proteins, fatty-acid-binding proteins, and lipocalins (Alpy & Tomasetto, Reference Alpy and Tomasetto2005; Bruhn, Reference Bruhn2005; Grzyb et al. Reference Grzyb, Latowski and Strzaika2006; Kolter et al. Reference Kolter, Winau, Schaible, Leippe and Sandhoff2005; Moody et al. Reference Moody, Zajonc and Wilson2005; Ng et al. Reference Ng, Cheung, Wong and Ye2012; Olmeda et al. Reference Olmeda, Garcıá-Alvarez and Pérez-Gil2013; Silk et al. Reference Silk, Salio, Brown, Jones and Cerundolo2008; Storch & McDermott, Reference Storch and McDermott2009; Thorsell et al. Reference Thorsell, Lee, Persson, Siponen, Nilsson, Busam, Kotenyova, Schüler and Lehtiö2011; Yeats & Rose, Reference Yeats and Rose2008).
2.2 Mapping of the glycolipid-binding site
Molecular mapping of the glycolipid-binding site in mammalian GLTP shows that ‘sandwiching’ of the glycolipid within the two-layer motif involves three distinct regions of the glycosphingolipid (GSL): (i) sugar polar headgroup; (ii) amide group of the Cer moiety; and (iii) nonpolar aliphatic chains. The need for all three GSL regions for optimum GLTP action is supported by findings of free sugars exerting no effect on GLTP activity (Abe et al. Reference Abe, Yamada and Sasaki1982) and poor interaction by monochain glycolipids lacking the Cer amide moiety (Zhai et al. Reference Zhai, Malakhova, Pike, Benson, Bergen, Sugar, Malinina, Patel and Brown2009).
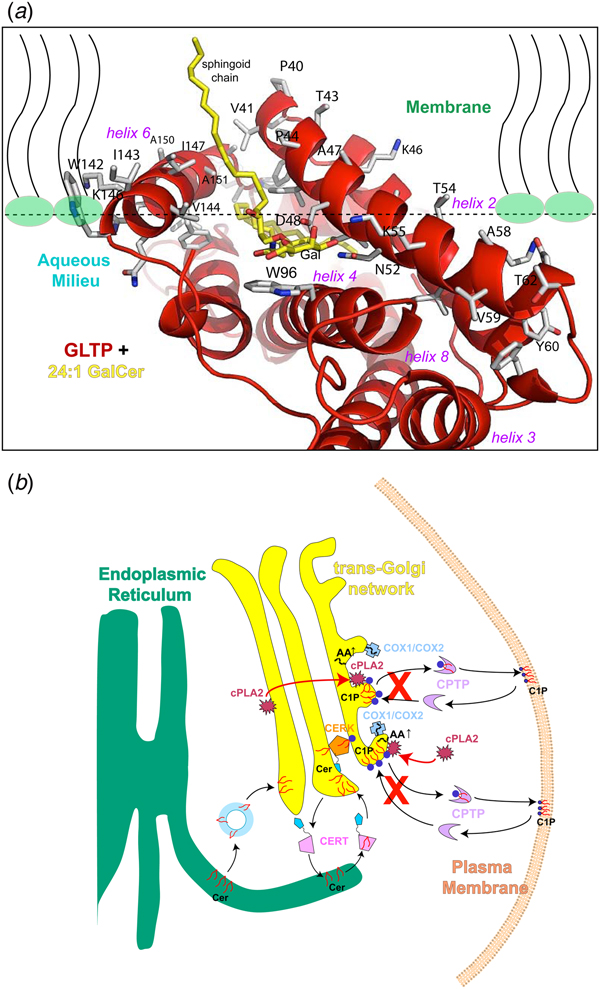
The sugar headgroup recognition site is responsible for tethering the Cer-linked, glycosyl moiety onto the GLTP surface, while engagement of the amide group of the Cer moiety helps trigger opening of a cleft-like gate that enables the nonpolar aliphatic chains to become partially enveloped within a hydrophobic compartment (Airenne et al. Reference Airenne, Kidron, Nymalm, Nylund, West, Mattjus and Salminen2006; Malinina et al. Reference Malinina, Malakhova, Teplov, Brown and Patel2004, Reference Malinina, Malakhova, Kanak, Lu, Abagyan, Brown and Patel2006). Glycolipid sugar headgroup anchoring occurs via a complex network of hydrogen-bonds (bifurcated, bidendate, and cooperative H-bonds) involving Asp48, Asn52, Lys55 (α-helix-2), and Tyr207 (C-terminal region) that mainly target the initial sugar ring, whereas His140 (α-helix-5/6 loop) and Asp48 recognize and ‘clasp’ the Cer amide moiety (Fig. 1c ). Point mutation of Asp48, Asn52, and His140 leads to dramatic loss of galactosylceramide (GalCer) transfer by GLTP compared with modest declines exhibited by point mutation of either Lys55 or Tyr207 (Malakhova et al. Reference Malakhova, Malinina, Pike, Kanack, Patel and Brown2005; Malinina et al. Reference Malinina, Malakhova, Teplov, Brown and Patel2004; Samygina et al. Reference Samygina, Ochoa-Lizarralde, Popov, Cabo-Bilbao, Goni-de-Cerio, Molotkovsky, Patel, Brown and Malinina2013). Trp96 (α-helix-4) functions as a stacking plate that helps orient the sugar ring for hydrogen bonding. A similar headgroup interaction network occurs in complexes of bovine GLTP and ganglioside GM3 with sugar anchoring by the recognition center involving the initial Cer-linked glucose residue, whereas the other two sugars are unobservable because of disorder (Airenne et al. Reference Airenne, Kidron, Nymalm, Nylund, West, Mattjus and Salminen2006). In GLTP/GalCer complexes (Malinina et al. Reference Malinina, Malakhova, Kanak, Lu, Abagyan, Brown and Patel2006), the same hydrogen bonding network is observed except that Lys55 hydrogen bonds with the OH3 and OH4 hydroxyls of the initial sugar ring, attached to the Cer in GalCer, rather than with the OH3 hydroxyl of Gal (distal sugar) in 18:1-LacCer (Malinina et al. Reference Malinina, Malakhova, Teplov, Brown and Patel2004).
The critical importance of the sugar ring stacking over the indole aromatic ring for GLTP function was first revealed by the transfer activity loss exhibited by W96A mutation (residual activity ~1%) compared with the moderate decline by the W96F counterpart (residual activity ~63%) (Malinina et al. Reference Malinina, Malakhova, Teplov, Brown and Patel2004). The findings were supported by Trp point mutational studies of GLTP (Kamlekar et al. Reference Kamlekar, Gao, Kenoth, Molotkovsky, Prendergast, Malinina, Patel, Wessels, Venyaminov and Brown2010; West et al. Reference West, Nylund, Slotte and Mattjus2006; Zhai et al. Reference Zhai, Malakhova, Pike, Benson, Bergen, Sugar, Malinina, Patel and Brown2009). Analogous Trp functionality occurs in various lectins during interaction with carbohydrate (Diehl et al. Reference Diehl, Engström, Delaine, Håkansson, Genheden, Modig, Leffler, Ryde, Nilsson and Akke2010; Laughrey et al. Reference Laughrey, Kiehna, Riemen and Waters2008; Saraboji et al. Reference Saraboji, Håkansson, Genheden, Diehl, Qvist, Weininger, Nilsson, Leffler, Ryde, Akke and Logan2012; Sujatha & Balaji, Reference Sujatha and Balaji2004; Sujatha et al. Reference Sujatha, Sasidhar and Balaji2004; Weis & Drickamer, Reference Weis and Drickamer1996). Also, tripartite clusters of Asp, Asn, and Trp reportedly play roles in the sugar-binding site of other proteins such as the Escherichia coli galactose chemoreceptor protein (Vyas et al. Reference Vyas, Vyas and Quiocho1988). This same residue triad appears to be part of the sphingolipid-binding domains associated with helix-turn-helix structural motifs observed in the V3 loop of the HIV-1 gp120 protein, the prion protein, the Alzheimer β-amyloid, and the pancreatic bile salt-dependent lipase which are known to bind GSLs (Aubert-Jousset et al. Reference Aubert-Jousset, Garmy, Sbarra, Fantini, Sadoulet and Lombardo2004; Mahfoud et al. Reference Mahfoud, Garmy, Maresca, Yahi, Puigserver and Fantini2002).
2.3 Glycolipid-binding elicits a ‘signature’ fluorescence response from intrinsic tryptophan
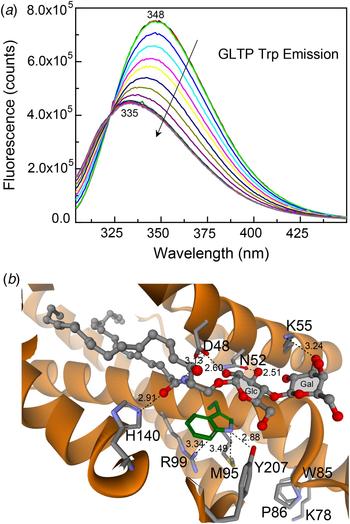
Mammalian GLTPs are intrinsically fluorescent by virtue of having three Trp and ten Tyr residues among their 209 amino acid residues (Li et al. Reference Li, Malakhova, Lin, Pike, Chung, Molotkovsky and Brown2004; Lin et al. Reference Lin, Mattjus, Pike, Windebank and Brown2000). All three Trp residues are conserved in vertebrate GLTPs (Zou et al. Reference Zou, Chung, Lin, Malakhova, Pike and Brown2008), but the only Trp universally conserved in more distantly related GLTPs is the Trp associated with the glycolipid-binding site. The emission signal of Trp is red-shifted in wild-type GLTP devoid of glycolipid (Li et al. Reference Li, Malakhova, Lin, Pike, Chung, Molotkovsky and Brown2004; West et al. Reference West, Nylund, Slotte and Mattjus2006; Zhai et al. Reference Zhai, Malakhova, Pike, Benson, Bergen, Sugar, Malinina, Patel and Brown2009). The 347–348 nm emission wavelength maximum (λ max) is consistent with exposure of the emitting Trp residues to the aqueous environment (Fig. 2a ). Glycolipid binding and associated stacking of the sugar headgroup over Trp96 in GLTP (Fig. 2b ) dramatically alters Trp fluorescence emission, i.e. strong quenching of emission intensity (~40%) accompanied by a large λ max blue-shift (~12 nm) (Fig. 2a ). The fact that glycolipid binding to GLTP, rather than GLTP-membrane association, is mainly responsible for this ‘signature’ change in the Trp fluorescence of GLTP was initially suggested by the persistence of the altered Trp signal in isolated GLTP, separated and recovered after incubation with POPC vesicles containing glycolipid, but not when the vesicles lacked glycolipid (Li et al. Reference Li, Malakhova, Lin, Pike, Chung, Molotkovsky and Brown2004). Tryptophan point mutation studies of GLTP demonstrated the key role played by Trp96 in generating the Trp emission quenching and λ max blue-shift induced by incubation with vesicles containing glycolipid (West et al. Reference West, Nylund, Slotte and Mattjus2006). The development of a titration approach for glycolipid loading of GLTP in solution by stepwise injection of glycolipid dissolved in ethanol showed that glycolipid binding is sufficient to trigger the vast majority of Trp emission quenching and λ max blue-shift in GLTP (Zhai et al. Reference Zhai, Malakhova, Pike, Benson, Bergen, Sugar, Malinina, Patel and Brown2009). No interaction with phospholipid membrane vesicles is required. Also, titration of W96F-GLTP fails to produce the glycolipid-induced changes in Trp fluorescence observed in wtGLTP. The ‘signature’ GLTP fluorescence response has been used for estimating glycolipid-binding affinity by human GLTP (Zhai et al. Reference Zhai, Malakhova, Pike, Benson, Bergen, Sugar, Malinina, Patel and Brown2009) as well as an experimental evaluator to test putative GLTP homologs for GLTP-fold formation and glycolipid-binding capacity (Kamlekar et al. Reference Kamlekar, Simanshu, Gao, Kenoth, Pike, Prendergast, Malinina, Molotkovsky, Venyaminov, Patel and Brown2013; Kenoth et al. Reference Kenoth, Simanshu, Kamlekar, Pike, Molotkovsky, Benson, Bergen, Prendergast, Malinina, Venyaminov, Patel and Brown2010).
Fluorescence emission response of intrinsic tryptophan in human GLTP. (a) ‘Signature’ changes in Trp emission of human GLTP in response to glycolipid binding. The maximal intensity spectra (superimposed black, red, and lime green traces) represent apo-GLTP (1 μM) incubated for 0.5, 3.5, and 6.5 min in buffer. Initial addition of 8:0-GalCer (0.08 μM) is shown by the blue spectrum. Other spectra (in direction of arrow) represent subsequent stepwise additions of 8:0-GalCer at 3 min. intervals (final increment conc. = 0.08 μM). (b) Trp96 functions as ‘stacking plate’ that orients the Cer-linked sugar for hydrogen bonding with other residues in the glycolipid headgroup recognition center shown in Figure 1c .

3. Structural ‘Tweaks’ linked to altered glycolipid specificity in the GLTP-fold
3.1 Nonmammalian GLTPs
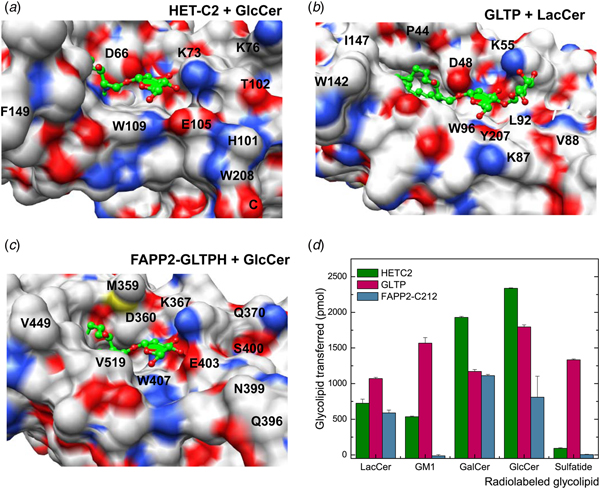
X-ray structures for the apo forms of fungal and algal GLTP orthologs, i.e. heterokaryon incompatibility C2 protein (HET-C2) of Podospora anserina and GLTP in the thermoacidophilic unicellular red alga, Galdieria sulphuraria (PDB: 2I3F) show GLTP-folds with putative lipid recognition centers containing the same essential residues topologically organized in the same way as in mammalian GLTPs complexed with glycolipid (Kenoth et al. Reference Kenoth, Simanshu, Kamlekar, Pike, Molotkovsky, Benson, Bergen, Prendergast, Malinina, Venyaminov, Patel and Brown2010, Reference Kenoth, Kamlekar, Simanshu, Gao, Malinina, Prendergast, Molotkovsky, Patel, Venyaminov and Brown2011; Samygina et al. Reference Samygina, Popov, Cabo-Bilbao, Ochoa-Lizarralde, Goni-de-Cerio, Zhai, Molotkovsky, Patel, Brown and Malinina2011). In the case of HET-C2, functional analyses show more focused glycolipid selectivity than exhibited by human GLTP such as fast transfer of glucosylceramide (GlcCer) or GalCer but almost no transfer of 3-sulfo-GalCer (sulfatide). Subtle structural changes to the GLTP-fold of HET-C2 provide a plausible explanation for the more focused glycolipid selectivity (Fig. 3a ). Compared to GLTP (Fig. 3b ), the HET-C2 surface region near Lys73 of the recognition center contains additional positively charged residues (e.g., Lys76) that could restrict Lys73 positioning. Also, in HET-C2, negatively charged Glu105 and polar Thr102 occupy the same positions as Leu92 and Gly89 in human GLTP (Kenoth et al. Reference Kenoth, Simanshu, Kamlekar, Pike, Molotkovsky, Benson, Bergen, Prendergast, Malinina, Venyaminov, Patel and Brown2010). HET-C2 has shorter α3–α4 and C-terminal loops that enable formation of a surface protrusion by His101–Trp208 ‘stacking’. Together, the preceding differences lead to a pit-like morphology for the HET-C2 sugar headgroup recognition center that favors a neutral monoglycosyl headgroup (Figs 3a and 3d ). Structural studies of HET-C2 complexed with glycolipid will be needed to fully test the preceding explanation. What is clear is that the localized changes to the glycolipid recognition center in apo-HET-C2 have marginal impact on protein temperature stability. At neutral pH, the unfolding transition temperature mid-point for HET-C2 is ~49 °C (Kenoth et al. Reference Kenoth, Kamlekar, Simanshu, Gao, Malinina, Prendergast, Molotkovsky, Patel, Venyaminov and Brown2011), which is only 4–5 °C lower than that of human GLTP (Kamlekar et al. Reference Kamlekar, Gao, Kenoth, Molotkovsky, Prendergast, Malinina, Patel, Wessels, Venyaminov and Brown2010). The two Cys residues, i.e. Cys118 (α4-helix) and Cys162 (α6-α7 loop) in HET-C2 are too far apart (15.6 Å) to stabilize the fold via disulfide bridging. For the G. sulphuraria GLTP-like protein, X-ray analysis (PDB: 2I3F) also provides insights only into the apo-structure of the GLTP-fold. Modeling predicts glycolipid sugar head group accommodation occurs via the same key residues as in GLTP, including the possibility of the real ligand being a sulfated glycolipid (Samygina et al. Reference Samygina, Popov, Cabo-Bilbao, Ochoa-Lizarralde, Goni-de-Cerio, Zhai, Molotkovsky, Patel, Brown and Malinina2011).
Structural Tweaking of the Sugar Headgroup Recognition Center in the GLTP-fold to Alter Functional Selectivity for Glycolipids. (a–c) Sugar headgroup recognition centers of fungal HET-C2, human GLTP, and human FAPP2–GLTPH showing surface electrostatics. Red and blue indicate negative and positive charge, respectively. In the bound glycolipid ligands (green), oxygen atoms are red. (d) Glycolipid transfer selectivity of fungal HET-C2, human FAPP2–C212, and human GLTP determined by intervesicular transfer of radiolabeled glycolipids as previously described (Brown et al. Reference Brown, Stephenson, Markello, Barenholz and Thompson1985, Reference Brown, Jarvis and Hyland1990)

In the case of Arabidopsis GLTP (AtGLTP1), structural homology modeling provides the only insights for both the apo- and holo-AtGLTP1 conformers. A GLTP-fold is predicted with conserved arrangement of all primary residues needed for glycolipid binding (West et al. Reference West, Viitanen, Alm, Mattjus, Salminen and Edqvist2008). Interestingly, functional analyses show strong selectivity for GlcCer compared with other simple neutral glycolipids (GalCer or LacCer). The preference for GlcCer has been attributed to differing secondary residues in the binding site (e.g. Asn95 replacing Leu92). Experimental structural determinations of AtGLTP/GlcCer and AtGLTP/GalCer complexes will be needed to test the preceding idea as well as to gain insights into the conformational features of the hydrophobic compartment of AtGLTP1.
3.2 Glycolipid transfer protein homology (GLTPH) domain of FAPP2: another glycolipid-specific human GLTP homolog
In human cells, other GLTP homologs exist that can specifically transfer glycolipid between membranes. One such protein is FAPP2 which plays a key role in the maturation of certain transport vesicles destined for the plasma membrane from the trans-Golgi network while also critically regulating GSL synthesis by controlling the localization of the key precursor lipid, GlcCer, via its C-terminal GLTPH domain (D'Angelo et al. Reference D'Angelo, Polishchuk, Di Tullio, Santoro, Di Campli, Godi, West, Bielawski, Chuang, van der Spoel, Platt, Hannun, Polishchuk, Mattjus and De Matteis2007, Reference D'Angelo, Uemura, Chuang, Polishchuk, Santoro, Ohvo-Rekilä, Sato, Di Tullio, Varriale, D'Auria, Daniele, Capuani, Johannes, Mattjus, Monti, Pucci, Williams, Burke, Platt, Harada and De Matteis2013). FAPP2 transports GlcCer from its site of synthesis on the cytosolic face of the cis-Golgi, to the trans-Golgi for conversion into more complex GSLs on the luminal face of the trans-Golgi (D'Angelo et al. Reference D'Angelo, Polishchuk, Di Tullio, Santoro, Di Campli, Godi, West, Bielawski, Chuang, van der Spoel, Platt, Hannun, Polishchuk, Mattjus and De Matteis2007). FAPP2 point mutation that mitigates GlcCer binding to the GLTPH glycolipid-binding site targets FAPP2 to the cis-Golgi; whereas GlcCer binding by GLTPH targets FAPP2 to the trans-Golgi via interaction of its pleckstrin homology (PH) domain with phosphatidylinositol 4-phosphate (PI4P) (D'Angelo et al. Reference D'Angelo, Uemura, Chuang, Polishchuk, Santoro, Ohvo-Rekilä, Sato, Di Tullio, Varriale, D'Auria, Daniele, Capuani, Johannes, Mattjus, Monti, Pucci, Williams, Burke, Platt, Harada and De Matteis2013). FAPP2 also may take part in GlcCer retrograde transport from the trans-Golgi to the endoplasmic reticulum, where GlcCer must be flipped to the luminal side before undergoing vesicular transport back to the Golgi complex to function as a precursor for glycolipid biosynthesis (Halter et al. Reference Halter, Neumann, van Dijk, Wolthoorn, de Maziere, Vieira, Mattjus, Klumperman, van Meer and Sprong2007). Recently, an important role for FAPP2 in viral replication has been shown for hepatitis C virus (HCV) (Khan et al. Reference Khan, Katikaneni, Han, Sanchez-Felipe, Hanada, Ambrose, Mackenzie and Konan2014). Viral NS5A protein activates endoplasmic reticulum-derived phosphatidylinositol-4 kinase III alpha, leading to increased production and redistribution of PI4P to the HCV replication complex. As a result, FAPP2 is hijacked (via PI4P binding/targeting) to transport GSL to the HCV replication complex. FAPP2 depletion attenuates HCV infectivity and impedes HCV RNA synthesis.
Evidence for GLTP-fold formation by the GLTPH domain in FAPP2 is based on structural homology modeling and ‘signature’ changes in tryptophan fluorescence emission triggered by glycolipid binding (D'Angelo et al. Reference D'Angelo, Polishchuk, Di Tullio, Santoro, Di Campli, Godi, West, Bielawski, Chuang, van der Spoel, Platt, Hannun, Polishchuk, Mattjus and De Matteis2007; Kamlekar et al. Reference Kamlekar, Simanshu, Gao, Kenoth, Pike, Prendergast, Malinina, Molotkovsky, Venyaminov, Patel and Brown2013). In vitro analyses show the glycolipid selectivity of the FAPP2–GLTPH domain (319-519aa) to be more focused and analogous to that of fungal HET-C2 rather than human GLTP (Kamlekar et al. Reference Kamlekar, Simanshu, Gao, Kenoth, Pike, Prendergast, Malinina, Molotkovsky, Venyaminov, Patel and Brown2013). Indeed, unlike human GLTP which can readily transfer 3-sulfo-GalCer (sulfatide) as well as various other glycolipids with uncharged or charged sugar headgroups (Samygina et al. Reference Samygina, Popov, Cabo-Bilbao, Ochoa-Lizarralde, Goni-de-Cerio, Zhai, Molotkovsky, Patel, Brown and Malinina2011), FAPP2–GLTPH domain transfers GSLs with simple uncharged sugar headgroups, but not sulfatide or ganglioside GM1 (Kamlekar et al. Reference Kamlekar, Simanshu, Gao, Kenoth, Pike, Prendergast, Malinina, Molotkovsky, Venyaminov, Patel and Brown2013). Structural homology modeling shows that negatively charged Glu403 may form a salt bridge with Lys367, but is also well positioned to repel negatively charged functional groups such as the sulfate of 3-sulfo-GalCer, thereby interfering with its binding/transfer by FAPP2-GLTPH (Fig. 3c ). By contrast, nonpolar Leu92 occupies this same position in GLTP which proficiently binds and transfers sulfatide (Samygina et al. Reference Samygina, Popov, Cabo-Bilbao, Ochoa-Lizarralde, Goni-de-Cerio, Zhai, Molotkovsky, Patel, Brown and Malinina2011). Other FAPP2-GLTPH residues (Val519, Val397, Arg398, Asn399, and Ser400) affect the protein surface topology adjacent to the glycolipid headgroup recognition center by providing steric bulk that narrows the headgroup interaction region compared to the ‘open trough’-like surface topology of the sugar headgroup-binding region in GLTP. The constricted glycolipid headgroup recognition center in the FAPP2–GLTPH could explain the lack of interaction with branched, negatively charged sugar headgroups, i.e. ganglioside GM1. The net effect is a sugar recognition center better adapted for focused interaction with uncharged monohexosyl- and dihexosylceramides in human FAPP2–GLTPH compared with the broadly selective human GLTP. The focused glycolipid selectivity and lack of sulfatide transfer by FAPP2–GLTPH are functional features shared with fungal HET-C2 (Kenoth et al. Reference Kenoth, Simanshu, Kamlekar, Pike, Molotkovsky, Benson, Bergen, Prendergast, Malinina, Venyaminov, Patel and Brown2010). Definitive determination of the structural basis for this more focused glycolipid selectivity and confirmation of GLTP-fold formation by FAPP2–GLTPH will require either X-ray diffraction or NMR structural determination combined with point mutational functional analyses.
In any case, in vitro glycolipid transfer analyses of the FAPP2–GLTPH domain do not support strong specificity for GlcCer, as FAPP2–GLTPH also efficiently transfers GalCer and LacCer. One factor driving the in vivo selectivity of FAPP2 for GlcCer could be glycolipid topology. FAPP2 occurs in the cytosol where access is expected to be limited to glycolipids present in cytosol-facing membranes. In mammalian cells, GlcCer is produced by the cytosol-facing GlcCer synthase in the Golgi, but GalCer and LacCer are not normally found in cytosol-facing membranes. Another factor could be the targeting motifs such as the PH domain in FAPP2 that guide interaction to select subcellular sites (e.g. Golgi). Regardless, the lack of strong structurally based specificity for GlcCer by FAPP2 keeps open the possibility of interaction with other neutral GSLs if currently undiscovered events (pathological or normal) were to leave such glycolipids appropriately positioned and facing the cytosol.
4. A new GLTP-fold family with specificity for C1P, but not for glycolipid
4.1 Human CPTP
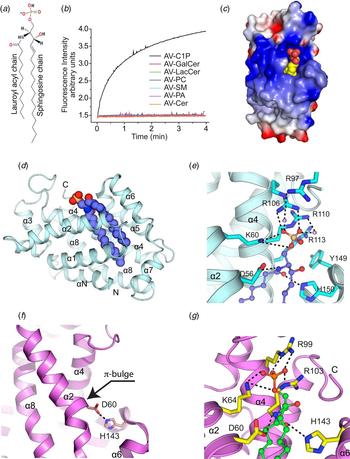
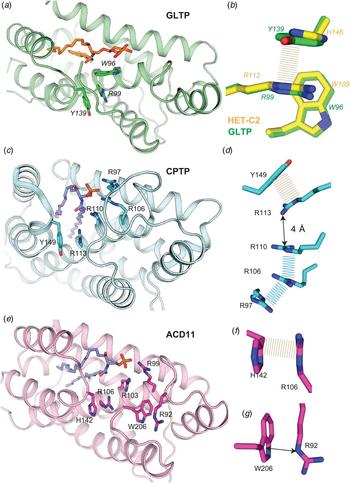
In ~2007, computer-generated annotation of the NCBI Human genome database led to prediction of a novel GLTP-like gene, GLTPD1, proposed to encode a protein that functions in GSL trafficking and/or metabolism (based on analogy to GLTP). PCR evaluation by the R. E. Brown lab verified the existence of GLTPD1 transcript in various human tissues. However, the encoded GLTPD1 protein sequence showed conservation of only two of the five key residues needed for glycolipid binding in GLTP, HET-C2, and FAPP2-GLTPH. Especially notable was Lys and Arg replacing the conserved binding site residues, Asn and Trp, known to be important for sugar headgroup ligand recognition. Structural homology modeling predicted a GLTP-fold but with a positively charged residue triad (Lys/Arg/Arg) forming the sphingolipid headgroup recognition/binding site along with two conserved Asp and His residues that could act as a ‘clasp’ to hold the Cer moiety. In vitro intermembrane transfer analyses of recombinant human GLTPD1 by the Brown lab revealed specificity for C1P (Fig. 4a ) and no capacity for GSL transfer (Fig. 4b ). X-ray structure determinations of a half dozen CPTP crystals in apo form and in complex with different C1P molecular species (Figs 4c and 4d ) by the Patel lab showed the structural basis for C1P binding specificity by the new GLTP-fold compared to other lipids with phosphate headgroups (e.g. PA & S1P). Accordingly, GLTPD1 was designated CPTP to distinguish its differing functional selectivity compared with GLTP (Simanshu et al. Reference Simanshu, Kamlekar, Wijesinghe, Zou, Zhai, Mishra, Molotkovsky, Malinina, Hinchcliffe, Chalfant, Brown and Patel2013).
GLTP-folds with specificity for C1P. (a) Structure of C1P. (b) Transfer specificity of human CPTP for C1P determined by fluorescence resonance energy transfer assay as described in Fig. 1a . (c) CPTP electrostatic surface structure containing bound C1P (yellow, carbon; red, oxygen). In CPTP, blue and red indicate positive and negative charges, respectively. (d) CPTP GLTP-fold (PDB: 4K84) shown in ribbon representation with bound 16:0-C1P (space filling). (e) Structure of CPTP headgroup recognition center. In bound C1P (ball-and-stick), phosphate, oxygen, and carbon are colored orange, red, and violet, respectively. CPTP helices and side chains are cyan with nitrogen and oxygen colored blue and red, respectively. Hydrogen bonds are shown by dashed lines. (f) Apo-ACD11 structure (ribbon representation; magenta; PDB: 4NT1). The π-bulge in α-2 helix positions D60 very close to H143 (~2.9 Å) in this GLTP-fold. (g) ACD11 containing bound C1P. In bound C1P (ball-and-stick), phosphate, oxygen, and carbon are colored orange, red, and green, respectively. In ACD11 (ribbon representation; magenta), the side chains involved in hydrogen bonding (dashed lines) are shown in yellow with nitrogen and oxygen colored blue and red, respectively. In ACD11, the wild-type D60 side chain has been placed into the D60A-ACD11 structure (PDB: 4NTG).

In the GLTP-fold adopted by CPTP, a cationic residue triad (Lys60, Arg106, and Arg110) in a surface cavity recognizes and binds the C1P phosphate headgroup (Fig. 4e ). The anchoring hydrogen-bond network is extensive, involving bifurcated hydrogen bonding by Lys60 (α2-helix) with the O1 and O2 atoms, bidentate hydrogen bonding by Arg106 (α4-helix) with the O2 and O3 atoms, and bidentate hydrogen bonding by Arg110 (α4-helix) directly and through water bridging to O3. Point mutation data support key roles for Lys60 and Arg106 in C1P headgroup recognition with K60A and R106L showing almost no C1P transfer, whereas Arg110 mutation (R110L) shows ~40% transfer activity (Simanshu et al. Reference Simanshu, Kamlekar, Wijesinghe, Zou, Zhai, Mishra, Molotkovsky, Malinina, Hinchcliffe, Chalfant, Brown and Patel2013).
4.2 Arabidopsis ACD11
Prior to the discovery of human CPTP, major efforts had been underway to elucidate the structure/function relationships of ACD11, a GLTP-like ortholog in the model plant, Arabidopsis thaliana. The work had begun over a decade ago when an acd11 transposon knock-out first revealed the gene's involvement in regulation of a programmed cell death-like process known as ‘accelerated cell death’ in Arabidopsis (Brodersen et al. Reference Brodersen, Petersen, Pike, Olszak, Skov, Odum, Jorgensen, Brown and Mundy2002). At the time, the limited sequence homology between ACD11 and GLTP was apparent, but functional analyses showed no capacity for ACD11 to bind/transfer GSL but detectable transfer of sphingosine. Later in vitro functional studies of ACD11 revealed limited capacity for transfer of sphingomyelin (Petersen et al. Reference Petersen, McKinney, Pike, Hofius, Zakaria, Brodersen, Petersen, Brown and Mundy2008), a surprising outcome given the absence of this sphingolipid in plants. Intriguingly, two key residues needed for glycolipid binding (Asn and Trp) in GLTP, HET-C2, and FAPP2–GLTPH were not conserved in the ACD11 sequence. Structural homology modeling of ACD11 predicted a GLTP-fold but with Arg103 replacing Trp in the putative lipid-binding site. Engineering of glycolipid transfer activity into ACD11 by point mutational replacement of Arg103 with the Trp needed for stacking and orienting the sugar headgroup proved unsuccessful (Petersen et al. Reference Petersen, McKinney, Pike, Hofius, Zakaria, Brodersen, Petersen, Brown and Mundy2008). Further analysis of the putative lipid-binding site by the R. E. Brown lab revealed a positively charged residue triad (Lys/Arg/Arg) forming a sphingolipid headgroup recognition/binding site with potential selectivity for phosphate. Testing of ACD11 transfer activity in the Brown lab then led to discovery of specificity for C1P and phyto-C1P. X-ray structural determination of apo-ACD11 by the Patel lab verified a GLTP-fold, but with a novel π-bulge located near the lipid-binding cleft (Fig. 4f ). This novel structural feature positions the two conserved GLTP-fold ‘clasp’ residues (Asp/His), that orient the Cer hydrocarbon chains during sphingolipid binding, in unusually close proximity (2.9 Å) via a salt-bridge. A point mutational strategy was implemented to weaken the Asp60/His143 salt bridge and ‘unlock’ the clasp to facilitate co-crystallization of ACD11 in complex with C1P. X-ray structures of D60N-ACD11 and D60A-ACD11, which maintain significant C1P transfer activity (~30 and 15%, respectively), revealed the C1P phosphate oxygen atoms anchored to positively charged Lys64, Arg99, and Arg103 residues on the protein surface in a structurally analogous manner as in human CPTP (Fig. 4g ). Their functional importance is supported by severe reductions in C1P transfer observed for the K64A, R99E, R99A, and R103A point mutants (Simanshu et al. Reference Simanshu, Zhai, Munch, Hofius, Markham, Bielawski, Bielawska, Malinina, Molotkovsky, Mundy, Patel and Brown2014). D60N point mutation disrupts the stabilizing Asp60–His143 salt bridge and eliminates the π-bulge characteristic of apo-ACD11, enabling hydrogen bonding with the C1P amide moiety.
The existence of yet another human GLTP homolog, encoded by the putative GLTPD2 gene, is predicted by computer-generated annotation of the human genome. Our analyses have verified the presence of GLTPD2 mRNA in certain tissues and indicate an open reading frame encoding protein with closer homology to CPTP and ACD11 than to glycolipid-selective GLTPs at key positions in the putative sphingolipid headgroup recognition center (X. Zou & R.E. Brown, unpublished observation).
4.3 Novel aspects compared with other lipid phosphate-binding folds
The GLTP-folds defined by CPTP and ACD11 architecture represent novel motifs for the specific binding of phosphosphingolipids and were previously unknown among phosphate-modified biomolecules (Berna et al. Reference Berna, Bernier, Chabriere, Perera and Scott2008, Reference Berna, Bernier, Chabriere, Elias, Scott and Suh2009; Bourquin et al. Reference Bourquin, Riezman, Capitani and Grutter2010; Hirsch et al. Reference Hirsch, Fischer and Diederich2007). In both the apo- and holo-forms, the Lys and Arg cationic residues of the phosphate headgroup recognition site are relatively fixed and C1P binding triggers minimal conformational change. The stability and high pK premiums are expected to aid C1P binding across a relatively broad pH range. In contrast, conformational flexibility and pH sensitivity are hallmarks of the ubiquitous Gly-rich loops [GxGxxG] and P-loops [GxxxxGKS/T] that bind phosphate in unrelated NADP/NAD and ATP/GTP-binding proteins (Hirsch et al. Reference Hirsch, Fischer and Diederich2007; Rossmann et al. Reference Rossmann, Moras and Olsen1974; Walker et al. Reference Walker, Saraste, Runswick and Gay1982). Moreover, few similarities exist with the ‘venus flytrap’ fold that characterizes the phosphate-binding protein superfamily (Berna et al. Reference Berna, Bernier, Chabriere, Perera and Scott2008), where two globular domains form a central β-sheet core by hinging together to create a phosphate-binding site accessible only by large conformational changes (Luecke & Quiocho, Reference Luecke and Quiocho1990).
The CPTP/ACD11-binding motif clearly differs from other proteins known to bind lipids containing single-phosphate headgroups. S1P lyase utilizes a ‘phosphate cup’ containing Tyr, His, and Ser along with one Arg, to accomplish S1P binding and hydrolysis (Bourquin et al. Reference Bourquin, Riezman, Capitani and Grutter2010). In contrast, humanized monoclonal antibody Fab fragment binds S1P using two Ca++ ions to bridge between phosphate oxygens and Asp residues while also hydrogen bonding via Glu, Ser, and Gly to the lipid's hydroxyl moieties (Wojciak et al. Reference Wojciak, Zhu, Schuerenberg, Moreno, Shestowsky, Hiraiwa, Sabbadini and Huxford2009). Docking models for S1P or its related immunosuppressive analog FTY720 into S1P1 and S1P3 receptors, based on threading with the crystallographic coordinates of rhodopsin, show binding sites containing only single Arg residues along with Glu and either Leu or Phe (Rosen et al. Reference Rosen, Gonzalez-Cabrera, Sanna and Brown2009). In the case of cPLA2 α, C1P activates by binding ‘head-first’ to a β-groove containing three sequential basic residues (Arg57, Lys58, and Arg59), with the exposed Cer chains acting to tether cPLA2 α to the membrane and lower membrane dissociation, thus enhancing generation of arachidonic acid for eicosanoid production (Stahelin et al. Reference Stahelin, Subramanian, Vora, Cho and Chalfant2007). A similar linear motif of cationic residues is observed in the mechanosensitive channel of large conductance MscL, which carries a cluster of three basic amino acids (Arg98, Lys99, and Lys100) on its cytosolic face for interaction with PA (Powl et al. Reference Powl, East and Lee2005).
Altogether, current evidence indicates that the GLTP-fold defined by the CPTP and ACD11 structures represents a new kind of lipid phosphate-binding fold as well as a previously unknown branch of the GLTP superfamily. The findings also support the evolutionary premium placed on conservation of the GLTP-fold as a sphingolipid binding/transfer module that has been adaptively diversified to alter lipid specificity (Simanshu et al. Reference Simanshu, Kamlekar, Wijesinghe, Zou, Zhai, Mishra, Molotkovsky, Malinina, Hinchcliffe, Chalfant, Brown and Patel2013, Reference Simanshu, Zhai, Munch, Hofius, Markham, Bielawski, Bielawska, Malinina, Molotkovsky, Mundy, Patel and Brown2014).
5. Accommodation of the nonpolar Alkyl chains
5.1 A hydrophobic pocket ensheathes the sphingolipid aliphatic chain(s)
To function, the GLTP-fold must not only be able to recognize and selectively interact with the polar headgroup of the desired lipid, but also must shield the nonpolar aliphatic chain(s) from the aqueous milieu by ensheathing/enveloping the Cer moiety in a hydrophobic environment. The two-layer, orthogonally bundled topology of the α-helical GLTP-fold enables formation of the required hydrophobic compartment. The first insights into the structural features of this hydrophobic compartment in human GLTP were gained by X-ray structure determination (1.95 Å) after co-crystallization of GLTP complexed with LacCer (Malinina et al. Reference Malinina, Malakhova, Teplov, Brown and Patel2004). Both aliphatic hydrocarbon chains of the Cer moiety of LacCer were found ensheathed in side-by-side fashion within a hydrophobic compartment lined by ~25 nonpolar residues (mainly Phe, Leu, Val, and Ile) and completely free of water (Malinina et al. Reference Malinina, Malakhova, Teplov, Brown and Patel2004). To date, more than two dozen crystal structures are deposited in the PDB for wild-type and point mutated GLTP, in glycolipid-free form as well as in complex with various GSL species and related glycosylated amphiphiles, providing remarkably detailed structural insights into this hydrophobic compartment (Airenne et al. Reference Airenne, Kidron, Nymalm, Nylund, West, Mattjus and Salminen2006; Malinina et al. Reference Malinina, Malakhova, Kanak, Lu, Abagyan, Brown and Patel2006; Samygina et al. Reference Samygina, Popov, Cabo-Bilbao, Ochoa-Lizarralde, Goni-de-Cerio, Zhai, Molotkovsky, Patel, Brown and Malinina2011, Reference Samygina, Ochoa-Lizarralde, Popov, Cabo-Bilbao, Goni-de-Cerio, Molotkovsky, Patel, Brown and Malinina2013). The recent successful crystal structural determination of CPTP in its apo form as well as in complex with different C1P species and PA (seven crystal structures) along with ACD11 in its apo form and point mutated ACD11 in complex with different C1P species and lyso-sphingomyelin (five crystal structures) provide detailed structural insights into two more hydrophobic compartments of GLTP-folds (Simanshu et al. Reference Simanshu, Kamlekar, Wijesinghe, Zou, Zhai, Mishra, Molotkovsky, Malinina, Hinchcliffe, Chalfant, Brown and Patel2013, Reference Simanshu, Zhai, Munch, Hofius, Markham, Bielawski, Bielawska, Malinina, Molotkovsky, Mundy, Patel and Brown2014). For other GLTP-folds, experimental structural determinations generally are lacking, especially for the holo forms. Existing molecular insights have relied primarily on structural homology modeling.
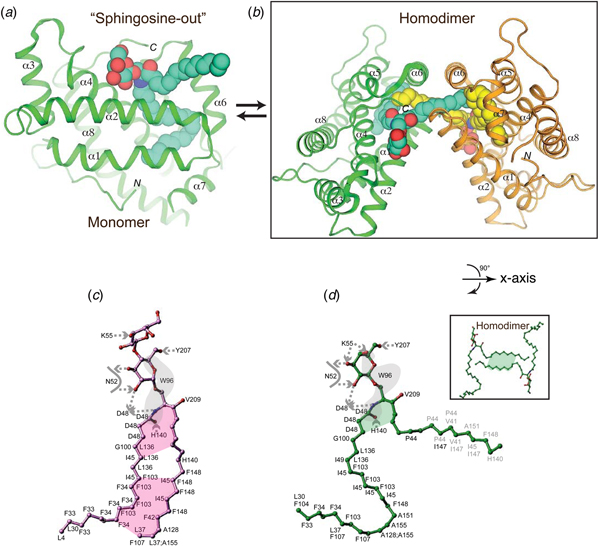
To illustrate structural similarities and differences that occur in the hydrophobic compartments of different GLTP-folds, we compare the extensive structural data available for wtCPTP and wtGLTP. In their apo forms, GLTP and CPTP both have collapsed hydrophobic compartments that expand and adapt to accommodate the bound sphingolipid (Airenne et al. Reference Airenne, Kidron, Nymalm, Nylund, West, Mattjus and Salminen2006; Malinina et al. Reference Malinina, Malakhova, Teplov, Brown and Patel2004, Reference Malinina, Malakhova, Kanak, Lu, Abagyan, Brown and Patel2006; Samygina et al. Reference Samygina, Popov, Cabo-Bilbao, Ochoa-Lizarralde, Goni-de-Cerio, Zhai, Molotkovsky, Patel, Brown and Malinina2011, Reference Samygina, Ochoa-Lizarralde, Popov, Cabo-Bilbao, Goni-de-Cerio, Molotkovsky, Patel, Brown and Malinina2013; Simanshu et al. Reference Simanshu, Kamlekar, Wijesinghe, Zou, Zhai, Mishra, Molotkovsky, Malinina, Hinchcliffe, Chalfant, Brown and Patel2013). Superpositioning of GLTP and CPTP with bound lipid reveals lateral displacement of the binding compartments relative to each other. In CPTP, the hydrophobic compartment lies somewhat closer to the interior core of the protein, perhaps because of subtle differences in the positioning and movements of helices 2 and 6 during lipid acquisition. However, examination of the structures of CPTP and GLTP complexed with different C1P or GalCer species (Malinina et al. Reference Malinina, Malakhova, Kanak, Lu, Abagyan, Brown and Patel2006; Samygina et al. Reference Samygina, Popov, Cabo-Bilbao, Ochoa-Lizarralde, Goni-de-Cerio, Zhai, Molotkovsky, Patel, Brown and Malinina2011; Simanshu et al. Reference Simanshu, Kamlekar, Wijesinghe, Zou, Zhai, Mishra, Molotkovsky, Malinina, Hinchcliffe, Chalfant, Brown and Patel2013) clearly shows their hydrophobic compartments share many features in common: (i) Both are almost completely collapsed when unoccupied. (ii) Both can adaptively expand during sphingolipid uptake to tightly ensheath the nonpolar aliphatic chains of the Cer moiety. The expansions are reflected in the calculated solvent accessible (SA) volumes upon binding of sphingolipids with different acyl chains. (iii) Both acquire sphingolipid in a highly oriented and conserved fashion with regards to the acyl and sphingoid chains. Orientation of the sphingolipid Cer moiety is controlled by a pair of hydrogen bonds that emanate from conserved Asp and His residues to produce a Cer amide ‘clasp’, i.e. Asp56/His143 in CPTP; Asp48/His140 in GLTP. This conserved binding orientation of sphingolipid results in the acyl chain always being first to enter and last to depart during the uptake and egress processes. The projection and orientation of the ‘clasp’ His imidazole ring is stabilized by interaction with a nearby Tyr residue (α5-helix) shared by all GLTP-folds (e.g. Tyr142 in CPTP; Tyr132 in GLTP). (iv) Both display two sphingolipid-binding modes that leave the sphingoid chain positioned either inside or outside (Figs 1b , 4d and 5a ). In the sphingosine-out binding mode, there is a sharp bend at carbon 6 in the 18-carbon sphingoid chain which then projects away from the cleft-like gate of the hydrophobic compartment rather than being taken in. Whether the sphingosine-out mode represents a transition-state intermediate of sphingolipid loading/unloading during membrane association or a viable configuration of the transfer process remains a subject of debate and in need of further study. The latter possibility is supported by the preponderance of glycolipid species that display the sphingosine-out conformer upon co-crystallization with GLTP. Regardless, the sphingosine-out conformer for the GLTP-fold is expected to only marginally affect solubility. In essence, the sphingosine-out conformer is analogous to protein monoacylation, except that the exposed hydrocarbon segment of sphingosine (10–12 methylenes) is even shorter than protein acylated by myristoylation (14:0) or palmitoylation (16:0). The attachment of a single myristoyl group to a soluble protein is known to only marginally affect its solubility and partitioning affinity for nonpolar (membrane) surfaces (Murray et al. Reference Murray, Ben-Tal, Honig and McLaughlin1997). A second acylation event involving palmitate (16 carbons) usually is needed for soluble proteins to stably associate with membranes.
Sphingosine-in and sphingosine-out binding modes of GLTP-folds and homodimerization of GLTP. (a) Sphingosine-out binding mode in which the sphingoid chain of the Cer moiety remains outside the hydrophobic pocket. GLTP is shown complexed with 24:1 GalCer (PDB: 2EUK) (b) Homodimerization of GLTP promoted by the sphingosine-out binding mode. The GLTP monomers and their bound glycolipid dimerize in antiparallel fashion. (c) Schematic representation of GSL interactions involving 18:1 LacCer in the sphingosine-in binding mode (PDB: 1SX6). Lettering indicates interacting GLTP amino acid residues, dashed arrows show hydrogen bonds oriented from donor to acceptor, the gray surface covers lipid atoms interacting with W96 indole group, the colored planes cover lipid regions participating in interchain interaction, gray lettering corresponds to interactions with a neighbor GLTP in the packing-related dimer in the crystal. (d) Schematic of GSL interactions involving 24:1 GalCer in the sphingosine-out binding mode (PDB: 2EUK). The insert shows a schematic of sphingosine–sphingosine interaction of 24:1 GalCer in the dimer. Lettering and colored planes are defined as in (c). The curved arrow indicates a 90° rotation around the horizontal axis, i.e. x-axis, in the view for the inset of (d) compared with (b).

5.2 Does lipid-induced reversible homodimerization play a role in function?
Definitive localization of the sphingoid chain in the sphingosine-out binding mode of GLTP is a consequence of glycolipid-induced homodimerization by GLTP (Fig. 5b ), which consistently occurs at the same protein–protein contact sites in almost all holo-GLTP forms. The dimerization interface enables clear, unequivocal resolution of the entire sphingosine chain from uninterrupted electron density maps, even when the sphingosine is not fully taken up by the hydrophobic compartment (Malinina et al. Reference Malinina, Malakhova, Kanak, Lu, Abagyan, Brown and Patel2006; Samygina et al. Reference Samygina, Popov, Cabo-Bilbao, Ochoa-Lizarralde, Goni-de-Cerio, Zhai, Molotkovsky, Patel, Brown and Malinina2011, Reference Samygina, Ochoa-Lizarralde, Popov, Cabo-Bilbao, Goni-de-Cerio, Molotkovsky, Patel, Brown and Malinina2013). GLTP residues making the closest van der Waals contacts with the glycolipid chains for sphingosine-out and sphingosine-in alignments are outlined in Figs 5c and 5d , respectively. The sphingosine-in mode is additionally stabilized by acyl-sphingosine interchain interactions (Fig. 5c ); whereas in the sphingosine-out mode, sphingosine–sphingosine cross-bridging interactions between GSLs from partner complexes associated with crystal-related cross dimerization contribute to stabilization (Fig. 5d ).
It is noteworthy that the dimeric contact interface is highly conserved in different crystal polymorphs and complexes, is generated by different glycolipid species and encompasses the glycolipid-binding site while overlapping the putative membrane-docking region of GLTP (Kamlekar et al. Reference Kamlekar, Gao, Kenoth, Molotkovsky, Prendergast, Malinina, Patel, Wessels, Venyaminov and Brown2010; Malinina et al. Reference Malinina, Malakhova, Kanak, Lu, Abagyan, Brown and Patel2006). Initially, the homodimerization was viewed primarily as a crystal-related indicator of the membrane interaction region that encompasses the glycolipid-binding site in GLTP (Malinina et al. Reference Malinina, Malakhova, Kanak, Lu, Abagyan, Brown and Patel2006). In solution in the absence of membrane, GLTP shows limited tendency to dimerize until high concentrations are reached (Samygina et al. Reference Samygina, Popov, Cabo-Bilbao, Ochoa-Lizarralde, Goni-de-Cerio, Zhai, Molotkovsky, Patel, Brown and Malinina2011; Zhai et al. Reference Zhai, Malakhova, Pike, Benson, Bergen, Sugar, Malinina, Patel and Brown2009). Recently, Malinina and colleagues hypothesized that glycolipid-mediated, reversible homodimerization might play a role in regulating GLTP action (Samygina et al. Reference Samygina, Ochoa-Lizarralde, Popov, Cabo-Bilbao, Goni-de-Cerio, Molotkovsky, Patel, Brown and Malinina2013). The idea is supported by new structural determinations of wtGLTP, D48V-GLTP, and A47D/D48V-GLTP complexed with monosulfatide and disulfatide showing the dimeric contact interface to be highly conserved in different crystal polymorphs and complexes with flexibility changes in the dimer contact region helping to regulate formation of the sphingosine-in versus sphingosine-out uptake modes. The regulatory action of the glycolipid-mediated, reversible GLTP homodimerization at the membrane interface, might involve: (i) creation of an environment favorable for GLTP cleft opening/closing that facilitates glycolipid loading (or unloading) and/or (ii) control of exposure of the hydrophobic GLTP membrane-interaction region that facilitates dissociation of ‘glycolipid-loaded’ GLTP from the membrane to the aqueous milieu. Such ideas merit further consideration when one considers that the confinement produced by translocation of a protein from three-dimensional solution to a two-dimensional membrane interface results in a ~1000-fold higher effective concentration than if freely diffusing in the cell cytoplasm (McLaughlin et al. Reference McLaughlin, Wang, Gambhir and Murray2002). Also, transient docking of GLTP onto the membrane aligns and orients the protein molecules in ways that could enhance transient, reversible dimerization. Once adsorbed to the membrane, certain lipids known to regulate GLTP action might also promote local conformational changes that influence dimerization status.
For reasons discussed earlier, reversible transition to monomer from dimer involving the GLTP ‘sphingosine-out’ conformer in solution after dissociation from the membrane is not likely to dramatically diminish GLTP solubility. In the ‘sphingosine-out’ mode, the sphingoid chain could interact with the nonpolar residues between helices α5 and α6 via hydrophobic and van der Waals interactions enabling adsorption to the protein surface. Indeed, examples exist of proteins containing surface grooves that accommodate significant stretches of nonpolar hydrocarbons on their surfaces while remaining monomeric (Chakravarty et al. Reference Chakravarty, Gu, Chirala, Wakil and Quiocho2004; van den Berg et al. Reference van den Berg, Black, Clemons and Rapoport2004). Thus, it is not surprising that GLTP can be monomeric in solution when containing bound glycolipid.
5.3 Variation in the hydrophobic compartment of different family members
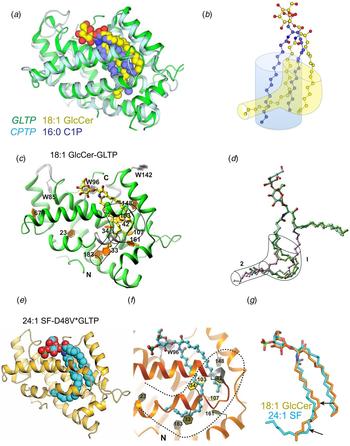
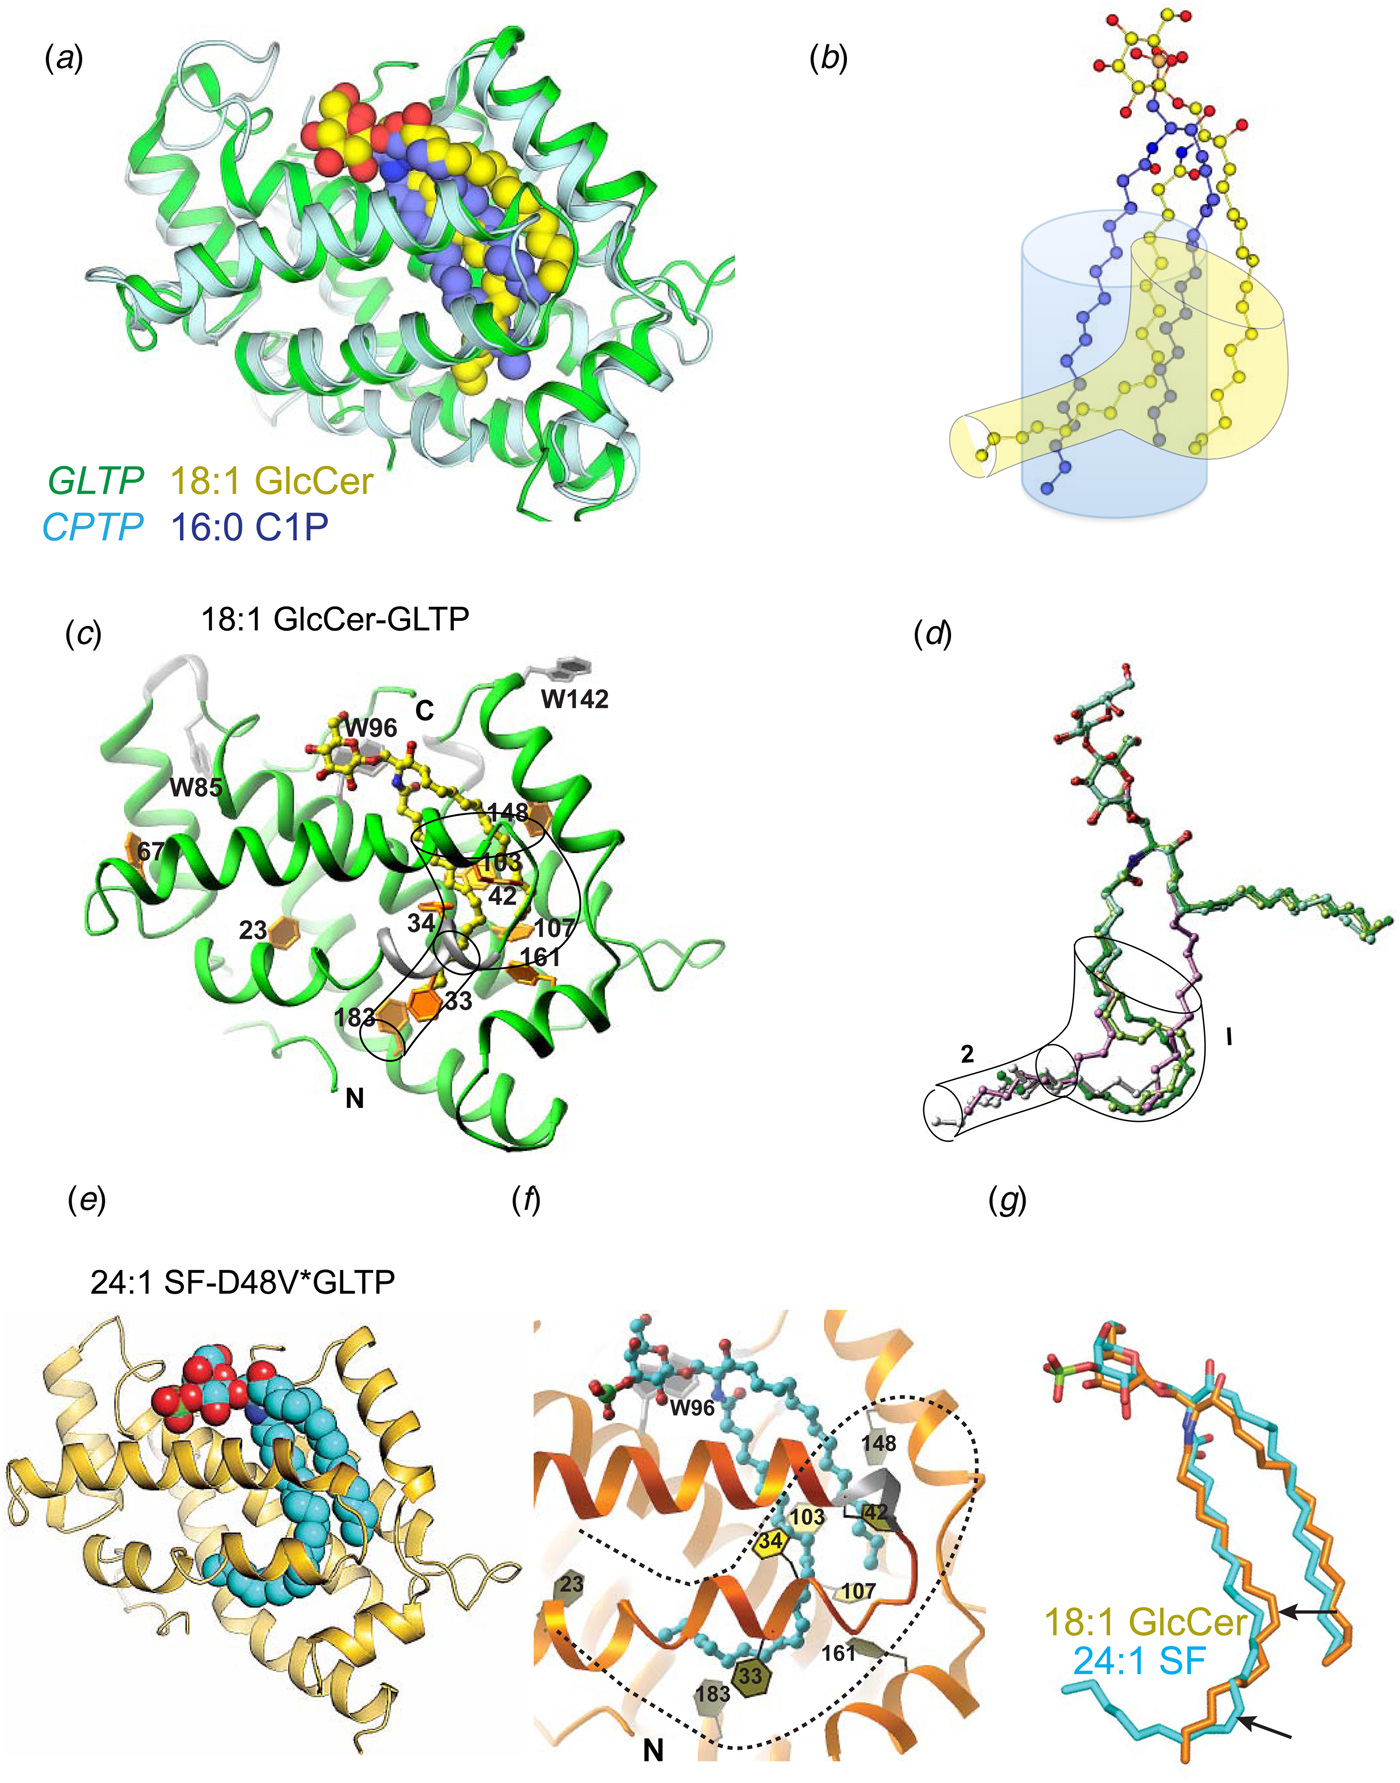
Although the hydrophobic compartments of CPTP and GLTP share similarities, differences also clearly exist (Fig. 6). In CPTP, the compartment is not as structurally complex and more clearly resembles a pocket. The pocket-like functionality results from αN-helix positioning to seal the bottom of the CPTP hydrophobic compartment (Simanshu et al. Reference Simanshu, Kamlekar, Wijesinghe, Zou, Zhai, Mishra, Molotkovsky, Malinina, Hinchcliffe, Chalfant, Brown and Patel2013). The net effect is a compartment that is sufficiently expandable to accommodate the C1P aliphatic chains in side-by-side fashion, while providing an optimal fit for C1P species with acyl chains of 16–18 carbons (Figs 6a and 6b ). The more complex GLTP hydrophobic compartment consists of upper and lower regions (Figs 6c–6g ). The upper compartment can adapt to accommodate both sphingolipid aliphatic chains in side-by-side fashion. However, coupled to the upper compartment region is a narrow lower region wide enough to accommodate only a single hydrocarbon chain, such as the distal part of an oleoyl or a long nervonyl acyl chain (Figs 6c–6g ) (Malinina et al. Reference Malinina, Malakhova, Kanak, Lu, Abagyan, Brown and Patel2006; Samygina et al. Reference Samygina, Popov, Cabo-Bilbao, Ochoa-Lizarralde, Goni-de-Cerio, Zhai, Molotkovsky, Patel, Brown and Malinina2011). Interestingly, GLTP point mutations to the ‘portal entrance’ that loosen the sugar headgroup anchoring of sulfated-GalCer (sulfatide) can regulate 24:1 acyl chain positioning within the hydrophobic compartment and access to the narrow lower compartment region. In wtGLTP, the long 24:1 acyl chain of 3-sulfo-GalCer localizes to the upper compartment region where it assumes a serpentine conformation that obstructs sphingoid chain entry, i.e. sphingosine-out binding (Figs 5a and 6d ). However, in D48V-GLTP, the looser anchoring of the sulfated-GalCer headgroup at the entry portal eases the conformational restrictions for the long 24:1 acyl chain within the upper compartment, facilitating entry into the distal part of the narrow lower region. The extended conformation of the 24:1 acyl chain provides space for entry of the sphingoid chain into the upper compartment region, i.e. sphingosine-in binding (Fig. 6e ) (Samygina et al. Reference Samygina, Popov, Cabo-Bilbao, Ochoa-Lizarralde, Goni-de-Cerio, Zhai, Molotkovsky, Patel, Brown and Malinina2011). When the glycolipid acyl chain is shorter (e.g. 18:1 chain), entry into the narrow lower compartment occurs, but the distal part of the lower region is not reached. The crystal structure of GLTP with bound 18:1-GlcCer (1.4 Å) shows the ability of the upper compartment region to simultaneously accommodate both Cer chains (Fig. 6c ) in side-by-side alignment (Samygina et al. Reference Samygina, Popov, Cabo-Bilbao, Ochoa-Lizarralde, Goni-de-Cerio, Zhai, Molotkovsky, Patel, Brown and Malinina2011) as initially reported for the GLTP/GSL structure involving 18:1-LacCer (Malinina et al. Reference Malinina, Malakhova, Teplov, Brown and Patel2004). The fully extended 18:1 acyl chain approaches the phenyl ring of Phe183 but is too short to insert into distal part of the narrow lower compartment (Fig. 6c ). By having a narrow lower compartment region, GLTP appears better equipped than CPTP to accommodate a wider array of acyl chain lengths associated with differing sphingolipid species. Whether other GLTP-folds possess similar or other structural differences in their hydrophobic compartments remains unanswered.
Hydrophobic compartment differences of human GLTP and CPTP. (a) Superposition of CPTP (ribbon, cyan) complexed with 16:0-C1P (space-filling, violet) and GLTP (ribbon, green) complexed with 18:1-LacCer (space-filling, yellow) with oxygen atoms colored red (PDB: 4K84 & 1SX6). (b) Superposition of 16:0-C1P (ball-and-stick, violet) and 18:1-GlcCer (ball-and-stick, yellow) in the respective hydrophobic pockets of wt-CPTP and wt-GLTP (PDB: 4K84 & 3S0K). Shaded blue and yellow outlines indicate differing adaptabilities of the CPTP and GLTP, respectively. (c) GLTP (ribbon, green) complexed with 18:1-LacCer (ball-and-stick, yellow) with nitrogen and oxygen colored blue and red, respectively. The shape of the hydrophobic pocket is outlined to show the wider upper compartment that connects to the lower narrow compartment. Phe side chains (gold) play a prominent role in forming and shaping the hydrophobic pocket. (d) Superposition of various GSL aliphatic chains within the hydrophobic pocket of wt-GLTP. Hydrophobic pocket shape is outlined to show the wider upper compartment 1 that connects to the lower narrow compartment 2. Both are collapsed in bona fide apo-GLTP (Samygina et al. Reference Samygina, Popov, Cabo-Bilbao, Ochoa-Lizarralde, Goni-de-Cerio, Zhai, Molotkovsky, Patel, Brown and Malinina2011). The glycolipid oxygen and nitrogen atoms are colored red and blue, respectively, and by specific colors for GSL aliphatic chain: green, 24:1-GalCer; lavender, 18:1-LacCer; lemon, 18:2-GalCer; and silver, extraneous hydrocarbons accompanying 8:0-LacCer, 18:2-LacCer, and ‘pseudo’ apo-GLTP. With 8:0-LacCer, the cyan color is almost completely hidden by superpositioning. The longest extraneous hydrocarbon accompanies 8:0-LacCer and is the only one entering region 1. (e) D48V-GLTP (ribbon, gold) containing bound 24:1-sulfatide (space filling, cyan) with nitrogen, oxygen, and sulfur colored blue, red, and green, respectively (PDB: 3S0I). (f) D48V-GLTP (ribbon, orange) containing bound 24:1-sulfatide (ball-and-stick, cyan) with sulfur, nitrogen, and oxygen colored green, blue, and red, respectively. The numbers identify various Phe residues that shape the hydrophobic compartment (dashed outline). In D48V-GLTP, looser anchoring of the sulfated-GalCer headgroup at the entry portal eases conformational restrictions for the long 24:1 acyl chain within the upper compartment, facilitating entry of the acyl chain into the distal part of the narrow lower compartment. The more fully extended conformation of the 24:1 acyl chain provides space for the sphingoid chain to also enter the upper compartment region, i.e. sphingosine-in binding. (g) Superposition of 18:1-GlcCer in wt-GLTP (PDB: 3S0K) and 24:1-sulfatide in D48V-GLTP (PDB: 3S0I) to show adaptability of GLTP hydrophobic compartment. The differing cis double bond positions (arrows) in the acyl chains (oleoyl, GlcCer) and (nervonoyl, sulfatide) acyl chains appear to impact compartment adaptability.
5.4 Hydrophobic compartments: pockets or tunnels?
The first crystal structures of GLTP in glycolipid-free form were not true apo-forms because of the presence of various nonglycolipid hydrocarbons in the hydrophobic compartment (Airenne et al. Reference Airenne, Kidron, Nymalm, Nylund, West, Mattjus and Salminen2006; Malinina et al. Reference Malinina, Malakhova, Teplov, Brown and Patel2004, Reference Bastiaans, Debets, Aanen, van Diepeningen, Saupe and Paoletti2006). The extraneous hydrocarbon was also observed in crystal structures of GLTP complexed with glycolipids having acyl chains too short to fill the hydrophobic compartment (Fig. 6d ) (Malinina et al. Reference Malinina, Malakhova, Kanak, Lu, Abagyan, Brown and Patel2006). These findings raised the issue of whether the extraneous hydrocarbon might satisfy a fundamental need, such as a ‘chaperone-like’ functionality, to promote native folding by GLTP. In general, the observation of extraneous hydrocarbons or ‘substitute’ amphiphiles is not unusual for GSL-binding proteins (Wright et al. Reference Wright, Zhao and Rastinejad2003) and also has been frequently observed among other lipid binding/transfer proteins (Hamilton, Reference Hamilton2004; Yoder et al. Reference Yoder, Thomas, Tremblay, Oliver, Yarbrough and Helmkamp2001). The source of extraneous hydrocarbon often has been attributed to heterologous expression in E. coli. However, in the case of GLTP, the relatively recent achievement of a bona fide crystal structure (1.5 Å) for apo-GLTP points to the polyethylene glycol used for crystallization as a likely source of the extraneous hydrocarbon (Samygina et al. Reference Samygina, Popov, Cabo-Bilbao, Ochoa-Lizarralde, Goni-de-Cerio, Zhai, Molotkovsky, Patel, Brown and Malinina2011). With other GLTP-folds (HET-C2, CPTP, and ACD11) for which X-ray structures now exist (Kenoth et al. Reference Kenoth, Simanshu, Kamlekar, Pike, Molotkovsky, Benson, Bergen, Prendergast, Malinina, Venyaminov, Patel and Brown2010; Simanshu et al. Reference Simanshu, Kamlekar, Wijesinghe, Zou, Zhai, Mishra, Molotkovsky, Malinina, Hinchcliffe, Chalfant, Brown and Patel2013, Reference Simanshu, Zhai, Munch, Hofius, Markham, Bielawski, Bielawska, Malinina, Molotkovsky, Mundy, Patel and Brown2014), extraneous hydrocarbon is absent. The implication is that the nascent GLTP-fold has no absolute need for extraneous lipid to achieve native folding. However, the finding of extraneous hydrocarbon only in GLTP does support the idea of the hydrophobic compartment of this particular GLTP-fold having the capacity for both pocket- and tunnel-like functionality. The latter function becomes possible when the bottom of the hydrophobic pocket is ‘uncorked’. In human GLTP, Leu4 is ideally positioned to ‘cork’ or ‘uncork’ a portal located at the bottom of the compartment, enabling entry of extraneous hydrocarbon while avoiding upper portal opening near the sugar recognition center. An indicator of N-terminal disorder/order appears to be stacking of His7 near the N-terminus against His29 of the α-helix 1/2 loop (3.4 Å). The ordering effect of this stacking interaction on the GLTP N-terminus facilitates the corking action by Leu4. It is noteworthy that the His7/His29 stacking interaction is evident in the bona fide crystal structure of apo-GLTP (Samygina et al. Reference Samygina, Popov, Cabo-Bilbao, Ochoa-Lizarralde, Goni-de-Cerio, Zhai, Molotkovsky, Patel, Brown and Malinina2011). Current evidence indicates that the N-terminal regions of other GLTP-folds tend to be more structurally complex and ordered than that of GLTP, helping to seal the bottom of their hydrophobic compartments to generate pocket-like functionality. Whether disorder/order and/or altered positioning of the N-terminus plays a regulatory role in the in vivo functionality of any GLTP-fold remains unanswered.
5.5 Conformational changes induced by sphingolipid uptake
Crystallographic B-factor distribution analyses and superpositioning of the apo- and holo- structures of wtGLTP and wtCPTP currently provide the most definitive insights into the molecular structural changes that occur in response to sphingolipid uptake. In GLTP, the sugar headgroup recognition residues (Asp48, Asn52, Lys55, Trp96, and His140) are more fixed and undergo minimal conformational change upon glycolipid binding; whereas, interhelical loops α1-α2 and α6–α7, helix 6 and possibly helix 7 form a cleft-like gate which appears to open and close to let the lipid chains in and out.
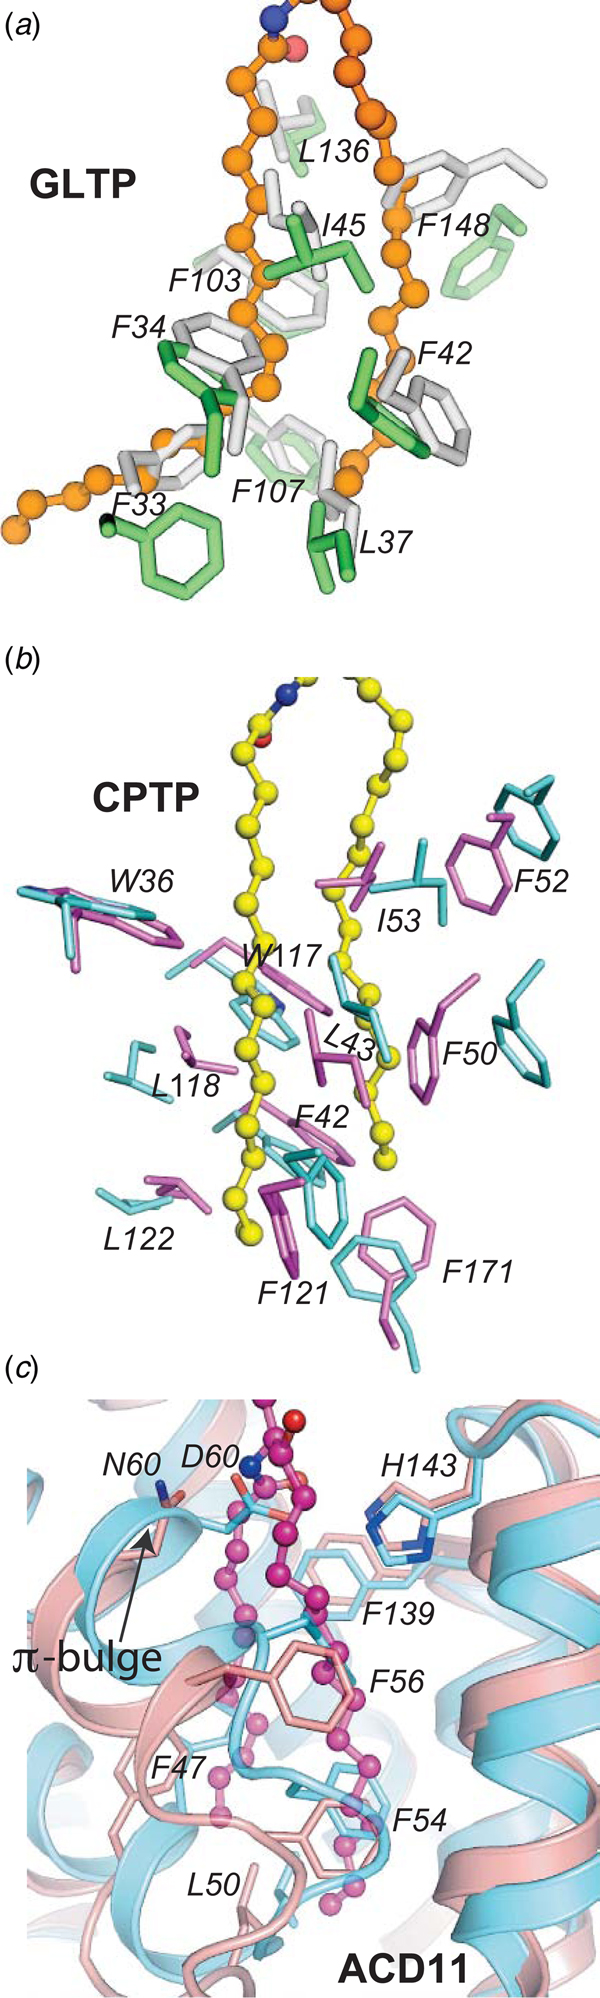
Superposition of the apo-GLTP and glycolipid-bound GLTP structures reveals essentially no difference in the headgroup recognition centers but provides clear evidence of localized conformational differences related to the hydrophobic compartment. The differences are associated with interhelical loops α1–α2 and α6–α7, helix α6 and the N-terminus of helix α2. The conformational consequences of glycolipid acquisition are: (i) bending of α2-helix; (ii) rearrangement of the α1–α2 loop, accompanied by the appearance of a new 310- helix near the N-terminus of α2-helix; and (iii) shortening of the C-terminus of α6-helix that is compensated by formation of a new 310- helix. Glycolipid acquisition by GLTP results in α1–α2 loop residues (e.g. Phe 34, Ile45, Val41, Phe42, and Leu37) and α6-helix residues (e.g. Ile147, Phe148, Ala151, and Leu152), repositioning with respect to each other, while the side chains of Phe33, Phe148, and Leu152 rotate around their Cα–Cβ bonds to assume ‘open door’ conformations compared to their more ‘closed door’ orientations in apo-GLTP (Fig. 7a ). The study by Samygina et al. (Reference Samygina, Popov, Cabo-Bilbao, Ochoa-Lizarralde, Goni-de-Cerio, Zhai, Molotkovsky, Patel, Brown and Malinina2011) has provided exquisitely detailed insights into the molecular conformational changes associated with the opening and closing of the Phe148 ‘door’ in GLTP. This ‘swinging door’ action of Phe148 is evident in all GLTP/GSL complexes reported to date (Malinina et al. Reference Malinina, Malakhova, Teplov, Brown and Patel2004, Reference Malinina, Malakhova, Kanak, Lu, Abagyan, Brown and Patel2006; Samygina et al. Reference Samygina, Popov, Cabo-Bilbao, Ochoa-Lizarralde, Goni-de-Cerio, Zhai, Molotkovsky, Patel, Brown and Malinina2011, Reference Samygina, Ochoa-Lizarralde, Popov, Cabo-Bilbao, Goni-de-Cerio, Molotkovsky, Patel, Brown and Malinina2013) except for the GLTP/GM3 complex (Airenne et al. Reference Airenne, Kidron, Nymalm, Nylund, West, Mattjus and Salminen2006). In apo-GLTP, the Phe148 ‘closed door’ conformation is aided by hydrophobic contacts with side chains of Tyr132, Phe42, and His140. Opening of this Phe148 ‘door’ to accommodate GSL aliphatic chain(s) requires headgroup anchoring of GSL and disruption of hydrophobic contacts involving Phe148/His140 and Phe148/Phe42. To attain hydrogen-bonding with the Cer amide group, His140 moves slightly upward and away from Phe148 but still maintains hydrogen bonding with the phenyl hydroxyl group of Tyr132. To compensate the energy loss associated with disruption of the hydrophobic contacts, Phe148 swings into a stacking interaction with the Tyr132 phenyl ring to achieve the ‘open door’ conformation. This movement also helps liberate Phe42, creating additional space for sphingosine chain encapsulation. Thus, hydrogen-bonding of the Cer amide group with His140 is likely a critical initial step for triggering the mechanistic process that promotes accommodation of sphingosine within GLTP hydrophobic pocket. The essential role of His140 in GLTP action is supported by the nearly complete inactivation observed in H140L–GLTP (Malinina et al. Reference Malinina, Malakhova, Teplov, Brown and Patel2004). The net result of all movements and rearrangements is opening and expansion of the hydrophobic pocket when GLTP acquires glycolipid from the membrane.
Conformational changes associated with sphingolipid uptake by GLTP, and CPTP, and ACD11. (a) Comparison of side-chain positions in apo- (silver) and holo-forms (green) of the GLTP hydrophobic compartments. Glycolipid chains (orange) are shown in ball-and-stick representation. (b) Comparison of side-chain positions in apo- (lavender) and holo-forms (cyan) of the CPTP hydrophobic compartments. C1P chains (yellow) are shown in ball-and-stick representation. (c) Comparison of side-chain positions in apo- (cyan) and holo-forms (cameo) of the ACD11 hydrophobic compartments. C1P chains (magenta) are shown in ball-and-stick representation.

B-factor distribution analyses of the apo- and holo-forms of CPTP show the cationic residues of the phosphate recognition site to be fixed and undergo minimal conformational change upon C1P binding (Simanshu et al. Reference Simanshu, Kamlekar, Wijesinghe, Zou, Zhai, Mishra, Molotkovsky, Malinina, Hinchcliffe, Chalfant, Brown and Patel2013). In contrast, the interhelical loops between α1–α2 and α6–α7 are most flexible, again consistent with a cleft-like gating mechanism for Cer chain entry or exit. Superpositioning of apo- and 16:0-C1P/CPTP structures (rmsd 1.4 Å) also shows Lys60, Arg106, and Arg110 nearly identically positioned in the positively charged phosphate recognition sites. However, certain α-helices show relative displacements that affect their rotational and lateral packing to produce conformational differences for Phe52, Ile53, Trp36, and Trp117 (Fig. 7b ). Also, many Leu and Phe residues are repositioned. The net effect is expansion of a collapsed hydrophobic pocket (SA volume = 40 Å3) to tightly ensheath the distal half of 16:0-C1P aliphatic chains (SA volume of 16:0-C1P/CPTP complex = 364 Å3).
The situation for ACD11 is even more complex because this GLTP-fold contains a π-bulge near the lipid-binding cleft (Simanshu et al. Reference Simanshu, Zhai, Munch, Hofius, Markham, Bielawski, Bielawska, Malinina, Molotkovsky, Mundy, Patel and Brown2014). At the molecular level, π-bulge formation at Asp60 results in the nonpolar phenyl ring of Phe56 projecting into the hydrophobic pocket to function as a ‘portal door’ that swings open during lipid acyl chain uptake (Fig. 7c ). Phe54 orients into the hydrophobic pocket providing conformational stability to apo-ACD11 in the absence of a lipid acyl chain. Insertion and encapsulation of the C1P hydrocarbon chains by the ACD11 hydrophobic pocket result in disappearance of the intra-helical π-bulge. This π-helix to α-helix structural transition involves large conformational changes for the side-chains of several residues, i.e. Phe47, Phe54, Phe56, and Leu50, which move toward the protein surface. A ‘peristaltic-like shift’ of Ala57 to occupy the position of Phe56, as well as Phe54 being pushed outward accompanies transformation from π-bulge to α-helix, enabling hydrophobic pocket formation/expansion sufficient to accommodate either one or both hydrocarbon chains of Cer (Fig. 7c ). These residue shifts effectively expand the hydrophobic pocket and create space to accommodate the hydrocarbon chains of C1P. The key role played by Phe56 of helix α2 in functioning as a ‘portal door’ represents a fundamental difference between the ACD11 GLTP-fold and human GLTP, which uses an ‘oppositely located’ Phe (Phe148 of α6-helix) as a main ‘portal door’ that swings open during hydrocarbon chain insertion (Malinina et al. Reference Malinina, Malakhova, Teplov, Brown and Patel2004; Samygina et al. Reference Samygina, Popov, Cabo-Bilbao, Ochoa-Lizarralde, Goni-de-Cerio, Zhai, Molotkovsky, Patel, Brown and Malinina2011).
5.6 Low-affinity lipid interactions resulting in nonproductive transfer
When the glycolipid ligand is severely modified and has no acyl-amide moiety to link a single short alkyl chain (e.g. hexanoyl chain) to the sugar linked to the sugar (e.g. hexyl glucoside), GLTP-binding affinity is reduced by ~200–300-fold (Zhai et al. Reference Zhai, Malakhova, Pike, Benson, Bergen, Sugar, Malinina, Patel and Brown2009). The structure of GLTP with bound hexyl glucoside shows the sugar headgroup localized to the correct site on GLTP but failure of the short alkyl chain to engage in a ‘transfer viable’ way (Malinina et al. Reference Malinina, Malakhova, Kanak, Lu, Abagyan, Brown and Patel2006). At the molecular level, only limited outwards movement is observed for the α2-helix N-terminal segment as well as the adjacent α1/α2 loop in the GLTP/hexyl glucoside complex. Also no shifting of the α2-helix along its axis and no rotation of α6-helix are observed keeping Phe148 in a portal-obstructing, swung-in position that partially blocks the hydrophobic pocket.
In CPTP, the molecular basis of PA non-transfer is illustrated by structural determination of CPTP complexed with di12:0-PA (Simanshu et al. Reference Simanshu, Kamlekar, Wijesinghe, Zou, Zhai, Mishra, Molotkovsky, Malinina, Hinchcliffe, Chalfant, Brown and Patel2013). PA occupies the same binding site with its phosphate group interacting with the same positively charged residues (Lys60, Arg97, Arg106, and Arg110) as for C1P. However, the hydrogen bond network is distorted and Lys60 hydrogen bonding is single rather than bifurcated. The C1-linked chain localizes in the hydrophobic pocket. The C2-linked chain assumes a sphingosine-out like conformation. Notably, the lack of the acyl-amide moiety results in no hydrogen bonding with D56, distorting the positioning of both PA chains. The distortions obstruct K60 interaction with the bonding O1 atom of phosphate, further loosening PA binding. Superposition of the lipid phosphates in di12:0-PA/CPTP and 12:0-C1P/CPTP illustrates the differences, which lead to much lower SA volume (110 Å3 versus 261 Å3) for di12:0-PA/CPTP compared with sphingosine-out 12:0-C1P/CPTP. The distorted interaction mitigates PA transfer by CPTP. The lack of an acyl-amide linkage in S1P may also contribute to its non-transfer by CPTP.
5.7 Differences in ceramide transfer protein (CERT) architecture and uptake of Cer
The GLTP-fold appears to be evolutionarily designed to accommodate a Cer moiety that is either glycosylated or phosphorylated. The polar headgroup requirement appears to be essential for the GLTP-fold to function as free Cer is neither bound nor transferred. Rather in vivo binding/transfer of Cer is carried out by CERT which consists of an N-terminal PH domain, a middle coiled domain containing a phenylalanines-in-an-acidic-tract (FFAT) motif, and a C-terminal START domain that binds Cer (Hanada, Reference Hanada2006). The CERT START domain lipid cavity uses an α/β-fold built around an incomplete U-shaped β-barrel to form a helix-grip structure (Kudo et al. Reference Kudo, Kumagai, Tomishige, Yamaji, Wakatsuki, Nishijima, Hanada and Kato2008). The long cavity extending through the center of the CERT START domain is composed of curved β-sheets and covered by three α-helices and two Ω loops. In contrast to the conformational adaptability and flexibility of the hydrophobic pocket of the GLTP-fold, the CERT cavity is large (~2016 Å3), preexisting, and amphiphilic, i.e. lined by 26 nonpolar and 10 polar and/or charged residues. Five of the polar/charged residues are buried deep in the cavity where they form hydrogen bonds with the hydroxyl and amide groups of the Cer headgroup region, while the aliphatic chains point back toward the surface. Structural studies of CERT complexed with Cer species having differing length acyl chains show both the sphingosine and acyl chains are completely buried within the START-binding cavity, but with unoccupied cavity space persisting near the top of the START cavity when the acyl chain is short (e.g. 6:0-Cer) (Kudo et al. Reference Kudo, Kumagai, Tomishige, Yamaji, Wakatsuki, Nishijima, Hanada and Kato2008). No extra space exists at the bottom of the START cavity to accommodate a polar group bulkier than the C1 hydroxyl headgroup of Cer. It is clear that specific recognition and binding of Cer by the START domain of CERT differs completely from sphingolipid headgroup recognition centers of the GLTP-fold, which contains a surface cavity that enables direct access of the bulky, hydrated phosphate or sugar headgroup. The reversed orientation of Cer in CERT, with the Cer headgroup buried deeper than its aliphatic chains inside the START-binding cavity compared with sphingolipids in GLTP-folds, indicates a fundamentally different mechanism of Cer uptake/release during membrane interaction.
6. Other structure–function features
6.1 Intramolecular disulfide bridging not required for stability or activity
Mammalian GLTPs have three cysteine (Cys) residues. Their presence was originally determined by chemical methods (Abe & Sasaki, Reference Abe and Sasaki1989a) prior to X-ray structural determination of mammalian GLTP. Intramolecular disulfide formation by two buried Cys residues reportedly optimized glycolipid binding and stimulated a 100% increase in GLTP transfer activity (Abe & Sasaki, Reference Abe and Sasaki1989b). The transfer activating effect of chemically induced intramolecular disulfide formation in vitro also was reported by Airenne et al. (Reference Airenne, Kidron, Nymalm, Nylund, West, Mattjus and Salminen2006) while acknowledging that the bovine GLTP structure showed all three Cys residues too far apart to form an intramolecular disulfide, in agreement with human GLTP structural data (Malinina et al. Reference Malinina, Malakhova, Teplov, Brown and Patel2004). The authors speculated that movement of α8-helix might bring Cys176 sufficiently close to Cys112 of α4-helix for intramolecular disulfide bridging to regulate GLTP activity (Airenne et al. Reference Airenne, Kidron, Nymalm, Nylund, West, Mattjus and Salminen2006; Tuuf & Mattjus, Reference Tuuf and Mattjus2014). Examination of the sequence homology and structural location/topology of Cys residues in other GLTP homologs/orthologs shows no conserved location or placement pattern. Also, inter-Cys distances for the various GLTP-folds range from 8 to 35 Å (Table 1). Finally, FAPP2–GLTPH contains only one Cys residue (Cys339) but is fully capable of binding and transferring simple neutral GSLs (Kamlekar et al. Reference Kamlekar, Simanshu, Gao, Kenoth, Pike, Prendergast, Malinina, Molotkovsky, Venyaminov, Patel and Brown2013). Thus, if an intramolecular disulfide really does form in vivo, it appears likely to be limited to mammalian GLTPs and probably is not a general feature of the GLTP-fold.
Cysteine locations in GLTP-folds and inter-cysteine (S-S) distances

Thermally driven denaturation profiles measured for human GLTP, HET-C2, and FAPP2–GLTPH support the absence of intramolecular disulfide bridging. Far-ultraviolet (UV) circular dichroism (CD) analyses (190–250 nm) show wtGLTP, HET-C2, and FAPP2–GLTPH to have α-helically dominated secondary structures characterized by highly cooperative, thermally induced, unfolding temperature transition midpoints of ~54, 49, and 40.5 °C, respectively, with changes induced by glycolipid binding of ~1.5 °C near neutral pH (Kamlekar et al. Reference Kamlekar, Gao, Kenoth, Molotkovsky, Prendergast, Malinina, Patel, Wessels, Venyaminov and Brown2010, Reference Kamlekar, Simanshu, Gao, Kenoth, Pike, Prendergast, Malinina, Molotkovsky, Venyaminov, Patel and Brown2013; Kenoth et al. Reference Kenoth, Simanshu, Kamlekar, Pike, Molotkovsky, Benson, Bergen, Prendergast, Malinina, Venyaminov, Patel and Brown2010, Reference Kenoth, Kamlekar, Simanshu, Gao, Malinina, Prendergast, Molotkovsky, Patel, Venyaminov and Brown2011). Comparable experimental stability measurements with other GLTP homologs have yet to be carried out.
To date, the most comprehensive insights into the structural parameters contributing to the stabilization of a GLTP-fold come from studies of HET-C2 conformational changes driven by changing pH (Kenoth et al. Reference Kenoth, Kamlekar, Simanshu, Gao, Malinina, Prendergast, Molotkovsky, Patel, Venyaminov and Brown2011). In this case, His residues play a major role in controlling the pH-inducible conformational changes triggered by low pH. Mapping of residue side-chain interactions that contribute to the intramolecular folding stability of HET-C2 reveals salt bridges (eight interchain; three intrahelix), water bridges (three interchain), aromatic π-π stacking, and cation-π (three interchain) interactions. Comparison with various other GLTP-folds, for which experimental structural data exist (Fig. 8), reveals a universally shared underpinning for stabilizing the sphingolipid headgroup recognition centers via π-π stacking and cation–π interactions (Dougherty, Reference Dougherty2013; Egli, Reference Egli and Comba2010; Gallivan & Dougherty, Reference Gallivan and Dougherty1999). The conserved π-π stacking interaction involves the planar guanidinium moiety of Arg (α4-helix) and the aromatic ring of Tyr or His residues that project from the α5/α6 loop (Figs 8a–8f ). In all glycolipid-specific GLTP homologs, this same conserved Arg residue (α4-helix) also participates in a cation-π interaction to support the Trp indole ring in the binding site from beneath (Figs 8a and 8b ). In ACD11 (Figs 8e and 8g ), an additional cation–π interaction helps control C-terminus conformation occurs between Arg92 and Trp206.
Conserved cation–π and aromatic stacking (π–π) interactions that stabilize the sphingolipid headgroup recognition site in GLTP motifs. (a) Human GLTP (green, ribbon representation) complexed with 18:1 GlcCer (orange stick representation). Trp96 (α4-helix) position is stabilized from beneath via cation–π interaction with Arg99 (α4-helix) which maintains orientation by π–π stacking with Tyr139 (α5–α6 loop). (b) Zoomed enlargement of side-chain interactions in a) (viewed from beneath) and superposition with residues (Trp109, Arg112, His146; yellow stick representation) at equivalent positions in the fungal GLTP homolog, HET-C2. (c) Human CPTP (cyan, ribbon representation) complexed with 16:0-C1P (blue stick representation). Arg110 (α4-helix) position is stabilized via π–π stacking (or perhaps cation–π interaction) with Arg113 (α4-helix) which maintains orientation by π–π stacking with Tyr149 (α5-α6 loop). (d) Zoomed enlargement of side-chain interactions in c) (viewed from beneath) including additional π–π stacking interactions involving Arg110, Arg106, and Arg97 and located nearby. (e) Arabidopsis ACD11 (cameo, ribbon representation) complexed with 16:0-C1P (blue stick representation) by modeling. Arg103 (α4-helix) positioning might not be stabilized by cation–π interaction with Arg106 (α4-helix) which maintains orientation by π–π stacking with His142 (α5–α6 loop). (f) Zoomed enlargement of side-chain interactions involving π–π stacking between Arg106 (α4-helix) and His142 (α5–α6 loop) in e) (viewed from beneath). (g) ACD11 positioning of C-terminus (Trp206) appears to be stabilized by cation–π interaction with Arg92.

7. Membrane interaction & regulation by lipid composition
7.1 Membrane interaction region: tryptophan involvement
The surface features of mammalian apo-GLTP and GLTP/glycolipid complexes revealed by X-ray analyses and by computed interaction propensities support the idea of a membrane interaction region surrounding the glycolipid-binding site (Kamlekar et al. Reference Kamlekar, Gao, Kenoth, Molotkovsky, Prendergast, Malinina, Patel, Wessels, Venyaminov and Brown2010; Malinina et al. Reference Malinina, Malakhova, Teplov, Brown and Patel2004, Reference Malinina, Malakhova, Kanak, Lu, Abagyan, Brown and Patel2006; West et al. Reference West, Nylund, Slotte and Mattjus2006; Zhai et al. Reference Zhai, Malakhova, Pike, Benson, Bergen, Sugar, Malinina, Patel and Brown2009). The interaction region has many nonpolar amino acids along with three Trp and multiple Tyr and Lys residues (e.g. Lys163, Tyr157, His120, Tyr153, Lys146, Trp142, Lys208, Tyr207, Lys87, Tyr81, Lys66, Lys55, and Lys46) that form a ring around the region (Fig. 9a ). These residues function to properly orient the ‘gate’ region and adjacent sugar headgroup recognition center for membrane interaction. They also could help drive the interfacial docking needed to create a favorable environment for protein conformational changes that enhance the binding and desorption of glycolipids from the membrane into GLTP. The residues are typical of membrane interaction motifs found in amphitropic proteins that translocate from the cytosol to the membrane to function (Killian & von Heijne, Reference Killian and von Heijne2000; White & Wimley, Reference White and Wimley1998). The GLTP-fold spatially organizes the residues in a way that differs from other membrane lipid-binding motifs, i.e. the protein kinase C homology-1 and -2 (C1, C2) domains of phospholipases and protein kinases, and the FYVE, PH, and phox (PX) domains that bind to PI derivatives in membranes (Cho & Stahelin, Reference Cho and Stahelin2005; Kutateladze, Reference Kutateladze2010; Lemmon, Reference Lemmon2008; Stahelin, Reference Stahelin2009; Stahelin et al. Reference Stahelin, Scott and Frick2014). These membrane lipid targeting motifs, i.e. lipid-binding domains, bind the lipid head group while the lipid aliphatic chains remain embedded in the membrane bilayer. In contrast, in GLTP-folds, the hydrophobic pocket envelops the sphingolipid aliphatic chains.
Models for GLTP interaction with membranes and for regulation of pro-inflammatory eicosanoid production by CPTP. (a) Model for GLTP orientation and positioning with the membrane. Residues involved in initial docking of GLTP with the membrane interface were identified using the orientation of proteins in membranes (OPM) computational approach (Lomize et al. Reference Lomize, Pogozheva and Mosberg2011). Lipid molecules, comprising half of the membrane, are shown with wavy lines (black) to represent the lipid hydrocarbon chains and elliptical headgroups (green-fill). Also shown are GLTP helices (red ribbons), Trp (cyan), and important other side-chain residues (black) for membrane interaction, and 24:1-GalCer (yellow-stick; sphingosine-out mode). In this mode, the sphingoid chain is shown exiting the PC matrix, while the 24:1 acyl chain extends (away from view) roughly parallel with the protein–membrane interface, before assuming a serpentine conformation deep in the hydrophobic pocket (see Fig. 5a for another view). The membrane docking positions for HET-C2, FAPP2–GLTPH, CPTP, and ACD11 are expected to be similar (Kamlekar et al. Reference Kamlekar, Simanshu, Gao, Kenoth, Pike, Prendergast, Malinina, Molotkovsky, Venyaminov, Patel and Brown2013; Kenoth et al. Reference Kenoth, Simanshu, Kamlekar, Pike, Molotkovsky, Benson, Bergen, Prendergast, Malinina, Venyaminov, Patel and Brown2010; Simanshu et al. Reference Simanshu, Kamlekar, Wijesinghe, Zou, Zhai, Mishra, Molotkovsky, Malinina, Hinchcliffe, Chalfant, Brown and Patel2013, Reference Simanshu, Zhai, Munch, Hofius, Markham, Bielawski, Bielawska, Malinina, Molotkovsky, Mundy, Patel and Brown2014). (b) Model for CPTP intracellular regulation of eicosanoid production. C1P is normally synthesized by CERK which can concentrate in the trans-Golgi network vicinity via its PH domain. To produce C1P, CERK uses Cer transported from the ER by CERT that also contains a targeting PH domain. After synthesis in the trans-Golgi, C1P is transported to subcellular destinations by CPTP and possibly by vesicular trafficking. RNAi knockdown of CPTP (shown by red Xs) leads to accumulation and elevation of C1P at the Golgi complex, a condition that activates soluble cytosolic phospholipase A2α (cPLA2α), and generates arachidonic acid needed for downstream elevations of pro-inflammatory eicosanoids. CPTP overexpression has the opposite effect on lipid levels including suppression of pro-inflammatory eicosanoid production (see Supplementary Figures S12 and S14 in Simanshu et al. Reference Simanshu, Kamlekar, Wijesinghe, Zou, Zhai, Mishra, Molotkovsky, Malinina, Hinchcliffe, Chalfant, Brown and Patel2013). cPLA2α activation occurs by translocation from the cytoplasm and/or cis-Golgi (red arrows) and enhanced anchoring at the TGN via CERK-generated C1P. COX-1 and inducible COX-2 which use arachidonic acid to produce pro-inflammatory prostaglandins, also concentrate in the TGN vicinity during stimulation. For clarity, other pathways of eicosanoid generation, that is, LOX (cytoplasmic 5-lipoxygenase) and CYP (ER-associated cytochrome P450), are not depicted. Also not depicted is Golgi cisternal stack fragmentation induced by CPTP RNAi for 24 h.

Among GLTP homologs, three intrinsic Trp residues of human GLTP have been studied most intensively. Sequence alignments show all three of these Trp residues to be conserved among vertebrates. In human GLTP, all three reside on or slightly below the surface of the protein where they could potentially help form a membrane-interaction site. There is universal agreement that Trp142, which projects from α-helix6, is involved in the initial docking of GLTP to the membrane (Kamlekar et al. Reference Kamlekar, Gao, Kenoth, Molotkovsky, Prendergast, Malinina, Patel, Wessels, Venyaminov and Brown2010; Malinina et al. Reference Malinina, Malakhova, Teplov, Brown and Patel2004; Neumann et al. Reference Neumann, Opacic, Wechselberger, Sprong and Egmond2008; Ohvo-Rekilä & Mattjus, Reference Ohvo-Rekilä and Mattjus2011; Rao et al. Reference Rao, Chung, Pike and Brown2005; West et al. Reference West, Nylund, Slotte and Mattjus2006; Zhai et al. Reference Zhai, Malakhova, Pike, Benson, Bergen, Sugar, Malinina, Patel and Brown2009). The conclusion is based on both experimental and computational modeling that optimize the spatial arrangement of peripheral membrane protein structures with respect to lipid bilayers, i.e. Orientations of Proteins in Membranes Database, (http://opm.phar.umich.edu/families.php?family=117) (Lomize et al. Reference Lomize, Pogozheva and Mosberg2011). Trp142 most likely functions as a shallow-penetration, interfacial tether that aids in the oriented partitioning of GLTP onto the membrane surface. Sequence alignments show conservation of Trp at this position in the vast majority of GLTP homologs. The only known exception is in fungal HET-C2 where Phe149 occurs at the same position in α-helix6 and with Trp at the C-terminus (Kenoth et al. Reference Kenoth, Simanshu, Kamlekar, Pike, Molotkovsky, Benson, Bergen, Prendergast, Malinina, Venyaminov, Patel and Brown2010, Reference Kenoth, Kamlekar, Simanshu, Gao, Malinina, Prendergast, Molotkovsky, Patel, Venyaminov and Brown2011).
The Trp located in the glycolipid sugar headgroup recognition center (Trp96 in human GLTP) is universally conserved in all known glycolipid-specific GLTP homologs, including vertebrates, invertebrates, plants, fungi, and unicellular algae (e.g. G. sulphuraria). This Trp residue is directly involved in glycolipid binding (Kamlekar et al. Reference Kamlekar, Gao, Kenoth, Molotkovsky, Prendergast, Malinina, Patel, Wessels, Venyaminov and Brown2010; Malinina et al. Reference Malinina, Malakhova, Teplov, Brown and Patel2004; West et al. Reference West, Nylund, Slotte and Mattjus2006; Zhai et al. Reference Zhai, Malakhova, Pike, Benson, Bergen, Sugar, Malinina, Patel and Brown2009). Although the location in the glycolipid-binding site appears to be favorable for membrane interaction, current data indicate that this Trp, which forms the bottom of the surface depression comprising the sugar headgroup recognition center, is locked into place, perhaps restricting functionality to a secondary role in membrane interaction (Kamlekar et al. Reference Kamlekar, Gao, Kenoth, Molotkovsky, Prendergast, Malinina, Patel, Wessels, Venyaminov and Brown2010, Reference Kamlekar, Simanshu, Gao, Kenoth, Pike, Prendergast, Malinina, Molotkovsky, Venyaminov, Patel and Brown2013; Kenoth et al. Reference Kenoth, Simanshu, Kamlekar, Pike, Molotkovsky, Benson, Bergen, Prendergast, Malinina, Venyaminov, Patel and Brown2010; Zhai et al. Reference Zhai, Malakhova, Pike, Benson, Bergen, Sugar, Malinina, Patel and Brown2009).
Functional evaluation of the third Trp residue (Trp85 in human GLTP) has yielded varying results depending upon the point mutational strategy employed. Use of a double-mutation approach involving replacement of Trp with Phe left only W85F/W142F-GLTP active, obstructing insight into Trp85 functionality (West et al. Reference West, Nylund, Slotte and Mattjus2006). Owing to the highly nonpolar nature of Phe, Kamlekar et al. (Reference Kamlekar, Gao, Kenoth, Molotkovsky, Prendergast, Malinina, Patel, Wessels, Venyaminov and Brown2010) replaced Trp residues with both Phe and Tyr which shares Trp's affinity for the membrane interfacial region. Compared with wtGLTP, the single Trp mutant, W96Y, retains 85% activity; whereas the double Trp mutants, W85Y–W96F and W96F–W142Y, retain 42 and 90% activities consistent with relatively unaltered CD spectroscopy profiles and enabling insights into Trp85 functionality. The X-ray structure shows Trp85 (α3–α4 loop) projecting toward the protein interior by virtue of interacting with Thr91, stacking against Pro86 (cis conformer), and undergoing cation–π interaction with Lys78. The net effect of this constrained, sandwiched position for Trp85 is strong quenching of fluorescence and limited access to the protein surface. The findings are consistent with Trp85 playing a key role in maintaining proper GLTP folding and stability rather than being involved in membrane interaction. This conclusion is supported by the observation of Trp in the α3–α4 loop (Trp85 in human GLTP) being observed only in vertebrate GLTPs even though nonvertebrate GLTP homologs (e.g. HET-C2) are fully viable GLTPs.
It is noteworthy that the electrostatic profiles for the protein surface regions surrounding the sphingolipid-binding sites and encompassing the putative membrane interaction sites differ among known GLTP homologs (Brown & Mattjus, Reference Brown and Mattjus2007; Simanshu et al. Reference Simanshu, Zhai, Munch, Hofius, Markham, Bielawski, Bielawska, Malinina, Molotkovsky, Mundy, Patel and Brown2014). This observation suggests the presence of various anionic lipids (phosphatidylserine (PS), phosphatidylglycerol (PG), phosphatidylinositol (PI), and PA in membranes could differentially regulate the membrane interaction responses of various GLTP homologs.
7.2 Regulation by membrane lipid composition and packing
There is limited new publication in this topic area for GLTP and GLTP homologs. To avoid duplication of discussions already presented in earlier GLTP reviews (e.g. Brown & Mattjus, Reference Brown and Mattjus2007; Mattjus, Reference Mattjus2009; Tuuf & Mattjus, Reference Tuuf and Mattjus2014), the focus here will be on issues not addressed previously. The secondary structure detected by far-UV-CD in GLTP, HET-C2, and FAPP2–GLTPH is marginally affected by interaction with vesicles lacking or containing glycolipid (Kamlekar et al. Reference Kamlekar, Gao, Kenoth, Molotkovsky, Prendergast, Malinina, Patel, Wessels, Venyaminov and Brown2010, Reference Kamlekar, Simanshu, Gao, Kenoth, Pike, Prendergast, Malinina, Molotkovsky, Venyaminov, Patel and Brown2013; Kenoth et al. Reference Kenoth, Simanshu, Kamlekar, Pike, Molotkovsky, Benson, Bergen, Prendergast, Malinina, Venyaminov, Patel and Brown2010). However, near-UV-CD, which reports environmentally induced optical activity of Trp/Tyr, reveals altered signal in vesicles lacking glycolipid compared with vesicles containing glycolipid, especially for FAPP2–GLTPH when the vesicles contained negatively charged PA (Kamlekar et al. Reference Kamlekar, Simanshu, Gao, Kenoth, Pike, Prendergast, Malinina, Molotkovsky, Venyaminov, Patel and Brown2013). Collectively, the CD data imply that lipid compositional changes to phospholipid membranes may destabilize GLTP-fold tertiary structure without producing major alterations in secondary structure. The membrane interfacial environment appears to trigger conformational changes that can facilitate access to the glycolipid-binding pocket, while the presence of glycolipid in the vesicles counteracts the destabilizing effect, reflecting stability gained by glycolipid uptake into the binding pocket. Additional studies are needed to gain more insight.
Zhai et al. (Reference Zhai, Momsen, Malakhov, Boldyrev, Momsen, Molotkovsky, Brockman and Brown2013) recently made use of an innovative, custom-built, microfluidics-based surface balance, developed by Howard Brockman and co-workers (Brown & Brockman, Reference Brown and Brockman2007; Hoang et al. Reference Hoang, Malakhov, Momsen and Brockman2006; Momsen et al. Reference Momsen, Mizuno, Lowe and Brockman2005), that simultaneously measures surface pressure and fluorescence via a Wilhelmy nichrome wire and a laser-coupled fiber optic cable/diode array platform. GLTP-mediated desorption kinetics of fluorescent glycolipid (tetramethyl-boron dipyrromethene (BODIPY)-label) from lipid monolayers was investigated when lipid packing was systematically controlled to reproduce conditions found in either nonstressed bilayers or high-curvature vesicles, a topic of renewed and timely interest (Brown, Reference Brown2012; Chong et al. Reference Chong, Taneva, Lee and Cornell2014; Huang & Ramamurthi, Reference Huang and Ramamurthi2010). At biomembrane-like packing (30–35 mN m−1), GLTP uptake of BODIPY–glycolipid from POPC monolayers was nearly nonexistent but could be induced by reducing surface pressure to mirror packing in curvature-stressed bilayers. In contrast, 1-palmitoyl-2-oleoyl phosphatidylethanolamine (POPE) matrices supported robust BODIPY-glycolipid uptake by GLTP at both high and low surface pressures. Negatively charged cytosol-facing lipids, i.e. PA and PS, also supported BODIPY-glycolipid uptake by GLTP at high surface pressure. Remarkably, including both 1-palmitoyl-2-oleoyl-sn-glycero-3-phosphate (POPA) (5 mol%) and POPE (15 mol%) in POPC synergistically activated GLTP at high surface pressure. The findings were unexpected because earlier studies showed decreased GLTP transfer of glycolipid when highly curved POPC vesicles contain negatively charged phospholipid (Mattjus et al. Reference Mattjus, Pike, Molotkovsky and Brown2000; Rao et al. Reference Rao, Chung, Pike and Brown2005). Thus, high bilayer curvature appears to affect the interaction between GLTP and negatively charged phospholipid. Also high curvature in bilayers lacking negatively charged phospholipid is not the only membrane parameter able to stimulate GLTP interaction with a fluid phase lipid matrix. Dramatically elevated (~7-fold) GLTP action is induced when planar fluid-phase PC matrices contain physiologically relevant levels of POPE (15 mol%) and POPA (5 mol%). Thus, lipid headgroup chemical composition and the environment produced when different lipids mix can be important inducers of GLTP action.
Consideration of the physicochemical differences among the polar headgroups of the phosphoglycerides provides insights. The larger well-hydrated headgroup of PC imparts a cylindrical molecular shape that results in bilayer formation in excess water. In a POPC matrix, the molecular lateral stress profile (from ‘head to toe’) is less severe than in PE or PA matrices where the diglyceride regions limit close packing and leave more free area for the smaller and less hydrated headgroups (van den Brink-van der Laan et al. Reference van den Brink-van der Laan, Killian and de Kruijff2004). In a planar PC matrix, the lateral pressure profile of incorporated PE manifests itself as curvature-stress ‘frustration’ (Frolov et al. Reference Frolov, Shnyrova and Zimmerberg2011) that is likely exacerbated by PA (Li & Yamazaki, Reference Li and Yamazaki2004). The diminished headgroup packing density appears to facilitate GLTP adsorption and improve access to the glycolipid headgroup. By contrast, in a PC matrix, the larger, highly hydrated, orthogonally tilted headgroups pack more closely, and thus can exert a ‘umbrella-like’ shielding effect over the smaller less hydrated GalCer (1 mol%). Such effects are expected to impede interaction by GLTP, which shows limited ability to penetrate into and perturb POPC vesicles during transient interaction (Rao et al. Reference Rao, Chung, Pike and Brown2005). While enhanced membrane partitioning of other peripheral amphitropic proteins by PE is known (Bazzi et al. Reference Bazzi, Youakim and Nelsestuen1992; Dowhan & Bogdanov, Reference Dowhan and Bogdanov2009; Heller et al. Reference Heller, He, Ludtke, Harroun and Huang1997), the findings for GLTP are noteworthy because of the marked synergistic stimulatory effect produced when only 5 mol% PA is included with 15 mol% POPE in the POPC surface. An additional way that POPE might enhance GLTP uptake of glycolipids is by acting as a lateral dispersant of glycolipids since POPE and GlcCer reportedly form stable complexes above physiological temperature (Quinn, Reference Quinn2011, Reference Quinn2012).
Prior to the study by Zhai et al. (Reference Zhai, Momsen, Malakhov, Boldyrev, Momsen, Molotkovsky, Brockman and Brown2013), the only membrane packing feature known to markedly stimulate glycolipid uptake by GLTP was high positive curvature stress in PC bilayers (Brown et al. Reference Brown, Stephenson, Markello, Barenholz and Thompson1985; Nylund et al. Reference Nylund, Fortelius, Palonen, Molotkovsky and Mattjus2007; Rao et al. Reference Rao, Lin, Pike, Molotkovsky and Brown2004, Reference Rao, Chung, Pike and Brown2005). This finding led to questions about whether cell membrane interaction sites need to be highly curved to be viable interaction sites for GLTP. It now appears plausible that metabolic adjustment of the lipid composition in cytosol-exposed membrane surfaces could provide a viable means for regulating GLTP.
8. GLTP-folds: genomics and cell biological functionality
In their recent review, Tuuf & Mattjus (Reference Tuuf and Mattjus2014) updated current knowledge pertaining to the cell biological functions of GLTP and FAPP2. The information presented here elaborates and expands upon the rather limited insights available at the times of earlier reviews (Brown & Mattjus, Reference Brown and Mattjus2007; Mattjus Reference Mattjus2009). To avoid duplication, the discussion here will focus mostly on the current state of knowledge regarding the human GLTP gene organization and transcriptional regulation (Zou et al. Reference Zou, Chung, Lin, Malakhova, Pike and Brown2008, Reference Zou, Gao, Ruvolo, Gardner, Ruvolo and Brown2011) as well as cell biological aspects of HET-C2, CPTP, and ACD11 for which new information has now emerged.
8.1 GLTP gene organization, transcriptional regulation, and phylogenetics
To date, molecular genetic analyses of the genes encoding human GLTP-folds have been limited to the human GLTP gene (Zou et al. Reference Zou, Chung, Lin, Malakhova, Pike and Brown2008). Single-copy GLTP genes are located in chromosomes 11 and 12. Active transcription of 12q24.11 GLTP, but not the 11p15.1 gene occurs in various human cells based on RT–PCR amplifications of GLTP transcript(s), methylation analyses of regulator CpG islands, and in silico EST evaluations. Despite exhibiting several features of a potentially active retrogene, including a highly homologous sequence (~94% identity), coding for all key amino acid residues involved in glycolipid liganding, the 11p15.1 gene is transcriptionally silent. Heterologous expression and purification of the GLTP paralogs showed glycolipid intermembrane transfer activity only for 12q24.11 GLTP. The findings indicate that the 12q24.11 gene is the bona fide GLTP gene; whereas, 11p15.1 is a pseudogene (GLTPP1). Phylogenetic/evolutionary analyses show that the 5-exon/4-intron organizational pattern and encoded sequence of GLTP are highly conserved in therian mammals and other vertebrates. In contrast, the GLTPP1 pseudogene is a recent evolutionary development found only in primates, but not in rodentiates, carnivorates, cetartiodactylates, or didelphimorphiates.
Human GLTP expression has been linked to sphingolipid homeostasis through Cer by characterization of the gene promoter region and investigation of the regulation of GLTP transcriptional expression (Zou et al. Reference Zou, Gao, Ruvolo, Gardner, Ruvolo and Brown2011). These investigators identified the constitutive and basal (225 bp; ~78% guanine (G)+cystosine (C)) human GLTP promoters along with adjacent regulatory elements using luciferase and GFP reporters in concert with deletion mutants. Despite high G+C content, translational regulation by the mammalian target of rapamycin pathway is not observed. Four GC-boxes serve as functional Sp1/Sp3 transcription factor-binding sites. Mutation of one GC-box is particularly detrimental to GLTP transcriptional activity. Sp1/Sp3 RNA silencing and mithramycin A treatment significantly inhibit GLTP promoter activity. Testing of sphingolipids (GlcCer, sulfatide, ganglioside GM1, S1P, sphingosine, C1P, dihydroceramide, and Cer) shows that only Cer, a nonglycosylated precursor metabolite unable to bind to GLTP protein, can induce GLTP promoter activity. Elevated Cer not only up-regulates GLTP promoter activity but also mitigates decreases in promoter activity induced by Sp1/Sp3 knockdown. Interestingly, Cer treatment does not alter endogenous levels of Sp1 and Sp3 but rather, their binding affinity for the GLTP promoter. In the case of Sp3, the altered binding affinity can be linked to Cer-induced changes in acetylated Sp3 levels, an alteration known to affect Sp3 transcriptional activity.
The cell biological function(s) of GLTP remain unsettled. Some GlcCer still arrives at the plasma membrane in the presence of inhibitors that block vesicular trafficking or when FAPP2 is depleted by RNAi approaches, consistent with GLTP involvement in GlcCer transfer from the Golgi to the PM (Halter et al. Reference Halter, Neumann, van Dijk, Wolthoorn, de Maziere, Vieira, Mattjus, Klumperman, van Meer and Sprong2007; Warnock et al. Reference Warnock, Lutz, Blackburn, Young and Baenziger1994). However, other experiments suggest that GLTP might also function as a sensor that can regulate GSL metabolic homeostasis (Brown & Mattjus, Reference Brown and Mattjus2007; Kjellberg & Mattjus, Reference Kjellberg and Mattjus2013; Kjellberg et al. Reference Kjellberg, Backman, Ohvo-Rekilä and Mattjus2014; Lin et al., 2000; Malakhova et al. Reference Malakhova, Malinina, Pike, Kanack, Patel and Brown2005; Tuuf & Mattjus, Reference Tuuf and Mattjus2007). Interestingly, overexpression of human GLTP can dramatically alter cell phenotype, with cells becoming round 24–48 h after transfection (Gao et al. Reference Gao, Chung, Zou, Pike and Brown2010). The marked rounding (~70% conversion) is evident in HeLa and HEK-293 cells, but not in A549 cells, by 48 h post-transfection. Overexpression of W96A-GLTP, a ligand-site point mutant with abrogated ability to transfer glycolipid, does not alter cell shape. The round adherent cells exhibit diminished motility in wound healing assays and an inability to endocytose cholera toxin but remain viable and show little increase in apoptosis. Regulation of the GLTP-induced cell rounding response is observed by interaction with δ-catenin. Although δ-catenin overexpression alone induces dendritic outgrowths from the cell surface, coexpression of GLTP with δ-catenin accelerates transition to the rounded phenotype. The findings represent the first known phenotypic changes triggered by GLTP overexpression and regulated by direct interaction with a p120-catenin protein family member (Gao et al. Reference Gao, Chung, Zou, Pike and Brown2010).
Ganglioside GM1 transfer by GLTP has recently been studied with natural membranes (Lauria et al. Reference Lauria, van Ǚüm, Mjumjunov-Crncevic, Walrafen, Spitta, Thiele and Lang2013). GLTP can increase glycolipid levels over natural levels in either side of the membrane leaflet, i.e., external or cytosolic, when used in conjunction with donor liposomes containing GM1. In a system with native donor- and acceptor-membranes, GLTP balances highly variable GM1 concentrations in a population of membranes from one cell type and can transfer lipids between membranes from different cell types. Glycolipid transport is highly efficient, requires no cofactors, is driven solely by the chemical potential of GM1 and interacts well with plasma membrane sheets oriented to expose either their extra- or intracellular leaftlets.
Recent studies in the Mattjus lab have assessed GLTP expression at the transcript and protein levels in response to glycolipid intracellular alteration via chemical inhibitors of glycolipid synthesis, degradation, and intracellular trafficking as well as by RNAi-induced depletion of GlcCer synthase (Kjellberg & Mattjus, Reference Kjellberg and Mattjus2013). Inhibitors that increase GlcCer in the cytoplasmic compartment elevate GLTP transcript and protein levels; whereas inhibitors that decrease GlcCer in the cytoplasmic compartment reduce GLTP expression. In a complementary study, the HeLa cell lipidome has been analyzed under conditions of up- and down-regulation of GLTP expression (Kjellberg et al. Reference Kjellberg, Backman, Ohvo-Rekilä and Mattjus2014). Among GSLs analyzed, GlcCer and globtriaosylceramide were most prominently affected. Interestingly, GLTP up-regulation also affected the levels of certain glycerol-based lipids (e.g. diacylglycerol and PS).
From the human molecular genetics standpoint, it is clear that the GLTPH domain of FAPP2 is not a splice variant arising from the GLTP gene (Kamlekar et al. Reference Kamlekar, Simanshu, Gao, Kenoth, Pike, Prendergast, Malinina, Molotkovsky, Venyaminov, Patel and Brown2013). Rather, FAPP2 originates from the single-copy PLEKHA8 gene on human chromosome 7 (locus 7p21–p11.2). The final six exons in mature PLEKHA8 transcript (14 exons) encode the GLTPH domain. Similarly, human CPTP arises from yet another human gene, GLTPD1, on chromosome 1 (locus 1p36.33). The HUGO Gene Nomenclature Committee (http://www.genenames.org/cgi-bin/gene_symbol_report?hgnc_id=28116) recently has renamed GLTPD1 to CPTP. A mature 3-exon mRNA transcribed from CPTP is responsible for CPTP translation (Simanshu et al. Reference Simanshu, Kamlekar, Wijesinghe, Zou, Zhai, Mishra, Molotkovsky, Malinina, Hinchcliffe, Chalfant, Brown and Patel2013). The shared protein-folding topologies encoded by CPTP, PLEKHA8, and GLTP, despite only limited sequence homology, provide a striking example of evolutionary convergence and the strong selection pressure to conserve the GLTP-fold while generating adaptability for different sphingolipids. Human inheritable genetic defects involving proteins with GLTP-motifs as well as characterization of mouse knock-outs of GLTP homologs except for FAPP2 (D’ Angelo et al., 2013) have yet to be reported.
8.2 HET-C2
In filamentous fungi, het genes exhibit extensive polymorphism and often encode proteins carrying a HET domain (Fedorova et al. Reference Fedorova, Badger, Robson, Wortman and Nierman2005; Saupe et al. Reference Saupe, Descamps, Turcq and Begueret1994). Originally, this domain was linked to the het-c2 gene of Podospora anserina, where it encodes a protein similar in size and with limited sequence homology to mammalian GLTPs (Lin et al. Reference Lin, Mattjus, Pike, Windebank and Brown2000; Saupe et al. Reference Saupe, Descamps, Turcq and Begueret1994). Subsequently, HET-C2 was shown to stimulate in vitro intermembrane transfer of GalCer, but not sphingomyelin, Cer, PC, or cholesterol (Mattjus et al. Reference Mattjus, Turcq, Pike, Molotkovsky and Brown2003). As discussed earlier, the X-ray structure shows HET-C2 to be organized as a GLTP-fold adapted for GSLs with simple neutral sugar headgroups.
In filamentous fungi, het genes play a major role in vegetative incompatibility processes involving cell–cell recognition (Bastiaans et al. Reference Bastiaans, Debets, Aanen, van Diepeningen, Saupe and Paoletti2014; Fedorova et al. Reference Fedorova, Badger, Robson, Wortman and Nierman2005; Glass & Kaneko, Reference Glass and Kaneko2003; Paoletti et al. Reference Paoletti, Saupe and Clave2007; Saupe, Reference Saupe2000). The benefits of vegetative incompatibility include prevention of transmission of deleterious cytoplasmic elements (i.e. viruses) and restriction of plundering by parasitic genotypes. The vegetative incompatibility response is a post-fusion autophagic and programmed cell death-like response triggered by nonself recognition. Self/nonself recognition is a universally important process, encompassing intercellular interactions ranging from vertebrate immune responses to somatic chimera formation in protists, filamentous fungi, sponges, ascidians, and tunicates. Self/nonself discrimination is critical for filamentous fungi during hyphal fusion, enabling exchange of cytoplasm and nuclei during the assimilative growth phase. It seems plausible that HET-C2 involvement in the vegetative incompatibility response could involve regulation of sphingolipid metabolite levels because of known connections to autophagy and apoptosis, but experimental testing of this idea will be needed.
8.3 CPTP
Coupled with the structure/function determinations of CPTP were collaborative cell biological studies with the E. H. Hinchcliffe lab and C. E. Chalfant lab (Simanshu et al. Reference Simanshu, Kamlekar, Wijesinghe, Zou, Zhai, Mishra, Molotkovsky, Malinina, Hinchcliffe, Chalfant, Brown and Patel2013). CPTP is found dispersed in the cytoplasm but also associated with perinuclear membranes, i.e. Golgi, plasma membrane, and nuclear membrane. RNAi-induced depletion of CPTP diminishes C1P levels in plasma membrane-enriched subfractions, while dramatically elevating C1P in membrane subfractions enriched in trans-Golgi and only moderately affecting sphingosine, S1P, and Cer levels. The elevated C1P appears to enhance Group IV cPLA2α translocation to the trans-Golgi, based on elevations in arachidonic acid release accompanied by downstream elevations of pro-inflammatory eicosanoids, i.e. prostaglandins (via cycolooxygenases), leukotrienes (via lipooxygenases), and epoxyeicosatrienoic acids (via cytochrome P-450). These findings provide the basis for the current model of CPTP in vivo function (Fig. 9b ). CPTP is needed to remove C1P from the trans-Golgi after synthesis by ceramide kinase (CERK), the only known producer of C1P in human cells. When CPTP levels are depleted by RNAi, C1P is not effectively dispersed to other intracellular locations (e.g. plasma membrane). The C1P accumulates at the trans-Golgi and activates cPLA2α by enhancing translocation to this site, an event triggering production of arachidonic acid and related eicosanoids. The enhanced cPLA2α association with the trans-Golgi reflects the action of a C1P-binding site on the C2-domain of cPLA2α . The findings show CPTP plays a critical role in cellular homeostasis by preventing C1P accumulation at the trans-Golgi, thereby functioning as a novel regulator of pro-inflammatory eicosanoid production.
8.4 ACD11
The recent discovery of selective binding/transfer of C1P by ACD11 of A. thaliana and the successful X-ray determination of GLTP-fold formation by this protein serve to further demonstrate the evolutionary premium placed on conservation of the GLTP-fold, while undergoing adaptive diversification of lipid specificity (Simanshu et al. Reference Simanshu, Zhai, Munch, Hofius, Markham, Bielawski, Bielawska, Malinina, Molotkovsky, Mundy, Patel and Brown2014). In this study, the importance of ACD11 expression to the regulation of sphingolipid metabolism in Arabidopsis became clear. In acd11 knock-out plants, constant activation of apoptosis-like cell death is observed, leading to whole plant lethality at around the seven-leaf stage of development. Acd11 plants exhibit defective autophagic cell death. The speed and severity of programmed cell death in acd11 are consistent with apoptosis-like cell death (Brodersen et al. Reference Brodersen, Petersen, Pike, Olszak, Skov, Odum, Jorgensen, Brown and Mundy2002, Reference Brodersen, Malinovsky, Hématy, Newman and Mundy2005). Sphingolipidomics analyses of the leaves of acd11 plants show severe disruption in the levels of two key sphingolipid regulators of apoptosis, C1P, and Cer (Simanshu et al. Reference Simanshu, Zhai, Munch, Hofius, Markham, Bielawski, Bielawska, Malinina, Molotkovsky, Mundy, Patel and Brown2014). C1P levels significantly increase, but dramatic elevation of phytoceramide also occurs, disrupting the critical balance of these regulators of apoptosis. Additional studies will clearly be helpful for dissecting more of the molecular details pertaining to the programmed cell death response that occurs in acd11 knock-out plants.
9. Control of intracellular location
9.1 Targeting to various intracellular destinations
Currently, what is known about the targeting of GLTP-folds to various intracellular destinations is limited to GLTP and FAPP2 and has been discussed recently by Tuuf & Mattjus (Reference Tuuf and Mattjus2014). Briefly, two fundamentally different mechanisms appear likely to be involved although details are scant and much more study is needed. One mechanism involves sequence motifs within a GLTP homolog that might act as targeting devices for interaction with other proteins associated with membranes. For instance, a ‘nonclassical’ motif sharing similarity with FFAT has been identified in GLTP (Tuuf et al. Reference Tuuf, Wistbacka and Mattjus2009). FFAT motifs with consensus sequences (EFFDAxE) are known to act as targeting and association signals for vesicle-associated membrane protein-associated proteins (VAMP-associated proteins or VAPs) localized in the cytosolic surface of the endoplasmic reticulum (ER) (Loewen et al. Reference Loewen, Roy and Levine2003; Kawano et al. Reference Kawano, Kumagai, Nishijima and Hanada2006; Wyles et al. Reference Wyles, McMaster and Ridgway2002). A ‘weak’ FFAT-like motif in GLTP (32PFFDCLG38) identified by Tuuf et al. (Reference Tuuf, Wistbacka and Mattjus2009) reportedly still binds with VAP-A in vitro, despite being localized within an α-helix instead of a β-strand, as observed in other VAP–FFAT-binding studies (Furuita et al. Reference Furuita, Jee, Fukada, Mishima and Kojima2010; Kaiser et al. Reference Kaiser, Brickner, Reilein, Fenn, Walter and Brunger2005). Mikitova & Levine (Reference Mikitova and Levine2012) identified a second ‘weak’ FFAT-like-motif in the GLTP sequence (22PFLEAVS28) and proposed that both FFAT-like motifs might be needed to generate sufficient interaction strength for docking GLTP with VAP. Experimental in vivo testing is still needed. In FAPP2, aside from its PH domain that target PI4P at the Golgi (D'Angelo et al. Reference D'Angelo, Polishchuk, Di Tullio, Santoro, Di Campli, Godi, West, Bielawski, Chuang, van der Spoel, Platt, Hannun, Polishchuk, Mattjus and De Matteis2007), in silico analyses reveal two ‘weak’ FFAT-like motifs, similarly localized as in GLTP, as well as a third very weak FFAT motif in humans. However, testing of the optimal mammalian FAPP2 motif, TFFST-N, showed no targeting to the ER, but pseudophosphorylation of the Ser residue, i.e. TFFDA-N, did result in weak interaction with VAP (Mikitova & Levine, Reference Mikitova and Levine2012). Clearly, more studies will be needed to a better understanding of the situation, especially for newly identified GLTP homologs.
Aside from internal sequence motifs expected to help guide the intracellular targeting of GLTP-folds, modification reactions by small molecules (e.g. phosphorylation, ubiquitination, etc.) are likely to provide a second means of regulation. For example, in a phosphoproteomic study, Thr69 of GLTP was found to be phosphorylated by mass spectrometry (Olsen et al. Reference Olsen, Vermeulen, Santamaria, Kumar, Miller, Jensen, Gnad, Cox, Jensen, Nigg, Brunak and Mann2010). Ubiquitination of GLTP has also been reported (Wagner et al. Reference Wagner, Beli, Weinert, Nielsen, Cox, Mann and Choudhary2011). FAPP2 reportedly has several phosphorylation sites (Tuuf & Mattjus, Reference Tuuf and Mattjus2014). However, the functional role(s) of these modifications will require additional studies for better understanding.
9.2 Sphingolipid intracellular topology
GSLs and C1P are assembled in the Golgi where synthesis involves addition of sugars or phosphate to Cer. The initial glycosylation of Cer occurs on the cytosolic face of the Golgi via GlcCer synthase. CERK is a cytoplasmic protein that can translocate to the Golgi complex, the nucleus, and the plasma membrane (Bornancin, Reference Bornancin2011). A PH domain in CERK may facilitate localization to the Golgi and/or nucleus. Nascent C1P produced by CERK has ready access to CPTP via its cytosolic localization (Simanshu et al. Reference Simanshu, Kamlekar, Wijesinghe, Zou, Zhai, Mishra, Molotkovsky, Malinina, Hinchcliffe, Chalfant, Brown and Patel2013). In contrast, generation of more complex GSLs from GlcCer requires transmembrane flipping of GlcCer to the Golgi luminal face, where the glycosyltransferases that produce complex GSLs (LacCer & higher GSLs) reside (Breslow & Weissman, Reference Breslow and Weissman2010; Kolter, Reference Kolter2012). This luminal orientation results in packaging into the inner surfaces of transport vesicles which shields these nascent GSLs from cytosolically localized FAPP2 and GLTP (D'Angelo et al. Reference D'Angelo, Polishchuk, Di Tullio, Santoro, Di Campli, Godi, West, Bielawski, Chuang, van der Spoel, Platt, Hannun, Polishchuk, Mattjus and De Matteis2007, Reference D'Angelo, Uemura, Chuang, Polishchuk, Santoro, Ohvo-Rekilä, Sato, Di Tullio, Varriale, D'Auria, Daniele, Capuani, Johannes, Mattjus, Monti, Pucci, Williams, Burke, Platt, Harada and De Matteis2013; Tuuf & Mattjus, Reference Tuuf and Mattjus2007). Thus, the topology of GSL synthesis dictates ready access GlcCer by GLTP and FAPP2. In the case of FAPP2, strong evidence exists for a key role in higher GSL synthesis at the trans-Golgi (D'Angelo et al. Reference D'Angelo, Polishchuk, Di Tullio, Santoro, Di Campli, Godi, West, Bielawski, Chuang, van der Spoel, Platt, Hannun, Polishchuk, Mattjus and De Matteis2007, Reference D'Angelo, Uemura, Chuang, Polishchuk, Santoro, Ohvo-Rekilä, Sato, Di Tullio, Varriale, D'Auria, Daniele, Capuani, Johannes, Mattjus, Monti, Pucci, Williams, Burke, Platt, Harada and De Matteis2013). In contrast, much less is known about the intracellular function of GLTP. Despite a topological location that is expected to prevent GLTP access to most GSLs except for GlcCer in cells, GLTP is capable of binding and transferring a wider variety of GSL than FAPP2 (Kamlekar et al. Reference Kamlekar, Simanshu, Gao, Kenoth, Pike, Prendergast, Malinina, Molotkovsky, Venyaminov, Patel and Brown2013). This raises the possibility that GLTP might act as a sensor to monitor GlcCer intracellular levels and play a regulatory role in sphingolipid homeostasis in normal cells and/or guard-like sensor to detect the aberrant presence of higher GSLs in the cytosol-facing membranes in pathophysiological conditions. Evidence supporting the first possibility has begun to emerge for GLTP (Kjellberg & Mattjus, Reference Kjellberg and Mattjus2013; Kjellberg et al. Reference Kjellberg, Backman, Ohvo-Rekilä and Mattjus2014). Nonetheless additional experiments will be needed to delineate other possibilities as well as further define the functional roles of other human proteins containing GLTP-fold structural motifs.
10. Expanding importance of the GLTP-fold
The GLTP-fold no longer can be considered a ‘provincial’ or ‘specialized’ protein-fold focused only on one lipid type, GSLs. The emergence of a GLTP-fold with specificity for C1P rather than GSL establishes the GLTP-fold as a fundamental, evolutionarily conserved bridge interconnecting the sphingolipid world in eukaryotes. Indeed, the GLTP-fold has the potential to control intracellular sphingolipid homeostasis by transferring key metabolites (e.g. GlcCer or C1P) to specific sites within cells and/or to act as sensors that regulate sphingolipid metabolism. Such functionalities are expected to be of utmost importance in cells because of the life-and-death processes in which sphingolipids participate, i.e. cell proliferation, differentiation, development, apoptosis, autophagy, and inflammation. The recent, exciting revelation of CPTP as a novel regulator of pro-inflammatory eicosanoid production (Simanshu et al. Reference Simanshu, Kamlekar, Wijesinghe, Zou, Zhai, Mishra, Molotkovsky, Malinina, Hinchcliffe, Chalfant, Brown and Patel2013) establishes a translational bridge between the world of GLTP-fold basic science and disease-related pathologies. This timely development opens new avenues for future cross-disciplinary, translational research.
11 Acknowledgements
We thank the staff of X-29 beamline at the National Synchrotron Light Source, of ID-24-C/E beamlines at the Advanced Photon Source, and of beamlines ID 23–1 and ID 14–4 at ESRF for assistance with X-ray data collection. The structural focus of this review precluded co-authorship of many colleagues and collaborators who assisted with the biophysical studies and/or elucidated the cell and molecular biological aspects of the GLTP-fold superfamily. They are: Shrawan Mishra, Xianqiong Zou, Yongguang Gao, Chetan Rao, Xin Lin, Peter Mattjus, Helen Pike, Sergei Venyaminov, Franklyn Prendergast, Linda Benson, Bob Bergen, Ivan Boldyrev, Alexander Popov, Aintzanne Cabo-Bilbao, Felipe Goñi-de-Cerio, Sandra Delgado, Nikolaj Petersen, David Munch, Daniel Hofius, Kul Karanjeet, Dayanjan Wijesinghe, John Mundy, Edward Hinchcliffe, and Charles Chalfant. The structural research emphasized here was supported primarily by NIH/NCI CA121493 (D.J.P. & R.E.B.), NIH/NIGMS GM45928 (R.E.B.), Spanish Ministerio de Ciencia e Innovacion BFU2010-17711 (L.M.), Russian Foundation for Basic Research #12-04-00168 (J.G.M.) and #14-04-01671 (V.R.S.), Hormel Foundation (R.E.B.), Abby Rockefeller Mauze Trust (D.J.P.), and Maloris Foundation (D.J.P.).