I. INTRODUCTION
Controllable synthesis of micro/nanocrystals has received considerable attention driven primarily by the fact that the shape and size of micro/nanocrystals have tremendous effects on their properties.Reference Wang, Peng and Li1–Reference Williams, Huang, Ming, Kao, Smith, Goldburt, Hodel, Kulkarni, Veliadis and Bhargava3 The reduction of particle size in a crystalline system can result in remarkable modifications of some of their bulk properties because of a high surface-to-volume ratio and the quantum confinement effect.Reference Bai, Song, Pan, Lei, Wang, Ren, Lu, Dong, Dai and Fan4–Reference Bhargava, Gallaghar, Hong and Nurmikko6 So far, a number of synthesis techniques such as coprecipitation process, hydrothermal process, and sol–gel process have been developed to synthesize submicrocrystals and nanocrystals with a controlled size and shape.Reference Wang and Li7–Reference Tao, Zhao, Zhang and Xia12
Lanthanide-doped nanomaterials have become a specific topic of interest owing to their unique luminescence properities.Reference Xia and Du13–Reference Wang, Han, Lim, Lu, Wang, Xu, Chen, Zhang, Hong and Liu15 Compared with conventional luminescent materials, such as organic fluorescent dyes and semiconductor quantum dots, lanthanide-doped materials can present low photobleaching, narrow emission bands, and longer luminescent lifetimes.Reference Wang, Han, Lim, Lu, Wang, Xu, Chen, Zhang, Hong and Liu15 Among all the trivalent lanthanide ions, Er3+ has attracted considerable attention due to the richest spectrum in the infrared–ultraviolet (UV) range that makes it ideally suited for energy UC studies. So far, a range of lanthanide-doped fluoride, oxide, hydroxide, orthovanadate, thioxide, borate, and phosphate nanocrystals have been successfully prepared.Reference Wang, Peng and Li1, Reference Wang, Han, Lim, Lu, Wang, Xu, Chen, Zhang, Hong and Liu15
Solar-driven photocatalytic hydrogen production from water using a semiconductor catalyst has attracted a tremendous amount of interest since the discovery of water splitting on a TiO2 electrode.Reference Fujishima and Honda16, Reference Mao and Chen17 Thermodynamically, water splitting into H2 and O2 is an uphill reaction, accompanied by a large positive change in the Gibbs free energy. The efficiency of water splitting is determined by the band gap and band structure of the semiconductor and the electron transfer process.Reference Linsebigler, Lu and Yates18, Reference Hagfeldt and Graetzel19 In recent years, numerous attempts have been made to enhance the activity of photocatalysts.Reference Tian, Shangguan, Yuan, Jiang, Chen, Shi, Ouyang and Wang20, Reference Maeda, Teramura and Domen21 Among various materials, layered perovskite-type oxides have attracted considerable attention due to their unique optical properties and excellent photocatalytic activity.Reference Ikeda, Hara, Kondo and Domen22–Reference Kudo and Sakata24 KLa2Ti3O9.5 belongs to layered perovskite-type oxides. However, there have been no reports on the UC luminescence as well as photocatalylic activity of KLa2Ti3O9.5:Er3+ nanocrystals for water decomposition to hydrogen.
Here, we synthesized KLa2Ti3O9.5 and KLa2Ti3O9.5:Er3+ nanocrystals by a hydrothermal method and a subsequent calcination treatment. The KLa2Ti3O9.5:Er3+ nanocrystals emitted intense green (2H11/2 → 4I15/2 and 4S3/2 → 4I15/2) and red (4F9/2 → 4I15/2) luminescence under 980-nm excitation. In addition to the aforementioned luminescence properties, KLa2Ti3O9.5:Er3+ nanocrystals also exhibit a higher activity for water splitting into H2 under simulated solar light irradiation, which could be attributed to the larger BET surface area and UC luminescence of KLa2Ti3O9.5:Er3+.
II. EXPERIMENTAL
Synthesis of KLa2Ti3O9.5:Er3+ nanocrystals: in a typical synthesis, 5.106 mL of tetrabutyl titanate and 4 mmol of Ln(NO3)3 (Ln = La and Er) were added to a mixture of NaOH (1.54 g), ethanol (8 mL), deionized water (4 mL), and oleic acid (20 mL), and the solution was thoroughly stirred. Subsequently, the milky colloidal solution was transferred to a 50 mL Teflon-lined autoclave and heated at 180 °C for 24 h. The systems were then allowed to cool to room temperature. The as-prepared products were collected by means of centrifugation, washed with ethanol, dried in vacuum at 90 °C, and finally annealed in air at 800 °C for 2 h.
The powder diffraction patterns were analyzed by a Rigaku D/MAX-rA x-ray diffractometer (XRD; Rigaku, Tokyo, Japan) equipped with graphite monochromatized Cu Kα radiation (γ = 1.541874 Å), keeping the operating voltage and current at 40 kV and 40 mA, respectively. The size and morphology of the final products were investigated by transmission electron microscopy (TEM, JEM 2010, JEOL, Tokyo, Japan, with operating voltage of 200 kV) and scanning electron microscopy (SEM, Hitachi S-4800, Tokyo, Japan, with operating voltage of 15 kV). UC luminescence spectra were recorded using a Hitachi F-4500 fluorescence spectrophotometer with an adjustable laser (980 nm) as the excitation source with a fiber optic accessory. All the experiments were performed at room temperature. Nitrogen adsorption–desorption isotherms were collected using an Autosorb-1 (Quantachrome Instruments, Boynton Beach, FL) nitrogen adsorption apparatus at 77 K. The pore size distribution plots were obtained by the Barret–Joyner–Halenda (BJH) model. UV–vis absorption spectra were determined by a UV–Vis spectrophotometer (Shimadzu UV-2550, Tokyo, Japan).
The photocatalytic H2 evolution from water was conducted in an online photocatalytic hydrogen production system (AuLight, Beijing, China, CEL‐SPH2N). A powder sample of the catalyst (0.1 g) was suspended in a mixture of 80 mL distilled water and 20 mL methanol in the cell by using a magnetic stirrer. Pt-loaded photocatalysts were prepared by known standard method of in situ photodeposition method. For this, the photocatalyst powder was added to an aqueous methanol solution containing a required amount (0.1 wt%) of H2PtCl6. The solution was illuminated for 2 h under simulated solar light, filtered, and then dried in a static oven at 80–100 °C. Before the reaction, the mixture was deaerated by evacuation to remove O2 and CO2 dissolved in water. The reaction was carried out by irradiating the mixture with light from a 500 W high pressure Hg lamp. Gas evolution was observed only under photoirradiation, being analyzed by an online gas chromatograph [SP7800, thermal conductivity detector (TCD), molecular sieve 5 Å, N2 carrier, Beijing Keruida Limited, Beijing, China].
III. RESULTS AND DISCUSSION
A. Crystal structure and morphology
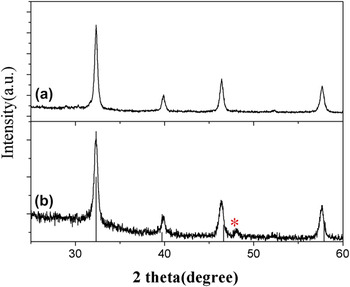
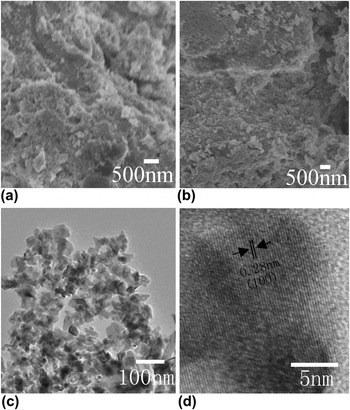
Figure 1 shows the XRD patterns of KLa2Ti3O9.5 and KLa2Ti3O9.5:Er3+ (0.5%) nanocrystals. These patterns are in agreement with the KLa2Ti3O9.5 (JCPDS No. 50-0422). It is noted that the peak marked by asterisk (*) arises from K2Ti6O13 (JCPDS No. 40-0403). The corresponding SEM images of the as-prepared nanocrystals are shown in Figs. 2(a) and 2(b). Figure 2(c) shows the TEM image of KLa2Ti3O9.5:Er3+ (0.5%) nanocrystals. The average size of KLa2Ti3O9.5:Er3+ nanocrystals is less than 50 nm. The high-resolution transmission electron microscopy (HRTEM) image of a single nanoparticle is shown in Fig. 1(d). The measured lattice spacing is about 0.28 nm, corresponding to the distance of the {100} planes of KLa2Ti3O9.5. This image also reveals the single-crystal nature of the product.
XRD patterns of (a) KLa2Ti3O9.5:Er3+ and (b) KLa2Ti3O9.5 nanocrystals.

SEM images of (a) KLa2Ti3O9.5 and (b) KLa2Ti3O9.5:Er3+ nanocrystals. (c) TEM and (d) HRTEM images of KLa2Ti3O9.5:Er3+ nanocrystals.

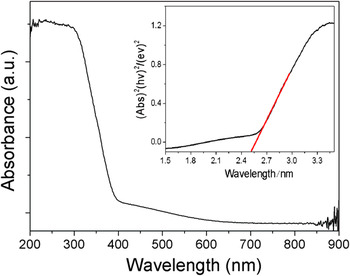
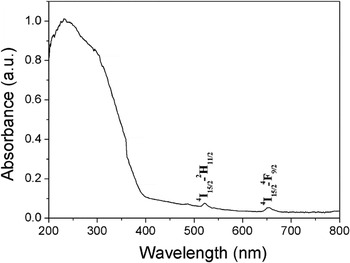
The optical absorption of the KLa2Ti3O9.5 nanocrystals was conducted with a UV–vis absorption spectrometer, as shown in Fig. 3. The KLa2Ti3O9.5 nanocrystals show the photoabsorption in the UV light region (λ < 400 nm), and the steep shape of the spectrum indicates that the UV light absorption is due to the intrinsic band gap transition of the nanomaterials.Reference Kudo, Tsuji and Kato25 For a crystalline semiconductor, the optical absorption near the band edge follows the equation  ${ahvA(hv - E_{\rm{g}} )^{n/2}}$ , where a, v, E g, and A are the absorption coefficient, the light frequency, the band gap, and a constant, respectively. Among them, n decides the characteristics of the transition in a semiconductor.Reference Zhang, Shi, Chen, Gao, Huang, Ding and Tang26 The band gap (E g) of the KLa2Ti3O9.5 nanocrystals is calculated to be about 2.56 eV from the onset of the absorption edge (inset of Fig. 3). Figure 4 shows the UV–vis absorption spectrum of KLa2Ti3O9.5:Er3+ nanocrystals. The weak peaks correspond to the f-f absorption transitions of Er3+ ions: 4I15/2 → 4F9/2 and 4I15/2 → 2H11/2.
UV–vis absorption spectrum of KLa2Ti3O9.5 nanocrystals.

UV–vis absorption spectrum of KLa2Ti3O9.5:Er3+ nanocrystals.

B. UC luminescence of KLa2Ti3O9.5:Er3+ nanocrystals
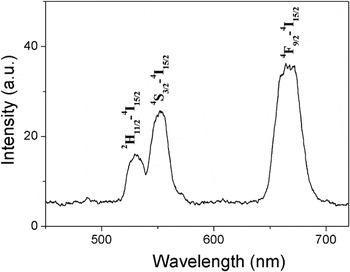
Figure 5 shows the UC luminescence spectrum of the as-prepared KLa2Ti3O9.5:Er3+ nanocrystals under 980-nm excitation. The spectral peaks correspond to the following transitions: 2H11/2 → 4I15/2 (∼521 nm), 4S3/2 → 4I15/2 (∼543 nm), and 4F9/2 → 4I15/2 (∼653 nm).
UC luminescence spectrum of KLa2Ti3O9.5:Er3+ nanocrystals excited with a 980-nm laser.

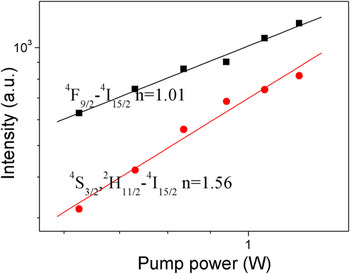
Dependence of the UC luminescence intensity on pump power was actually performed to obtain a better understanding of the UC processes. For an unsaturated UC process, the emission intensity (I f) will be proportional to some power (n) of the infrared excitation (P) power: I f ∝ Pn,Reference Pollnau, Gamelin, Lüthi and Güdel27 where n is the number of infrared photons absorbed per visible photon emitted. To investigate the fundamental UC mechanisms of KLa2Ti3O9.5:Er3+ nanocrystals, the pumping power dependence of the fluorescent radiations was investigated. Figure 6 shows the double logarithmic plots of the emission intensity as a function of excitation power for the 4S3/2/2H11/2 → 4I15/2 and 4F9/2 → 4I15/2 emissions.
Plot (log–log) of emission intensity versus excitation power in KLa2Ti3O9.5:Er3+ nanocrystals.

C. Photocatalytic activity of KLa2Ti3O9.5 and KLa2Ti3O9.5:Er3+ nanocrystals
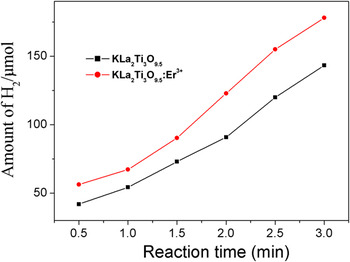
Figure 7 shows that the reaction time depended H2 evolution over KLa2Ti3O9.5 and KLa2Ti3O9.5:Er3+ nanocrystals under simulated solar irradiation. Obviously, the photocatalytic performance of KLa2Ti3O9.5:Er3+ is much better than KLa2Ti3O9.5 nanocrystals.
Photocatalytic decomposition of water into H2 under simulated solar light irradiation.

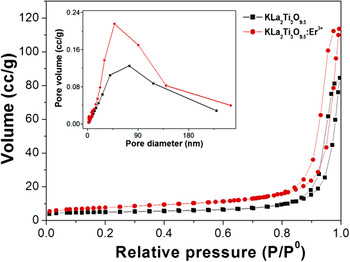
We suggest that two possible mechanisms might be responsible for the enhancement of photocatalytic performance of KLa2Ti3O9.5:Er3+. First, the photocatalytic activity is related to the surface area of KLa2Ti3O9.5:Er3+. N2 adsorption–desorption isotherms and the corresponding BJH pore size distribution plots of the as-obtained KLa2Ti3O9.5 and KLa2Ti3O9.5:Er3+ (0.5%) nanocrystals were performed to determine the surface area of the nanocrystals, as shown in Fig. 8. The BET surface areas of the KLa2Ti3O9.5 and KLa2Ti3O9.5:Er3+ nanocrystals are 17.46 and 26.95 m2/g, respectively. The larger BET surface area of KLa2Ti3O9.5:Er3+ nanocrystals can be attributed to the incorporation of Er3+ ions in the lattice. Second, the enhancement of photocatalytic activity of KLa2Ti3O9.5:Er3+ is related to the visible-to-UV UC of KLa2Ti3O9.5:Er3+.Reference Fan, Chen, Feng, Wang, Pan, Zhou, Li, Hou and Wang28 According to previous reports, the emission bands around 318.7 and 320.1 nm could be observed in Er3+-doped compounds under the pumping of 486.5 and 542.4 nm (or 548.8 nm), respectively.Reference Zu, Yang and Dai29, Reference Xu and Jiang30 In addition, the emissions in the regions of 326–342 and 354–359 nm were also detected by 652.2 nm (or 657.8 nm) pumping.Reference Yang, Dai and Sun31 Here, the visible light may be converted to UV light, which can effectually activate the KLa2Ti3O9.5. And thus, KLa2Ti3O9.5:Er3+ presents higher photocatalytic activity.
N2 adsorption–desorption isotherm curves and pore size distribution (inset) of KLa2Ti3O9.5 and KLa2Ti3O9.5:Er3+ nanocrystals.

IV. CONCLUSION
In summary, KLa2Ti3O9.5 and KLa2Ti3O9.5:Er3+ nanocrystals were synthesized by a hydrothermal method and a subsequent calcination treatment at 800 °C. The optical absorption of the KLa2Ti3O9.5 nanocrystals was conducted with a UV–vis absorption spectrometer. The band gap (E g) of the KLa2Ti3O9.5 nanocrystals is calculated to be about 2.56 eV. The KLa2Ti3O9.5:Er3+ nanocrystals emitted intense green (2H11/2 → 4I15/2 and 4S3/2 → 4I15/2) and red (4F9/2 → 4I15/2) luminescence under 980-nm excitation. In addition, the photocatalytic activity of KLa2Ti3O9.5:Er3+ nanocrystals for water splitting into H2 was studied. The activity of KLa2Ti3O9.5:Er3+ was increased compared to that of pure KLa2Ti3O9.5 nanocrystals. We suggest that the enhancement of photocatalytic activity is related to the BET surface area and UC luminescence of KLa2Ti3O9.5:Er3+.
ACKNOWLEDGMENTS
This work was supported by the National Natural Science Foundation of China (Grant Nos. 10979032, 21001042, and 21171052), the Program for New Century Excellent Talents in University of Ministry of Education of China (Grant No. NCET-11-0959), the Postdoctoral Science Foundation of Heilongjiang Province (Grant No. LBH-Q11009), and the Youth Foundation for Distinguished Young Scholars of Heilongjiang University.