I. INTRODUCTION
The present revolution in basic and applied biological research, like drug delivery or bioimaging techniques, strongly depends on the availability of nanosized crystals with adequate attributes linked especially to their nontoxic and bioinert properties.Reference Murcia, Naumann and Kumar1 Semiconductor quantum dots (QDs) are emerging as alternative or complementary tools to organic fluorescent dyes, which are currently used in bioimaging. In comparison with traditional organic fluorophores, QDs have a number of advantages including broad excitation and narrow emission spectra. QDs are more resistant to photobleaching than their organic counterparts, making QDs superior alternative materials for biomarkers and for further applications in biology and medicine.Reference Medintz, Uyeda, Goldman and Mattoussi2
QDs are often made of group II and VI elements [e.g., cadmium selenide (CdSe) and cadmium telluride (CdTe)]Reference Kim, Fisher, Eisler and Bawendi3 or group III and V elements [e.g., indium phosphide (InP) and indium arsenide (InAs)].Reference Cao, Aksenton, Soloviev, Banin, Moss, Ila, Lee and Norris4 Although these QDs have great potential as probes for bioimaging, certain limitations may restrict their applications. These QDs were found to be cytotoxic through the release of free metallic ions and therefore a protective shell must be systematically added. However no protective shell can guarantee an efficient chemical isolation of the extremely toxic elements from the living cellular environment. Cytotoxicity is one of the major limiting factors when applying II-VI QDs in in vivo imaging.Reference Hardman5
Luminescent silicon (Si) QDs have great potential in biological imaging and diagnostic applications.Reference Hua, Erogbogbo, Yong, Roy, Xu, Prasad and Swihart6 For exploiting this potential, they must remain luminescent and stably dispersed in water and biological fluids over a wide range of pH and salt concentration. There are many challenges in creating such stable water-dispersible Si QDs, as they show strong instability in the photoluminescence properties due to their fast oxidation in aqueous environments. Another difficulty is related to the attachment of hydrophilic molecules to the Si QDs’ surfaces. Oxide surface passivation is due to either a Si=O double bond or a Si–O–Si ether-like bond.Reference Hua, Erogbogbo, Yong, Roy, Xu, Prasad and Swihart6, Reference Kanemitsu, Shimizu, Komoda, Hemment and Sealy7 Attaching organic ligands to the surface of Si QDs is an alternative way to passivate the Si surface. A large family of organic molecules can be grafted to the surface of Si QDs, resulting in Si–C surface-bond capping.Reference Kanemitsu, Shimizu, Komoda, Hemment and Sealy7, Reference Hadjisawas and Kelires8 The strong Si–C bonds prevent the surface from being oxidized and these Si-based QDs are water-soluble at the same time. Si–C bonds are naturally present in silicon carbide that can provide a stable surface per se.
In this study, we propose silicon carbide (SiC) QDs as a promising material to be used in biomarker- and bioimaging-related applications. SiC QDs were successfully fabricated in many ways.Reference Wu, Fan, Qiu, Yang, Siu and Chu9–Reference Makkai, Pécz, Bársony, Vida, Pongrácz, Josepovits and Deák12 The typical diameter is often less than 5 nm. Small size is also of great importance in living cell applications for clearance. In addition, biocompatibility of bulk SiCReference Coletti, Jaroszeski, Pallaoro, Hoff, Iannotta and Saddow13, Reference Raya, Maldonado, Rico, Gañan, de Arellano-Lopez and Fernandez14 and SiC QDs has been already proven in the literature.Reference Botsoa, Lysenko, Géloën, Marty, Bluet and Guillot15, Reference Serdiuk, Lysenko, Skryshevsky and Géloën16 The Si–C bonds in SiC add chemical stability to SiC QDs, thus there is no need for surface passivation after synthesis and they form stable colloids in water. The presence of oxidized carbon groups on the surface of SiC QDs opens new possibilities for easy biofunctionalization and derivatization processes for further applications.Reference Beke, Szekrényes, Balogh, Veres, Fazakas, Varga, Kamarás, Czigány and Gali17
We use electroless wet chemical etchingReference Zhu, Liu, Wu, Xu, Zhang and Chu18 of the SiC microcrystals to form nanosize SiC QDs. Photoluminescence properties and surface termination of our SiC QDs have already been described.Reference Beke, Szekrényes, Balogh, Veres, Fazakas, Varga, Kamarás, Czigány and Gali17 In this article, we investigate their cytotoxicity and demonstrate their potential in bioimaging techniques by using two-photon microscopy for capturing images from SiC QD-injected pyramidal cells.
II. EXPERIMENT
A. Preparation of the SiC QDs
Silicon powder (365 mesh) and graphite powder were the starting materials as silicon and carbon source. A silicon–graphite mixture with 1:1.2 M ratio was pressed into a pellet, then placed into an induction chamber (400 kHz) and heated up to about 1300 °C under argon atmosphere where the reaction began. The residual graphite was removed by annealing the sample at 900 °C for 10 h under air and the residual Si was eliminated by using a hydrofluoric acid (HF) and nitric acid (HNO3) mixture at room temperature. In the second step the electroless wet chemical etching method was performed which results in the formation of a highly porous layer on the SiC microcrystal (SiC MC) surfaces. The acid mixture used for the etching procedure was 65% HNO3:48% HF with a volume ratio of 1:3, the etching was performed at 100 °C for 2 h. After removing the acids and washing the samples the SiC QDs were obtained by sonication of the porous SiC MCs in water or in ethanol for 40 min to remove the porous layer and suspend the QDs. The SiC MCs, cleaned from the porous layer, and the SiC QDs were separated by centrifugation at 2600 g for 1.5 h. The supernatant fluid contained SiC QDs.
B. Characterization of the SiC QDs
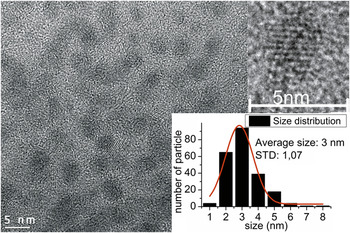
Figure 1 shows a typical high-resolution transmission electron microscope image (HRTEM; JEOL JEM-3010, 300 kV, Tokyo, Japan; 1.7 Å resolution) of SiC QDs and their size distribution. The HRTEM image reveals that the SiC QDs are nearly spherical and the typical lattice spacing of 0.25 nm corresponds to the (111) plane of 3C-SiC. The size distribution was obtained from several HRTEM images. The typical size was ∼3 nm with relatively small dispersions in size (1–8 nm).
HRTEM image and size distribution of the SiC QDs distributed on an amorphous carbon foil.

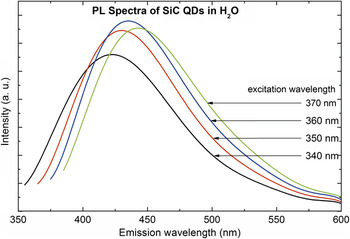
Photoluminescence (PL) of the SiC QDs was studied in water and ethanol solution in the 300–400 nm excitation range using a Horiba Jobin-Yvon Nanolog fluorometer (Horiba Scientific, Edison, NJ). The highest band intensity appears at an excitation of 360–370 nm with the corresponding emission in the range of 420–450 nm (Fig. 2 for the aqueous colloidal solution).
PL spectra of SiC QDs in water.

The surface structure of the SiC QDs was characterized by infrared spectroscopy (Bruker Tensor 37 FTIR spectrometer, Bruker Optik GmbH, Ettlingen, Germany, equipped with an overhead attenuated total reflectance unit for liquids).Reference Beke, Szekrényes, Balogh, Veres, Fazakas, Varga, Kamarás, Czigány and Gali17 Our study revealed Si–O–Si, C–O–C, CH, COOH, and COO− groups on the SiC QDs surfaces. Thanks to these polar and/or ionic groups on the surface, SiC QDs make stable colloids in water and open new possibilities for further functionalization processes.
C. Growth inhibition assay
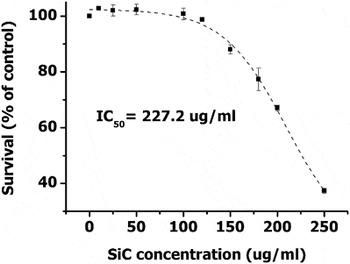
The immortal HeLa cell lines pertaining to human cervical adenocarcinoma were purchased from the major cell-line depository, American Type Culture Collection (ATCC). The cells were cultured in Dulbecco’s Modified Eagle Medium (DMEM)/ F12 HAM nutrient mixture (Sigma-Aldrich Co. LLC, St. Louis, MI) supplemented with Penicillin–Streptomycin solution (Gibco; 50 mg/mL;) and 10% fetal bovine serum (FBS) (GIBCO Products International, Inc., Langley, OK). Cell viability was measured by alamarBlue™ Cell Viability Assay Kit (Biotium, Inc., Hayward, CA). Exponentially growing cells were plated in an equal number (4000 cells/well) onto 96-well tissue culture plates. The cells were exposed for 48 h to increasing concentrations of SiC QDs. After 48 h, alamarBlue™ solution was added to each well at 10% (v/v) and the cells were further incubated for 3 h. The resulting fluorescence was measured using 530 nm excitation and 590 nm emission wave lengths in a microtiter plate-reader WallacVictor-2 (Perkin Elmer, Waltham, MA). IC50 values were defined as the applied SiC QD concentration (μM) required for half-maximal inhibitory effect on cell growth. IC50 values were calculated by nonlinear curve-fitting using Origin Lab 8.5 software. Experiments were performed in triplicate and standard deviation values were calculated (Fig. 3)
Cell viability measurement results and calculated IC50 value for SiC QDs by the use of AlamarBlue assay.

Based on our growth inhibition assay, it could be seen that SiC QDs created in this study do not affect cell growth in a wide concentration range. They can be applied even up to 100 μg/mL in the medium without significant effect on cell survival for 48 h. This implies the possible use of such nanocrystals for live cell labeling techniques.
Botsoa et al.Reference Botsoa, Lysenko, Géloën, Marty, Bluet and Guillot15 and Serdiuk et al.Reference Serdiuk, Lysenko, Skryshevsky and Géloën16 demonstrated that SiC QDs formed by means of electrochemical anodization of a bulk SiC polycrystalline wafer were able to penetrate through the cell membrane. In our similar experiments, we did not find any specific uptake mechanism: there were no differences between the samples treated by SiC QDs and the reference sample except for higher background fluorescence from the SiC QD treated sample (not shown). The contradiction between previous resultsReference Botsoa, Lysenko, Géloën, Marty, Bluet and Guillot15, Reference Serdiuk, Lysenko, Skryshevsky and Géloën16 and the ones presented here may stem from the preparation method: in our electroless wet chemical etching method we apply an oxidizing agent, HNO3, that could result in different surface compared with the case of previous experiments based on electrochemical etching where only HF and ethanol are applied as solvents. This property of our SiC QDs may be advantageous in controlling their future functionalization for tracking exclusively the targeted biomolecules.
D. Two-photon microscopy
Our PL measurements indicate a strong excitation in the green wave length region upon appropriate excitation energy (see Fig. 2). As the excitation wave length moves toward 400 nm, the emission shows a small red shift. For in vivo studies red or near-infrared region excitation and emission are desirable. Two-photon excitation of SiC QDs may work efficiently for in vivo bioimaging because short near-infrared pulses can penetrate deeply in organic tissues (unlike photons in the ultraviolet or visible region), and our SiC QDs absorb single photons in the ultraviolet region, which corresponds to absorption in the near-infrared region by two-photon processes.
Indeed, we demonstrate here that our SiC QDs have a strong emission due to two-photon excitation. We detected fluorescence from SiC QDs injected to neuron cells by a two-photon microscope. Two-photon imaging was performed using a Femto2D Two-Photon Laser Scanning Microscope (2PLSM; Femto2D, Femtonics Ltd., Budapest, Hungary) with an ultrafast Ti:Sapphire laser (Mai Tai, Spectra Physics) tuned from 740 to 850 nm.Reference Katona, Szalay, Maák, Kaszás, Veress, Hillier, Chiovini, Vizi, Roska and Rózsa19 Optimal excitation wave length for imaging in red channel (emission wave lengths between 600 and 700 nm) was around 830 nm. The excitation laser energy was ∼60 mW before the objective.
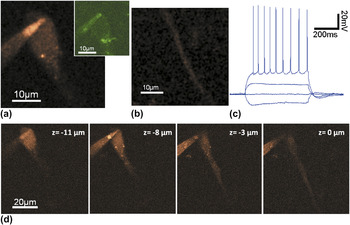
Whole cell patch-clamp recordings were made from CA1 pyramidal neurons in acute 300 μm mouse hippocampal slices. Cells were filled with intracellular solution (ICs) and SiC QDs (concentration of 0.5 mg/mL) via the patch-pipette (6–9 MΩ). Images were taken at ∼40 μm under the slice surface. Cells in the middle of CA1 stratum pyramidale were identified as pyramidal cells by video microscopy using oblique infrared illumination and by analyzing their response to somatic current injections, serving also as a measure of cell viability [Fig. 4(c)]. The neuronal cell body, soma, was clearly visible in the red channel, and even the apical dendrite near to the soma could be resolved [Fig. 4(b)]. However the signal contrast was relatively weak in the green channel [425–525 nm, Fig. 4(a)], which is a bit unexpected since the maximum emission of SiC QDs in water is in the green channel by single photon excitation. Possibly, the altered ion and protein concentrations might generate a change in the emission spectra and fluorescent intensity as it also occurs in case of other fluorescent dyes.Reference Maravall, Mainen, Sabatini and Svoboda20 Further investigations are needed to clear this issue. Z-stacks of red channel images were also taken confirming homogeneous loading of soma and proximal dendrites [Fig. 4(d)]. As we expected from the bioinert property of SiC QDs, no sign of cellular damage of the pyramidal neurons was observable during the long (>1 h) measurement duration. In addition, basic electrophysiological properties (action potential threshold, peak width and amplitude; membrane potential; firing rate) have not changed significantly during the measurement indicating the lack of cellular toxicity. This study implies that our SiC QDs may be good candidates as luminescent biomarkers for neuroscience.
Two-photon imaging of a neuron labeled by SiC QDs. (a) Representative 2PLSM image of a CA1 hippocampal pyramidal neuron filled with SiC QDs. Red fluorescence signal (600–700 nm, red channel) was generated at 830 nm excitation. Inset, the same neuron but fluorescent signal was collected from 425 to 525 nm (green channel). (b) Red channel image of the apical dendrite of the neuron. (c) Somatic membrane voltage responses of the neuron induced by somatic current injection show normal functioning of the neuron. (d) 2PLSM images collected at different depths using 800 nm excitation.

III. SUMMARY
In summary, well-defined spherical colloidal cubic SiC nanocrystals with average diameter of 3 nm were synthesized using the reactive bonding and inexpensive wet chemical etching method. Based on our growth inhibition assay it could be seen that SiC nanocrystals created in this study do not affect cell growth in a wide concentration range. They can be applied even up to 100 μg/mL in the cell medium without significant effect on cell survival for 48 h. This implies the possibility of use of such nanocrystals safely for live cell labeling techniques. We demonstrate that SiC fluorophores are feasible candidates for two-photon in vitro bioimaging.
ACKNOWLEDGMENTS
Hungarian OTKA Grant No. 101819 and Bolyai János Research Scholarship of HAS for Zs.C. are acknowledged. A.G. and L.B. acknowledge the support from the special research program “Lendület” from the Hungarian Academy of Sciences. Two-photon imaging was supported by Hungarian-French Grant (TÉT_10-1-2011-0389), Hungarian-Swiss Grant (SH/7/2/8), and OTKA (K 105997). Hungarian OTKA Grant Nos. 106114 and 106216 are also acknowledged.