1. Introduction
Compared with traditional propellers, jet propulsion systems offer faster and more precise delivery of thrust impulses (Mohseni Reference Mohseni2006; Athanassiadis Reference Athanassiadis2016). These advantages make jet propulsion a promising solution for next-generation underwater propulsion, particularly in applications that demand precise position control and high manoeuvrability. In such systems, both starting jets (also known as single-pulsed jets) and continuous pulsed jets exhibit enhanced thrust generation due to their inherently unsteady characteristics. This was first deduced theoretically by Weihs (Reference Weihs1977) and later confirmed experimentally by Krueger & Gharib (Reference Krueger and Gharib2003). In addition, this propulsion mode has been adopted by many aquatic animals in nature, including squids (Muramatsu et al. Reference Muramatsu, Yamamoto, Abe, Sekiguchi, Hoshi and Sakurai2013; Bartol et al. Reference Bartol, Krueger, Jastrebsky, Williams and Thompson2016), jellyfish (Gemmell et al. Reference Gemmell, Costello, Colin, Stewart, Dabiri, Tafti and Priya2013), salps (Bone & Trueman Reference Bone and Trueman1983; Sutherland & Madin Reference Sutherland and Madin2010; Sutherland & Weihs Reference Sutherland and Weihs2017) and siphonophores (Costello et al. Reference Costello, Colin, Gemmell, Dabiri and Sutherland2015; Jiang, Costello & Colin Reference Jiang, Costello and Colin2021; Du Clos et al. Reference Du Clos, Gemmell, Colin, Costello, Dabiri and Sutherland2022). Based on the number of jets, it can be further classified into single-jet (e.g. squids and jellyfish) and multi-jet propulsion (e.g. salps and siphonophores).
The multi-jet propulsion offers several advantages over the single-jet propulsion. Firstly, by combining multiple jets, it provides a more practical direction for engineering development, such as in scalable marine robotic swarms (Costello et al. Reference Costello, Colin, Gemmell, Dabiri and Sutherland2015; Athanassiadis Reference Athanassiadis2016). Secondly, the multi-jet propulsion enables optimal propulsive performance across various tasks through different operational strategies. Costello et al. (Reference Costello, Colin, Gemmell, Dabiri and Sutherland2015) found that siphonophores employ weaker jets from younger individuals at the head for manoeuvring and stronger jets from mature individuals at the tail for primary propulsion. In addition, as for the timing of multiple jets, both salps and siphonophores exhibit simultaneous initiation that generates larger thrust for rapid acceleration, while sequential initiation (i.e. non-simultaneous) ensures continuous thrust for efficient cruising (Bone & Trueman Reference Bone and Trueman1983; Athanassiadis Reference Athanassiadis2016; Du Clos et al. Reference Du Clos, Gemmell, Colin, Costello, Dabiri and Sutherland2022). However, the multi-jet propulsion inevitably involves interactions between adjacent starting jets, which may alter the resultant propulsive characteristics.
Based on the current research progress in underwater propulsion using starting jets, it is essential to investigate the influence of interactions between adjacent starting jets on the propulsive characteristics. The application of starting jets to underwater propulsion has primarily focused on single-jet propulsion. For instance, Krueger et al. (Reference Krueger, Moslemi, Nichols, Bartol and Stewart2009), Moslemi & Krueger (Reference Moslemi and Krueger2010,Reference Moslemi and Krueger2011) and Ruiz, Whittlesey & Dabiri (Reference Ruiz, Whittlesey and Dabiri2011) developed underwater vehicles named as Robosquid, which share similar actuation mechanisms. Although Mohseni (Reference Mohseni2006) and Krieg & Mohseni (Reference Krieg and Mohseni2008) employed multiple Helmholtz synthetic jet actuators to generate multiple jets in their underwater vehicle designs, the interactions between these jets could be ignored due to the significant distance between these actuators. Considering the requirements for manoeuvrability and controllability of underwater vehicles, as well as the potential for scalable marine robotic swarms, the multi-jet propulsion emerges as a more promising choice. However, both the compact design of underwater propulsion systems (Athanassiadis Reference Athanassiadis2016; Jiang et al. Reference Jiang, Costello and Colin2021) and the group propulsion observed in salps and siphonophores (Sutherland & Madin Reference Sutherland and Madin2010; Du Clos et al. Reference Du Clos, Gemmell, Colin, Costello, Dabiri and Sutherland2022) suggest that the spacing between starting jets is sufficiently small for their interactions to become significant.
The propulsive characteristics of multiple starting jets with mutual interactions have received limited attention, whereas those of a single starting jet have been extensively investigated. Krueger & Gharib (Reference Krueger and Gharib2003) first proposed that the thrust generated by a starting jet can be enhanced by over-pressure (Krueger Reference Krueger2005), which originates from the acceleration of additional fluid associated with the formation of a leading vortex ring. This additional fluid can be categorised into entrained mass (Dabiri & Gharib Reference Dabiri and Gharib2004) and added mass (Dabiri Reference Dabiri2006). Moreover, it reduces kinetic energy loss in the wake while delivering the same impulse, thereby improving propulsive efficiency (Dabiri Reference Dabiri2009; Linden Reference Linden2011). Recently, Gao et al. (Reference Gao, Wang, Yu and Chyu2020) systematically analysed the transient thrust development of a starting jet and correlated it with the formation of the leading vortex ring, the acceleration and deceleration processes and the emergence of a stopping vortex ring. These investigations collectively demonstrate that the formation of a leading vortex ring plays a crucial role in the propulsive characteristics of starting jets, with optimal vortex formation recognised as a unifying principle in biological propulsion (Dabiri Reference Dabiri2009). Therefore, factors that influence the formation of the leading vortex ring are also expected to affect the propulsive characteristics of starting jets. One such factor is the background co-flow (background flow in the jet direction), which reduces the circulation growth rate and accelerates the downstream translation of the leading vortex ring, ultimately resulting in a weaker vortex ring (Krueger, Dabiri & Gharib Reference Krueger, Dabiri and Gharib2006; Zhu et al. Reference Zhu, Zhang, Gao and Yu2023). Correspondingly, Jiang & Grosenbaugh (Reference Jiang and Grosenbaugh2006), Whittlesey & Dabiri (Reference Whittlesey and Dabiri2013) and Zhu et al. (Reference Zhu, Zhang, Xia, Yu and Gao2024a) suggested that the background co-flow has a negative influence on the propulsive performance of the starting jet. Since the leading vortex rings generated by adjacent starting jets inevitably interact with each other (Fohl & Turner Reference Fohl and Turner1975; Sargordi et al. Reference Sargordi, Chtchetinina, Di Labbio, Ng and Kadem2020; Chevalier Reference Chevalier2023), such interactions are expected to significantly influence the propulsive characteristics of multi-jet propulsion. Therefore, the interactions between twin-starting jets, which are arranged in parallel and initiated with identical conditions, warrant further investigation.
To the best of our knowledge, only Athanassiadis & Hart (Reference Athanassiadis and Hart2016) and Athanassiadis (Reference Athanassiadis2016) have examined the influence of interactions between twin-starting jets on their propulsive characteristics. By developing a thrust estimation method based on high-speed fluorescence imaging, they found that the interactions between twin-starting jets result in a reduction in average thrust by decreasing the average velocity of wakes. The underlying mechanism for average thrust reduction was speculated to result from the geometric constraints and the lower pressure induced by neighbouring vortex rings. On one hand, the mutual approach of two starting jets constrains the streamlines exiting from nozzles, reducing their curvature and consequently weakening the over-pressure effect. On the other hand, the low pressure induced by adjacent vortex rings further reduces the pressure near the nozzle exits. However, these speculations have not been quantitatively validated due to the absence of non-invasive measurement techniques to obtain pressure or velocity profiles at the nozzle exit in experiments. As a result, the transient development of thrust cannot be accurately determined. Athanassiadis & Hart (Reference Athanassiadis and Hart2016) also pointed out that the thrust estimation method, based on high-speed fluorescence imaging, involves a significant margin of error and is limited to a qualitative assessment of the interaction effects between twin-starting jets. These limitations can be overcome through numerical investigations, as it enables the accurate acquisition of velocity and pressure profiles at the nozzle exit for thrust determination. Moreover, the influence of twin-starting jets interactions on propulsive characteristics has been investigated only at a single stroke ratio with unspecified velocity programs, both of which are critical factors governing the formation of leading vortex rings (Gharib, Rambod & Shariff Reference Gharib, Rambod and Shariff1998; Rosenfeld, Rambod & Gharib Reference Rosenfeld, Rambod and Gharib1998).
Therefore, the influence of interactions between parallel twin-starting jets on their propulsive characteristics, mainly the generation of thrust, is to be systematically investigated via numerical method in the present work. The thrust generated by the twin-starting jets is directly evaluated from the velocity and pressure profiles at the nozzle exits. Special attention is paid to the transient development of thrust and the underlying mechanisms governing the interactions between twin-starting jets. Additionally, the present work explores the influence of different stroke ratios and velocity programs. The manuscript describes the physical problem and numerical method in § 2. Relevant results and discussions are presented in § 3. Finally, § 4 concludes with a brief summary of major findings.
2. Physical problem and numerical method
The interactions between two identical starting jets (hereinafter referred to as twin-starting jets) are investigated. Two parameters, i.e. the dimensionless distance
 $S/D$
and the stroke ratio
 $L/D$
, are the primary focus of present work. Two nozzles generating the starting jets are arranged in parallel and their exits are located in the same plane with the same diameter
 $D$
. Here,
 $S/D$
is the dimensionless parameter defined as the distance between the two nozzle axes normalised by
 $D$
, which ranges from 1.1 to 4, indicating varying degrees of interaction between the twin-starting jets. From the perspective of interactions between leading vortex rings, this range of
 $S/D$
covers the transition from strong interactions characterised by vortex ring reconnection to negligible interaction effects (Chevalier Reference Chevalier2023). Also,
 $L/D$
is the length-to-diameter ratio of the jet column, calculated as
 \begin{equation} L/D=\dfrac {\int _0^T U_{\!j}(t)\, {\rm d}t}{D}, \end{equation}
where
 $T$
represents the duration of starting jet, and
 $t$
is the physical time since the initiation of starting jet. A simple trapezoidal velocity program
 $U_{\!j}(t)$
(Rosenfeld et al. Reference Rosenfeld, Rambod and Gharib1998) is adopted, i.e.
 \begin{equation} U_{\!j}(t)=\left \{ \begin{array}{lr@{\hspace{0.07cm}}r@{\hspace{0.08cm}}l} U_{\textit{max}}\dfrac {t}{T_a} & \quad 0\leqslant &t&\lt T_a, \\ U_{\textit{max}} & \quad T_a \leqslant &t&\lt T-T_d, \\ U_{\textit{max}}\dfrac {T-t}{T_d} & \quad T-T_d\leqslant &t&\lt T, \\0 & \quad T\leqslant &t&, \\ \end{array} \right . \end{equation}
where
 $T_a$
and
 $T_d$
denote the durations of acceleration and deceleration stages, respectively. The jet velocity during the constant velocity stage
 $U_{\textit{max}}$
corresponds to a Reynolds number of 1000, defined as
 $\textit{Re}=(\rho U_{\textit{max}} D)/\mu$
, where
 $\rho$
and
 $\mu$
are the density and dynamic viscosity of the fluid, respectively. In addition, the formation time
 $t^*$
is defined as follows:
 \begin{equation} t^*=\left \{ \begin{array}{lr@{\hspace{0.05cm}}r@{\hspace{0.05cm}}l} (\int _0^tU_{\!j}(t)\,{\rm d}t)/D& \quad t&\lt T, \\ (\overline {U\!}t)/D & \quad t&\gt T, \\ \end{array} \right . \end{equation}
where
 $\overline {U}$
is the time-averaged value of
 $U_{\!j} (t)$
during the duration of starting jet.
Summary of the cases considered in present work with different dimensionless distances
 $S/D$
, stroke ratios
 $L/D$
and velocity programs.

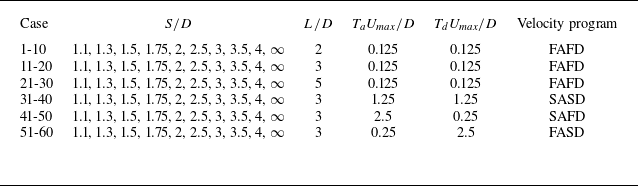
In the present work, the investigated cases are divided into six groups according to different combinations of velocity program parameters, as summarised in table 1. Each group contains 10 cases with
 $S/D$
ranging from 1.1 to 4 and
 $\infty$
. Cases with
 $S/D=\infty$
correspond to a single starting jet and serve as the baseline reference. The first three groups, i.e. cases 1-10, cases 11-20 and cases 21-30, are designed to investigate the influence of
 $L/D$
. Different values of
 $L/D$
are obtained by adjusting only the duration of constant velocity stage, thereby avoiding the influence of variations in the acceleration or deceleration stages. Cases 31-40, cases 41-50 and cases 51-60 are compared with cases 11-20 to examine the influence of adjusting acceleration and deceleration rates. In the present work, four types of velocity programs with different acceleration and deceleration rates are considered: fast acceleration and fast deceleration (FAFD), slow acceleration and slow deceleration (SASD), slow acceleration and fast deceleration (SAFD), as well as fast acceleration and slow deceleration (FASD).
Investigations are to be conducted via numerical methods, enabling the acquisition of velocity and pressure profiles at the nozzle exits. Similar to Zhu et al. (Reference Zhu, Zhang, Gao and Yu2022, Reference Zhu, Zhang, Yu, Gao and Zhao2024b), the computational fluid dynamics software ANSYS Fluent 2021.R1 is adopted to solve the unsteady and incompressible Navier–Stokes equations. The large eddy simulation method, combined with the wall-adapting local eddy-viscosity subgrid-scale model, is used to better resolve the interactions between vortical structures in twin-starting jets. The pressure implicit with splitting of operator algorithm, which is more suitable for unsteady flow simulations, is adopted to address the pressure–velocity coupling in incompressible flow simulations. For the discretisation of the unsteady and incompressible Navier–Stokes equations, the least-square cell-based, second-order, bounded central differencing and bounded second-order implicit methods are used to deal with the gradient, pressure, momentum and unsteady terms, respectively. The reliability of this numerical methods for simulating the formation of starting jets and the interactions between vortical structures has been extensively validated by Zhu et al. (Reference Zhu, Zhang, Gao and Yu2022, Reference Zhu, Zhang, Gao and Yu2023) through detailed comparisons with experimental results, including vortex core trajectories and circulation growth.
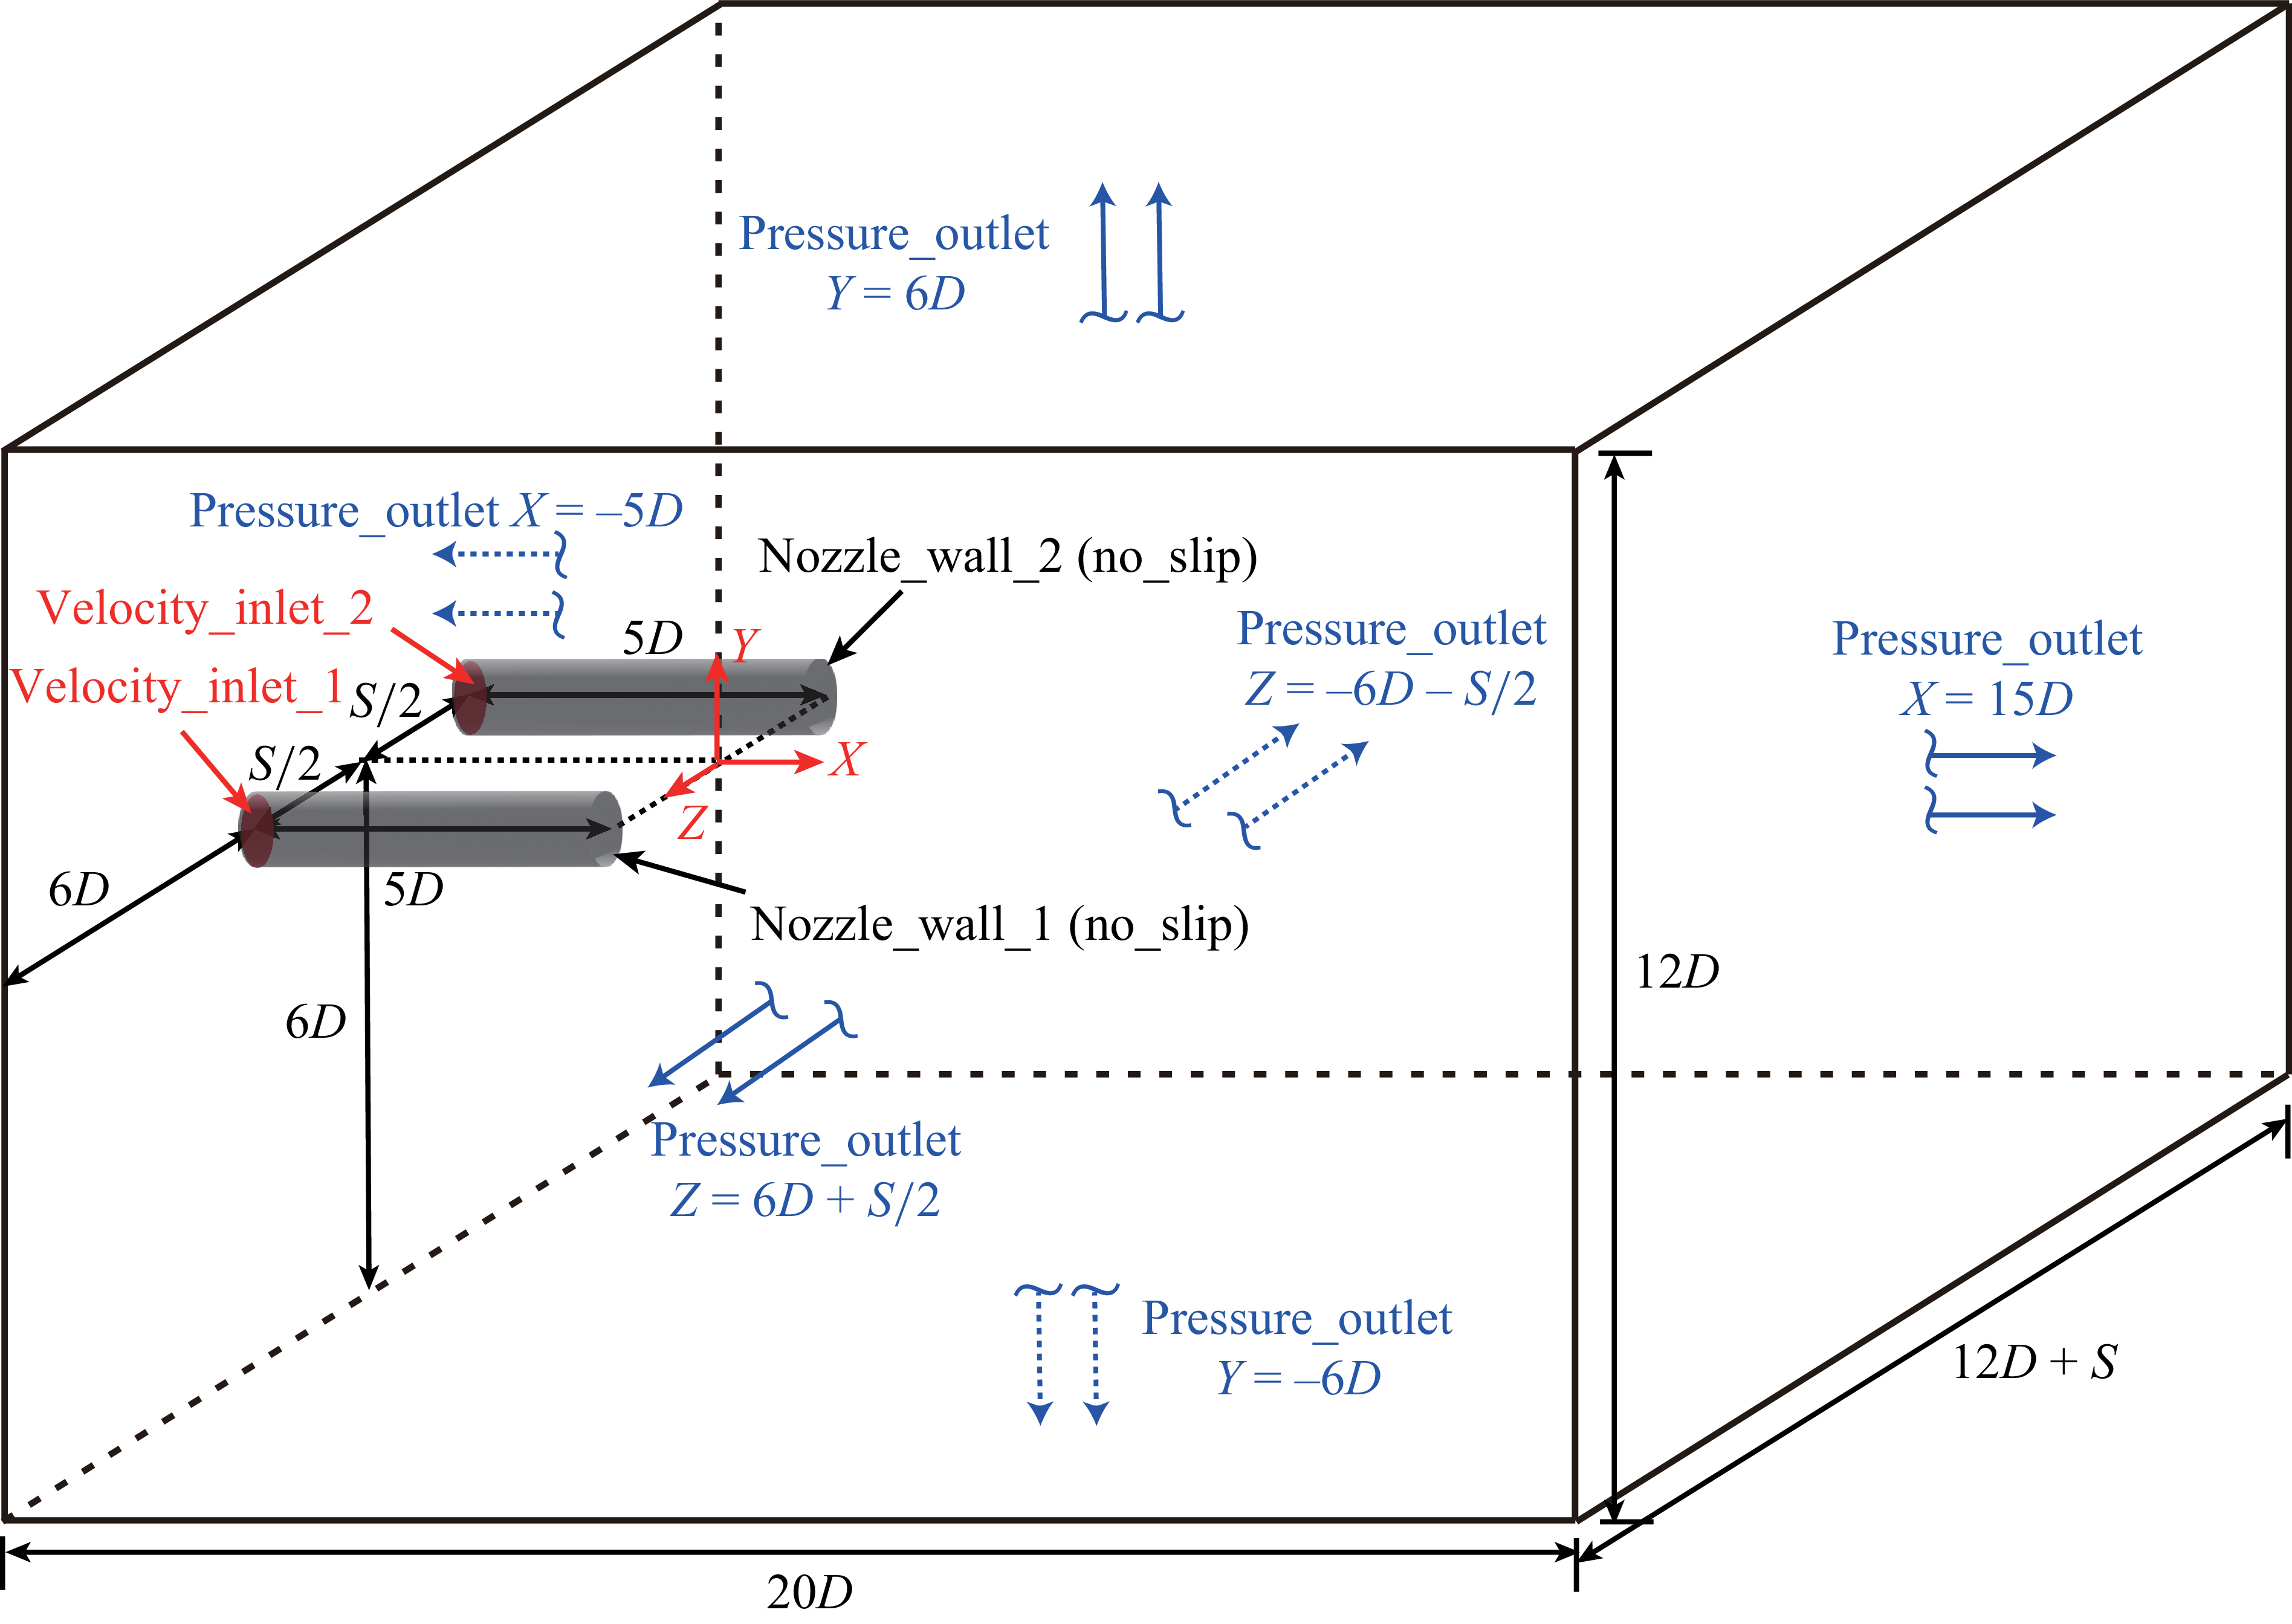
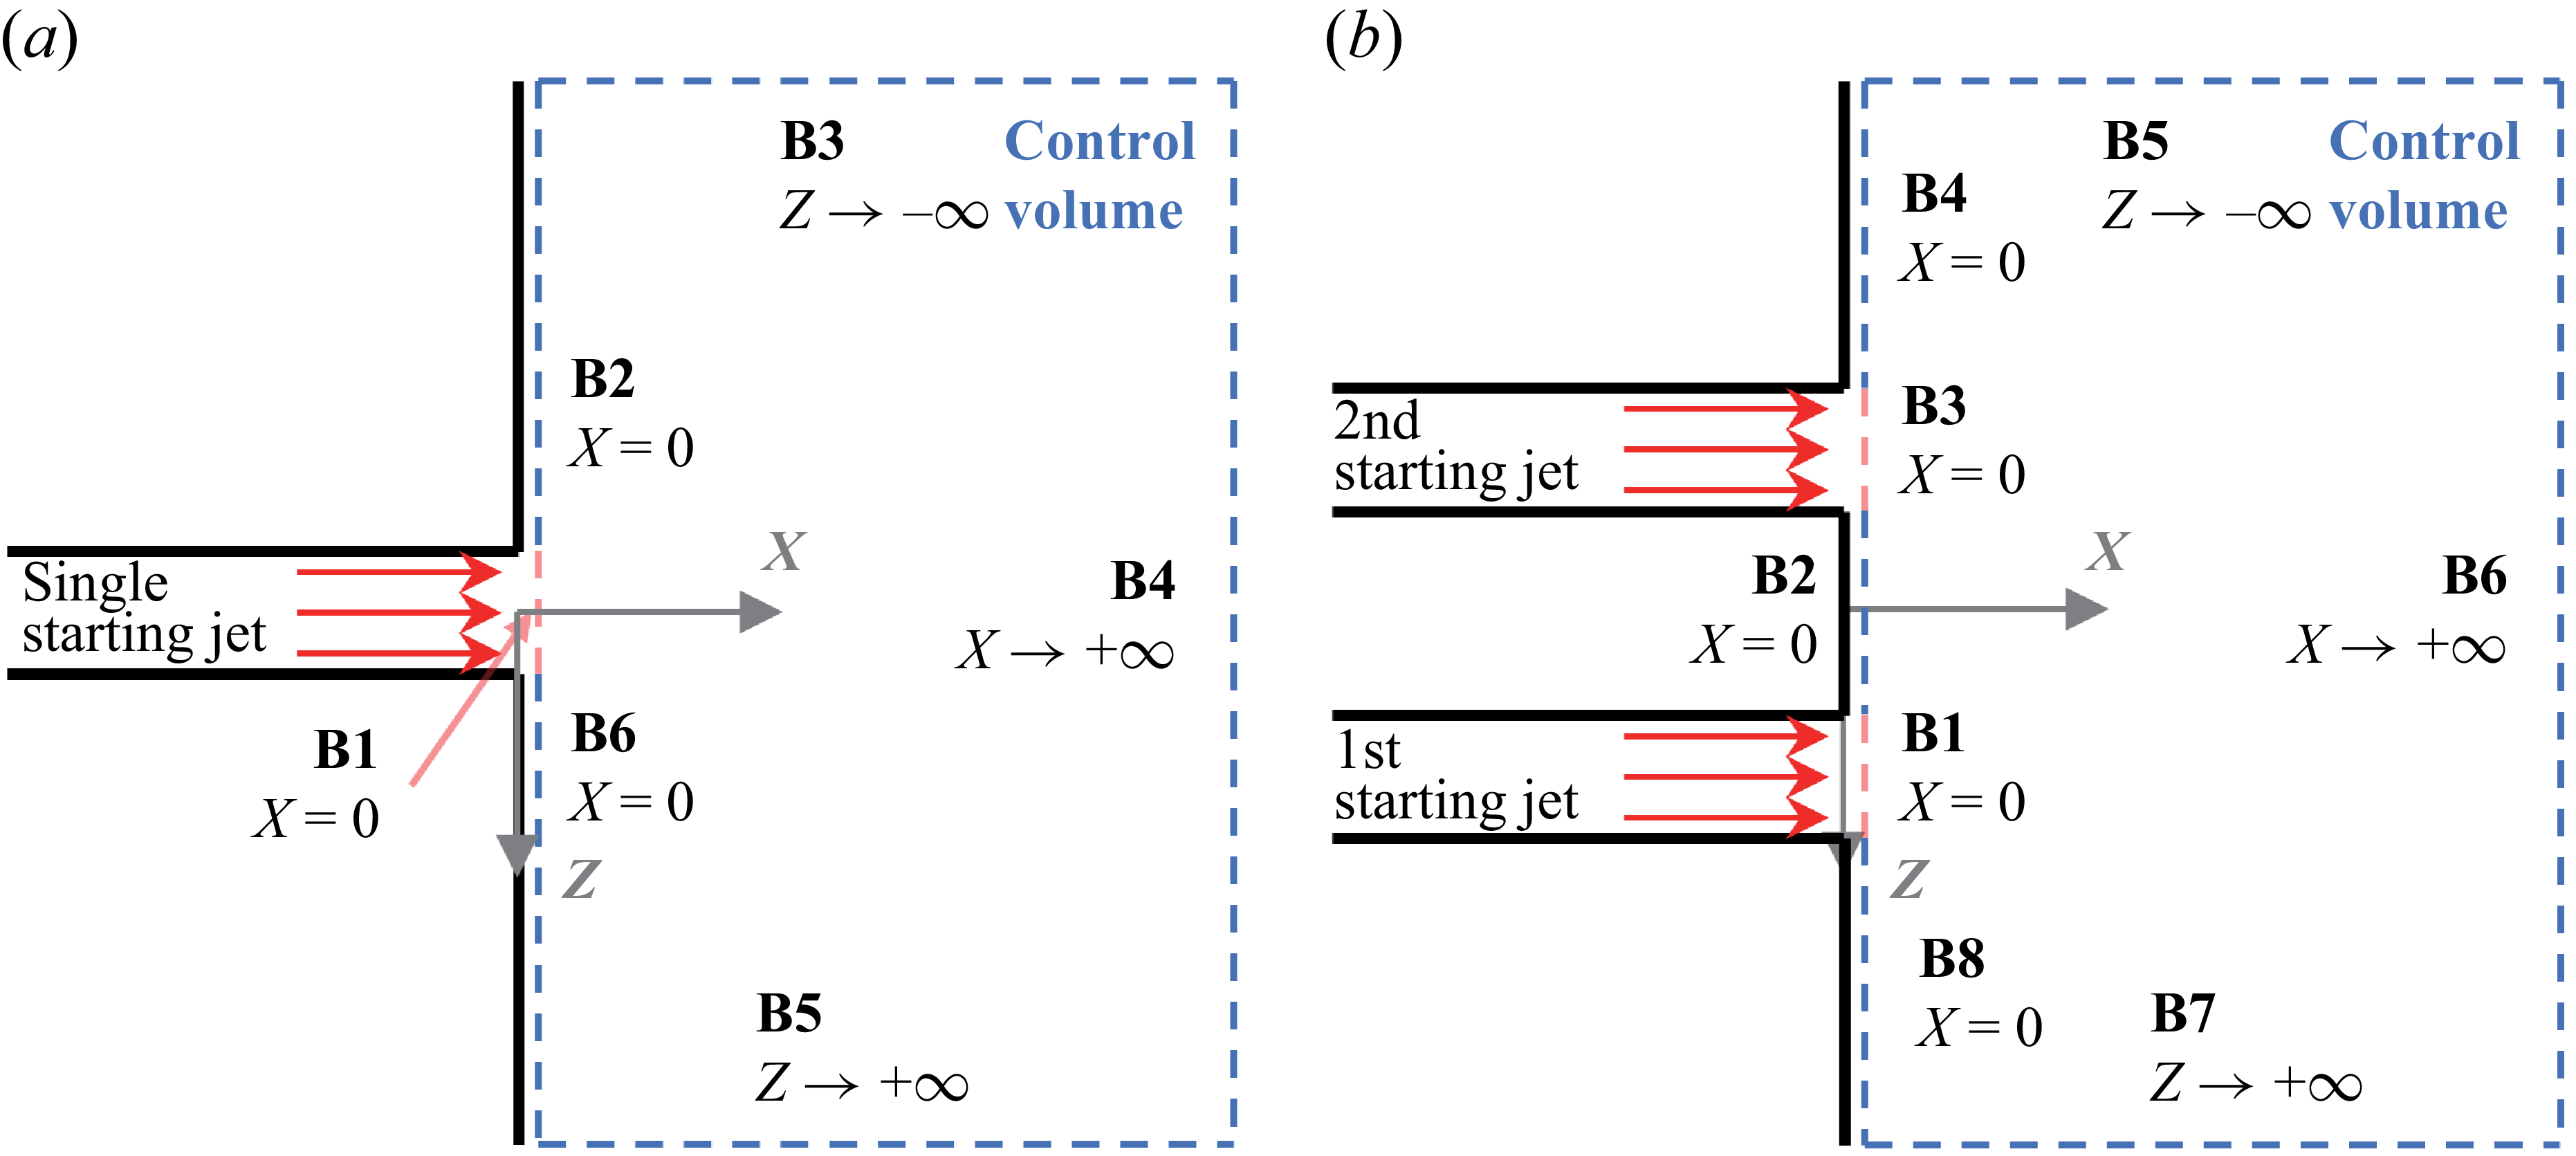
The schematic of the computational domain together with corresponding boundary conditions is shown in figure 1. The twin-starting jets are generated by two cylindrical nozzles with a no-slip boundary condition and the assumption of zero thickness. The coordinate system origin is defined at the midpoint of the line connecting the centres of the two nozzle exits, with the
 $X$
-axis parallel to the nozzle axes. The
 $Y$
-axis and
 $Z$
-axis are perpendicular to and aligned with the line connecting the centres of the two nozzle exits, respectively. Consequently, the exits of both nozzles are located in the
 $Y{-}Z$
plane. Two velocity inlets, located at
 $X=-5D$
, are used to generate the starting jets (Rosenfeld et al. Reference Rosenfeld, Rambod and Gharib1998). The starting jet generated by
 $velocity\_inlet\_1$
, located at
 $Z\gt 0$
, is denoted as the first starting jet, while that from
 $velocity\_inlet\_2$
corresponds to the second starting jet. The simple trapezoidal velocity program, i.e. (2.2), is applied at both velocity inlets. The outer boundaries of the computational domain, excluding the regions of velocity inlets, are set as pressure outlets to simulate an unconfined space with constant ambient pressure. The size of computational domain is
 $[-5D:15D]\times [-6D:6D]\times [-(6D+S/2):(6D+S/2)]$
in the
 $X$
-,
 $Y$
- and
 $Z$
- directions, respectively. This size has been verified to be sufficiently large to eliminate boundary effects through a domain independence test. For cases with
 $S/D=\infty$
, the computational domain contains only one nozzle and velocity inlet to generate a single starting jet, with the coordinate origin located at the centre of nozzle exit. Correspondingly, the size of computational domain is adjusted to
 $[-5D:15D]\times [-6D:6D]\times [-6D:6D]$
in the
 $X$
-,
 $Y$
- and
 $Z$
- directions, respectively.
Schematic of the computational domain and boundary conditions applied for the twin-starting jets.

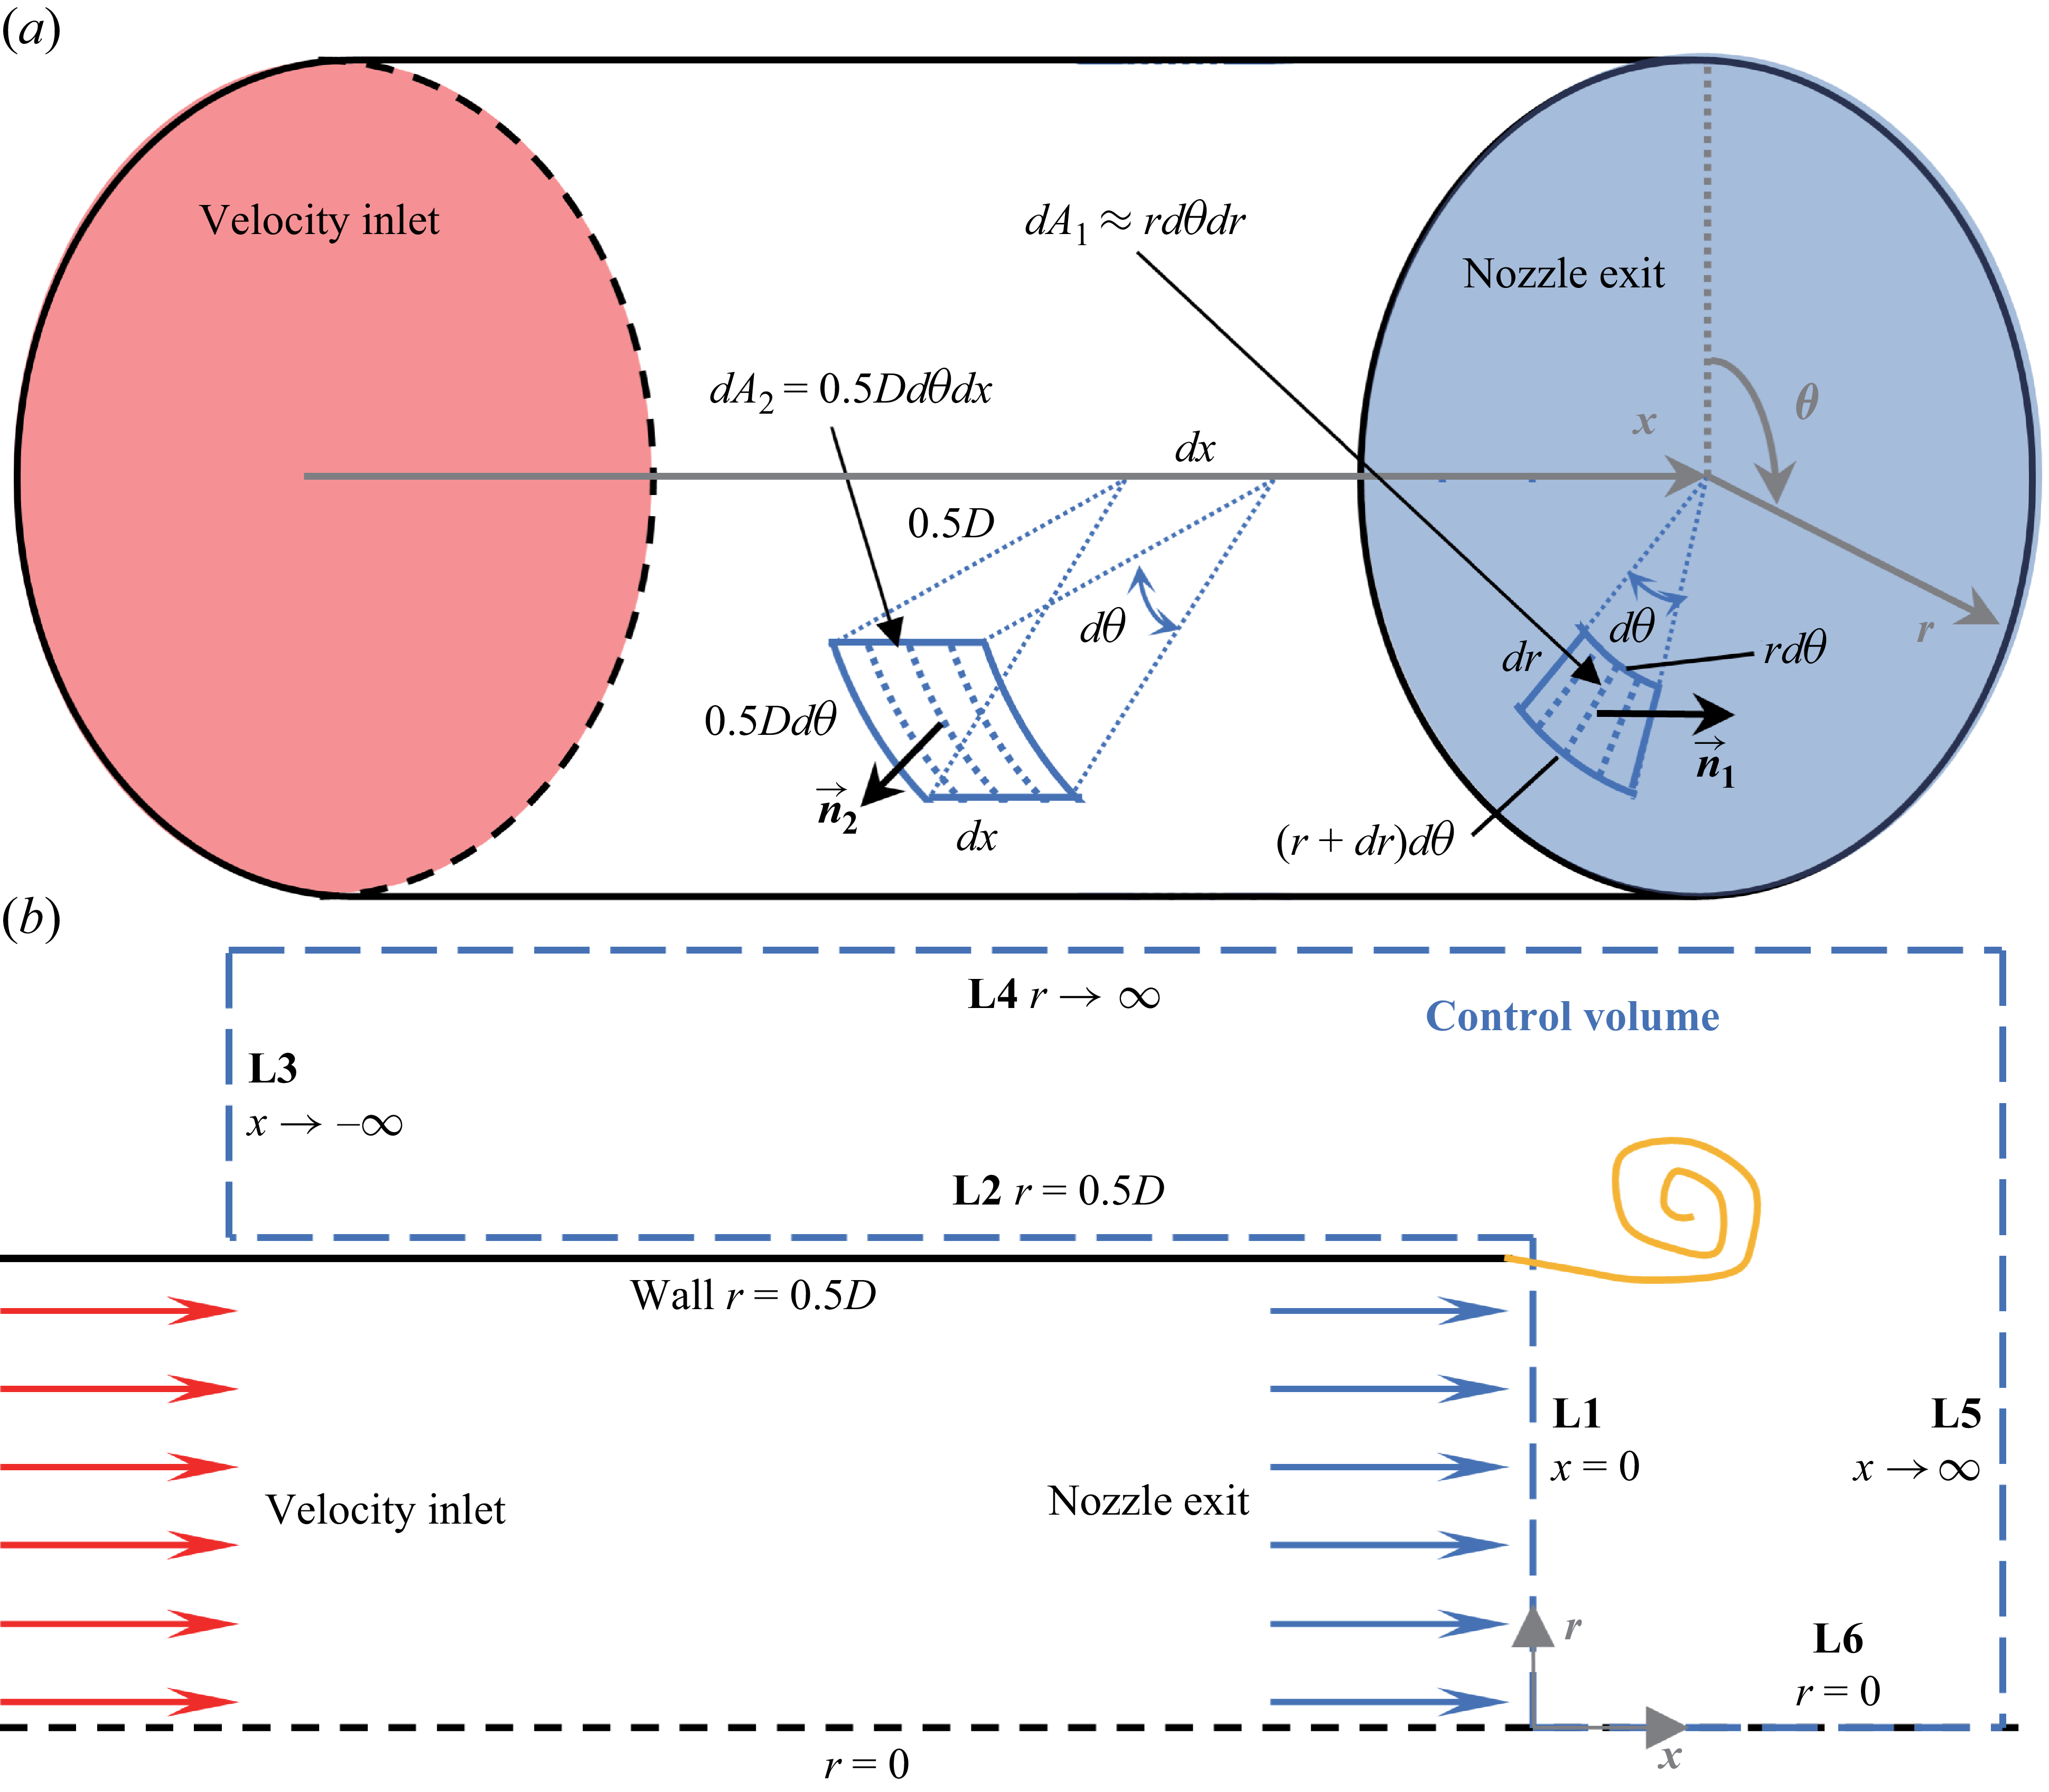
The force generated by the starting jet corresponds to the reaction force exerted on the surrounding fluid outside the nozzle. A cylindrical coordinate system
 $(x,r,\theta )$
is established around one cylindrical nozzle, as shown in figure 2(a). Based on this, a control volume is defined, as shown in figure 2(b), in the
 $x{-}r$
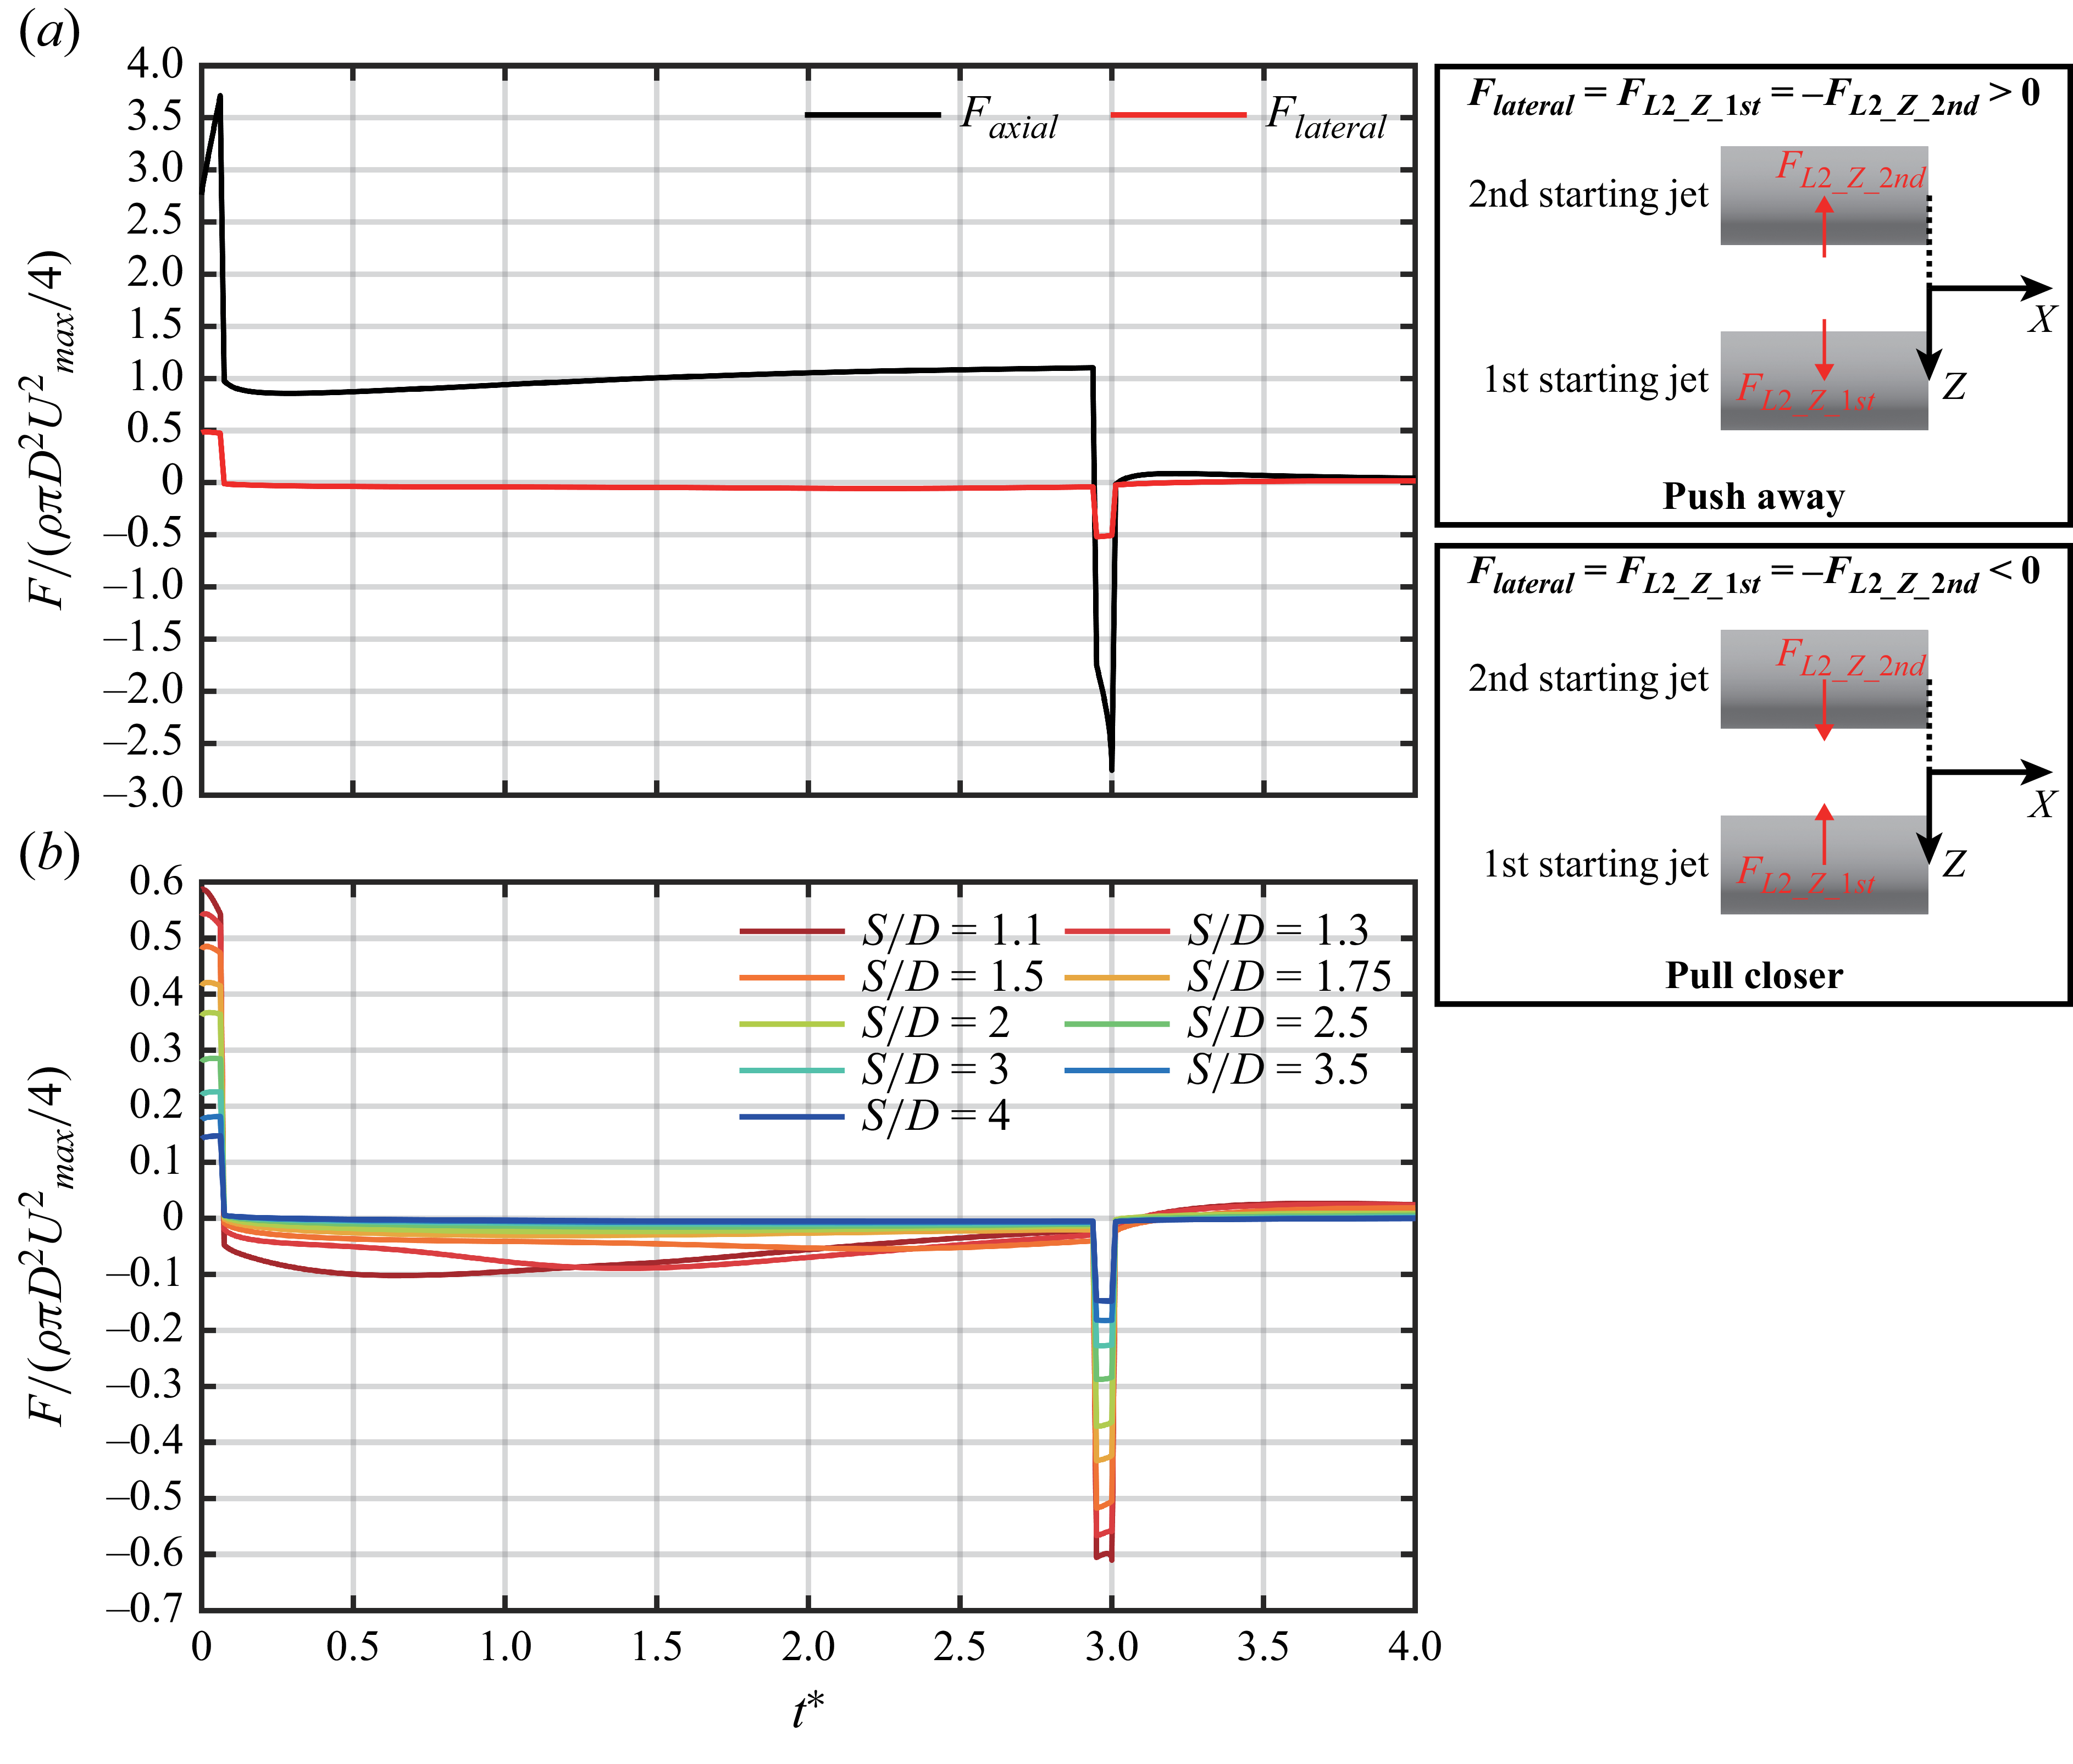
plane passing through the nozzle axis. The boundary of control volume in the current view is divided into 6 segments, labelled L1 to L6. The force on segment L1 arises from by the momentum flux released from the nozzle and the local pressure, which can be calculated from the velocity and pressure profiles at the nozzle exit (Zhu et al. Reference Zhu, Zhang, Yu, Gao and Zhao2024b). The force on segment L2 corresponds to the fluid reaction force on the nozzle outer wall, which is mainly caused by static pressure and shear force. This force component was not considered by Jiang & Grosenbaugh (Reference Jiang and Grosenbaugh2006) and Gao et al. (Reference Gao, Wang, Yu and Chyu2020), where only the force acting on segment L1 was considered. This is because the force on segment L2 is two orders of magnitude smaller than that on segment L1 for the single starting jet. However, this no longer holds in the case of twin-starting jets (see figure 21 in the Results and Discussion). Segments L3, L4 and L5 are influenced solely by the ambient static pressure. In order to account the forces acting on them, only the difference between the local pressure and the ambient pressure, i.e. the gauge pressure, is used when calculating the pressure components on segments L1 and L2. Segment L6 lies along the symmetry axis within the control volume and does not contribute to the force balance. Therefore, it is not considered. Finally, the thrust generated by the starting jet is defined as positive when the force acting on the control volume is directed along the positive
 $x$
-axis (equivalent to the
 $X$
-axis of the Cartesian coordinate system in the computational domain), and negative when it acts in the opposite direction.
(a) Cylindrical coordinate system
 $(x,r,\theta )$
and (b) control volume used for analysing the force generated by the starting jet.

The equation for the force generated by the starting jet is provided in cylindrical coordinate system
 $(x,r,\theta )$
, as shown in figure 2(a). The force acting on segment L1 can be calculated as
 \begin{equation} F_\textit{L1}=\int _0^{0.5D}\!\int _0^{2\pi }[P(x,r,\theta )|_{x=0}+\rho u^2(x,r,\theta )|_{x=0}]r\, {\rm d}\theta\, {\rm d}r, \end{equation}
where
 $P(x,r,\theta )|_{x=0}$
and
 $u(x,r,\theta )|_{x=0}$
are the gauge pressure and the velocity component along the
 $x$
-axis at the nozzle exit. Since the normal vector of nozzle exit
 $\overrightarrow {n}_1$
is aligned with the
 $x$
-axis,
 $F_\textit{L1}$
can be directly calculated as a scalar. It is positive when the force acting on the control volume aligns with the positive
 $x$
-axis direction, and vice versa.
The force acting on segment L2 can be written as
 \begin{equation} \overrightarrow {F}_{\!\textit{L2}}=\int _{-\infty }^{0}\int _0^{2\pi }0.5D[P(x,r,\theta )|_{r=0.5D}\boldsymbol{\cdot }\overrightarrow {n}_{\!2}+\boldsymbol{\tau }(x,r,\theta )|_{r=0.5D}\boldsymbol{\cdot }\overrightarrow {n}_{\! 2}]\,{\rm d}\theta\, {\rm d}x, \end{equation}
where
 $P(x,r,\theta )|_{r=0.5D}$
and
 $\boldsymbol{\tau }(x,r,\theta )|_{r=0.5D}$
are the gauge pressure and shear stress on the nozzle outer wall. Since
 $\overrightarrow {n}_{\!2}$
is perpendicular to the
 $x$
-axis, which is equivalent to the
 $X$
-axis, the contribution of
 $P(x,r,\theta )|_{r=0.5D}$
to
 $\overrightarrow {F}_{\!\textit{L2}}$
lies in the
 $Y{-}Z$
plane. The parameter
 $\boldsymbol{\tau }(x,r,\theta )|_{r=0.5D}$
can be further expressed in tensor form in the Cartesian coordinate system for incompressible flow (Anderson & Wendt Reference Anderson and Wendt1995), i.e.
 \begin{equation} \boldsymbol{\tau }(x,r,\theta )|_{r=0.5D}=\mu [\boldsymbol{\nabla \!}\overrightarrow {U}+(\boldsymbol{\nabla \!}\overrightarrow {U})^T], \end{equation}
where
 $\overrightarrow {U}$
is the velocity vector in the Cartesian coordinate system, expressed as
 $u\!\overrightarrow {X}+v\!\overrightarrow {Y}+w\!\overrightarrow {Z}$
. Here,
 $u$
,
 $v$
and
 $w$
represent the velocity components along the
 $X$
,
 $Y$
and
 $Z$
axes, respectively. The dot product between
 $\boldsymbol{\tau }(x,r,\theta )|_{r=0.5D}$
and
 $\overrightarrow {n}_{\!2}$
yields a three-dimensional vector. Therefore,
 $\overrightarrow {F}_{\!\textit{L2}}$
can be decomposed into three components, i.e.
 $F_{L2\_X}$
,
 $F_{L2\_Y}$
and
 $F_{L2\_Z}$
, in the Cartesian coordinate system shown in figure 1.
In general, the force component in the
 $X$
-axis direction generated by the starting jet is the sum of
 $F_\textit{L1}$
and
 $F_{L2\_X}$
, i.e.
 \begin{equation} F_{\textit{axial}}=F_\textit{L1}+F_{L2\_X}. \end{equation}
We note that
 $F_{\textit{axial}}$
acting on the control volume in the positive
 $X$
-axis direction is equivalent to the force acting on the nozzle in the negative
 $X$
-axis direction, which corresponds to the thrust required for forward motion. In addition, the force component perpendicular to the
 $X$
-axis acting on the nozzle is defined as the lateral force
 $\overrightarrow {F}_{\!\textit{lateral}}$
, i.e.
 \begin{equation} \overrightarrow {F}_{\!\textit{lateral}}=F_{L2\_Y}\overrightarrow {Y}+F_{L2\_Z}\overrightarrow {Z}. \end{equation}
For a single starting jet, the flow structure is axisymmetric (Krieg & Mohseni Reference Krieg and Mohseni2021; Zhu et al. Reference Zhu, Zhang, Gao and Yu2022), resulting in
 $F_{L2\_Y}$
and
 $F_{L2\_Z}$
being 0. Therefore,
 $\overrightarrow {F}_{\!\textit{lateral}}$
can be ignored. For the twin-starting jets, the flow structure of each starting jet is no longer axisymmetric but instead exhibits symmetry about the
 $X{-}Z$
plane, as verified in § 3.1. Therefore,
 $F_{L2\_Y}$
can be ignored, and (2.8) can be further rewritten as
 \begin{equation} \overrightarrow {F}_{\!\textit{lateral}}=F_{L2\_Z}\overrightarrow {Z}. \end{equation}
Two starting jets initiated under identical conditions are symmetric about the
 $X{-}Y$
plane, with the relative error between the forces generated by them being negligible (of the order of
 $10^{-5}$
). Therefore,
 $F_{\textit{axial}}$
presented in present work for the twin-starting jets is the sum of the axial forces generated by two starting jets. The
 $F_{L2\_Z}$
values acting on the outer walls of two nozzles are equal in magnitude but opposite in sign. This is confirmed by subsequent results. Therefore, the
 $F_{\textit{lateral}}$
values presented denote the averaged magnitude, with the sign determined by that on the nozzle outer wall of the first starting jet.
A non-uniform hexahedral structured grid scheme is used to discretise the computational domain, with the finest cells concentrated in the regions of the shear layer and boundary layer. Additionally, the region encompassing the jet wake is refined to better capture the flow phenomena of interest. Since the computational domain changes with
 $S/D$
, the grid independence and time convergence tests are conducted for each
 $S/D$
value ranging from 1.1 to 4, as well as for
 $S/D=\infty$
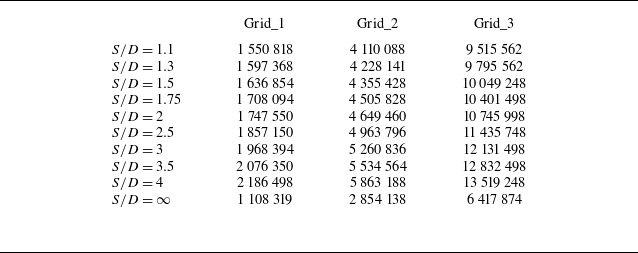
(the single starting jet). For the grid independence test, three grid schemes with varying refinement levels but identical topology are compared. The cell numbers for each
 $S/D$
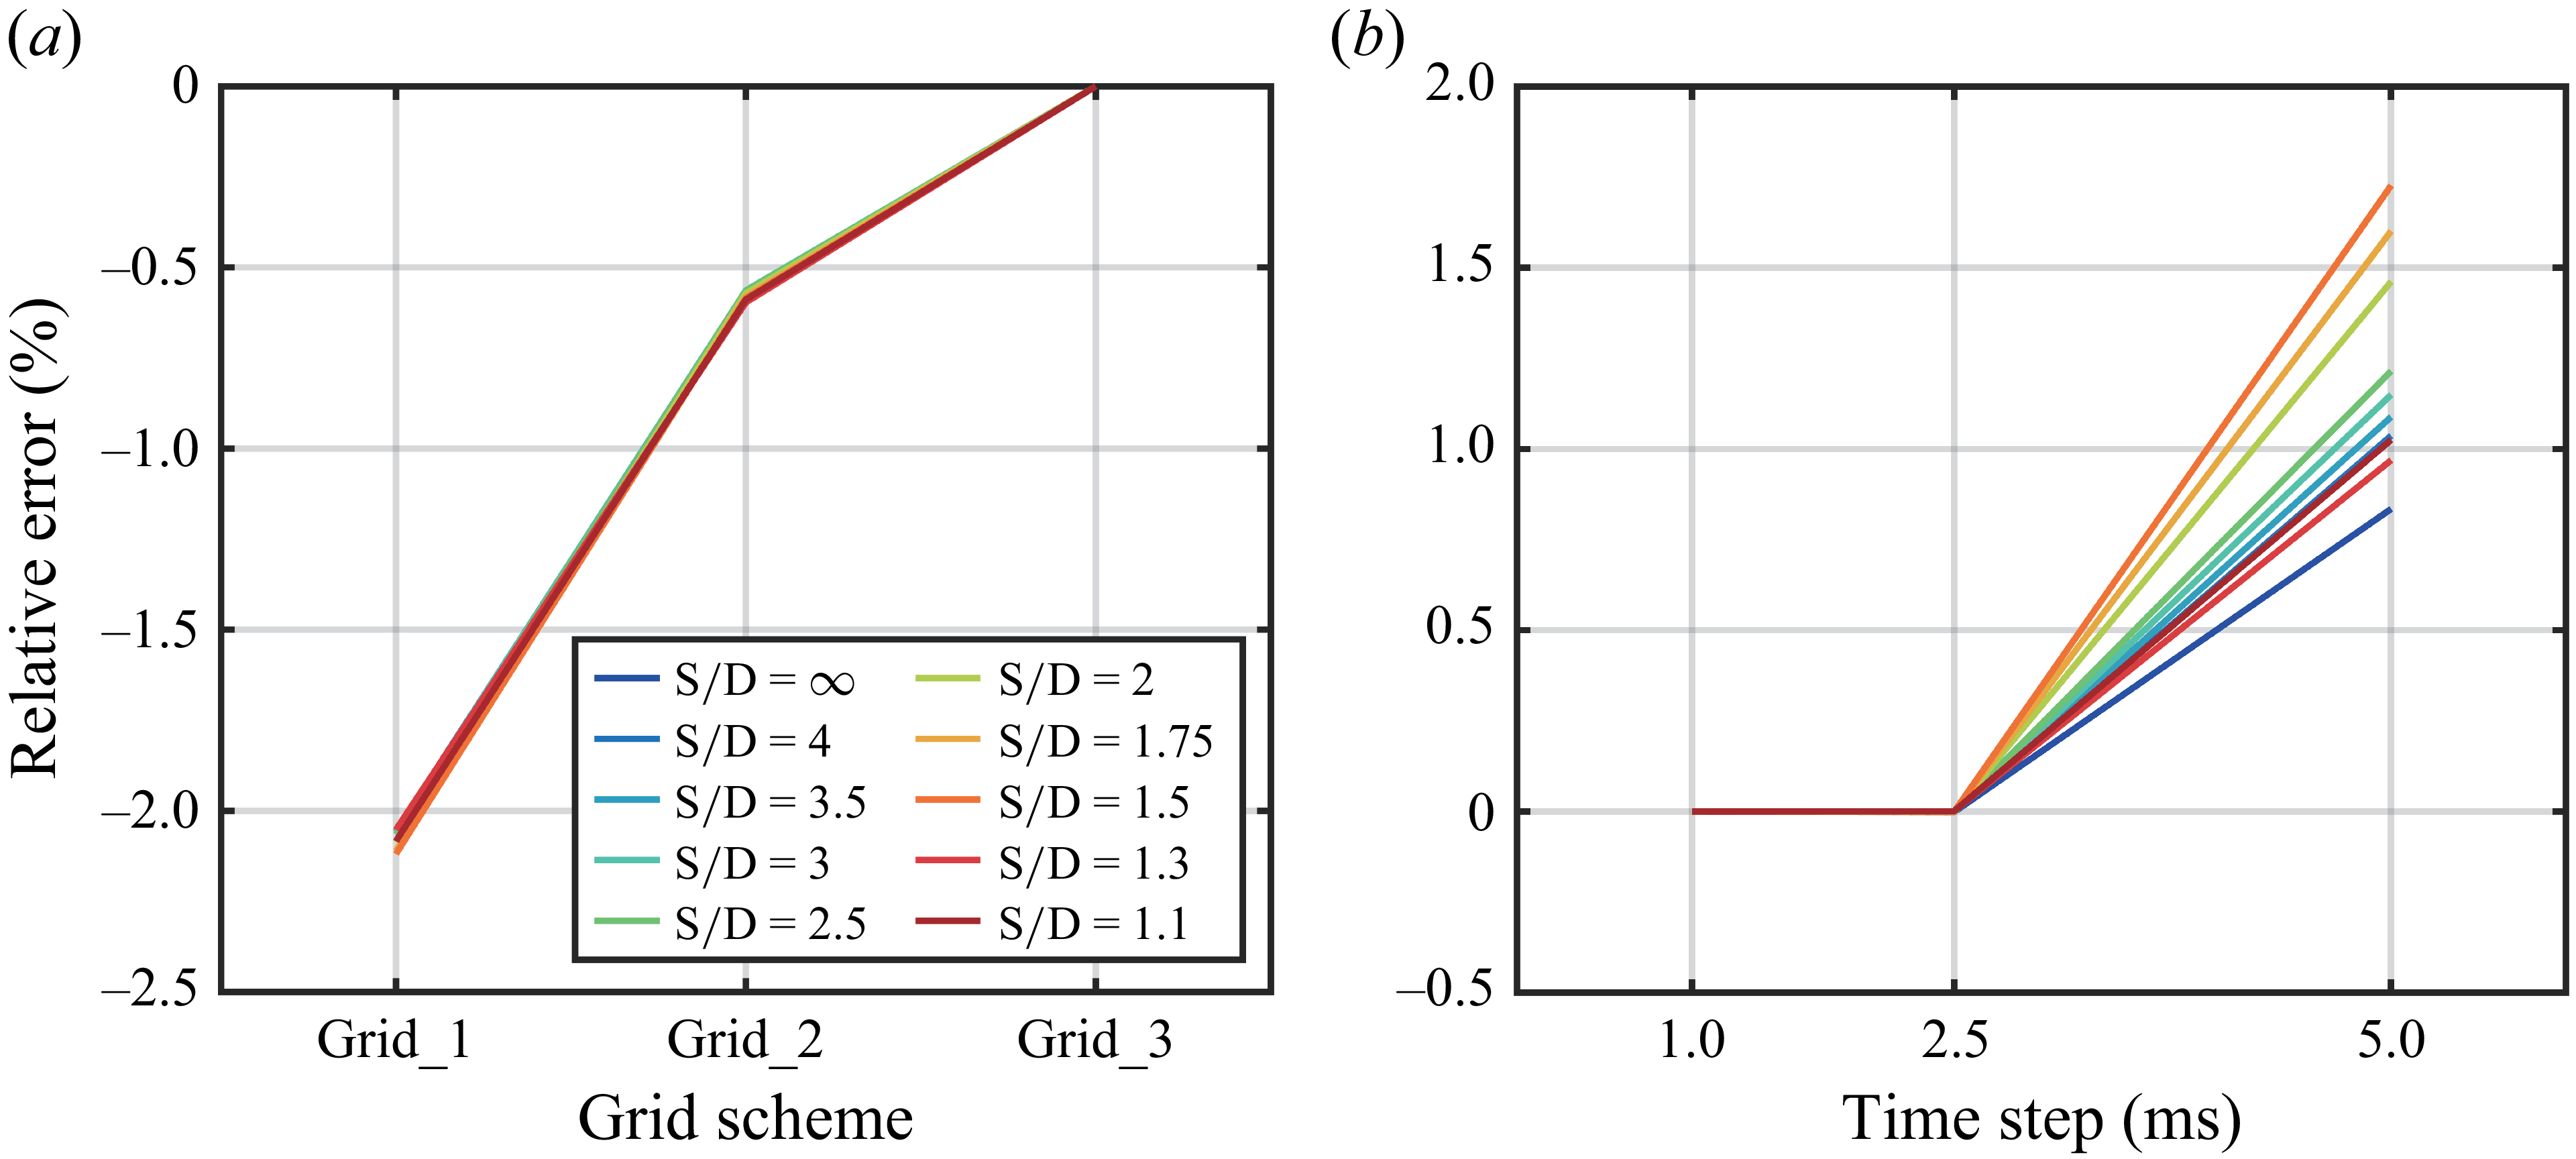
under the different grid schemes are summarised in table 2. For the time convergence test, three time steps, i.e. 5, 2.5 and 1 ms, are adopted. As in cases 1–10, the velocity program of FAFD with
 $L/D=2$
is applied to the velocity inlets. The time-averaged thrust over the duration of starting jet is calculated and compared in tests. The relative errors for the grid independence and temporal convergence tests are shown in figure 3. The relative errors between the two finest grid schemes and those between the two shortest time steps are both less than
 $1\,\%$
. Therefore, the Grid_2 scheme and a time step of 2.5 ms are sufficient for the present work. To more accurately capture the interactions between vortical structures, the finest Grid_3 scheme and the minimum time step of 1 ms are adopted ultimately.
Summary of cell numbers in grid schemes with varying refinement levels for each
 $S/D$
.

Summary of the results for (a) grid independence tests with a time step of 1 ms and (b) temporal convergence tests using the Grid_3 scheme. Relative errors are calculated using the results obtained from the Grid_3 scheme and a time step of 1 ms as the reference.

3. Results and discussion
3.1. Wake development
3.1.1. Three-dimensional vortical structures
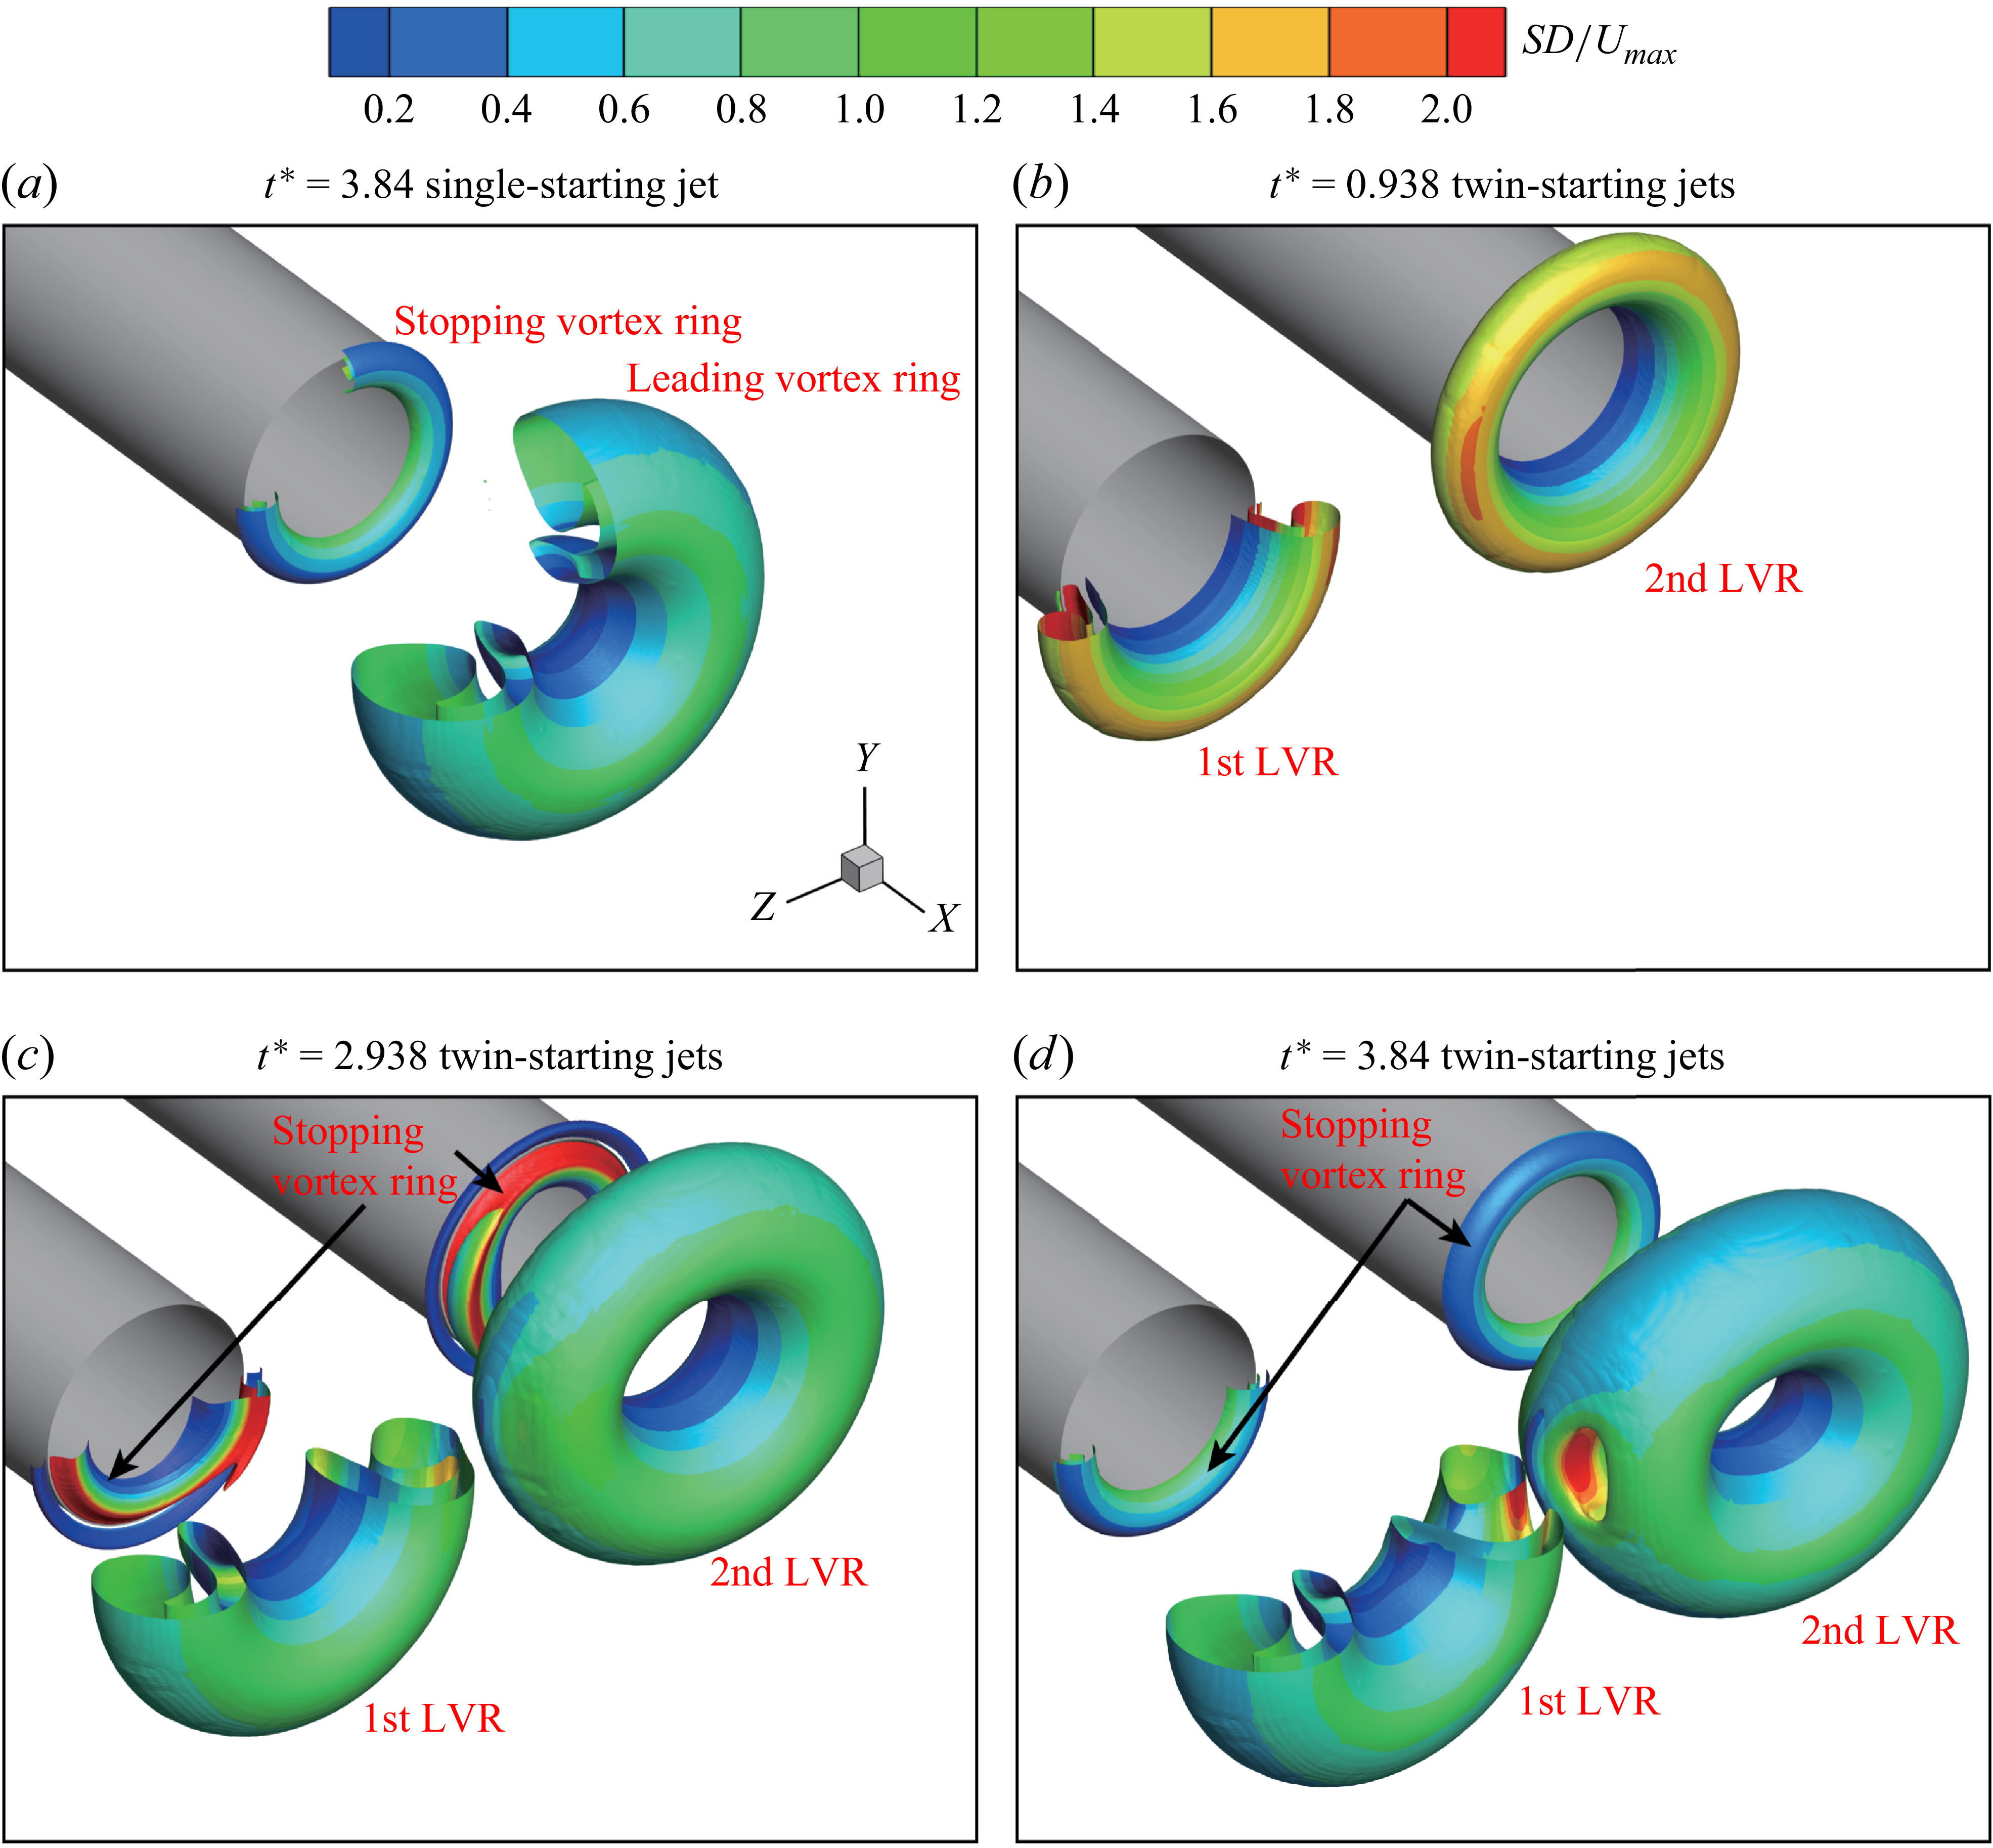
The interactions between twin-starting jets are clearly revealed by the three-dimensional vortical structures of the wake. The development of vortical structures for case 15 with
 $S/D=2$
and
 $L/D=3$
is shown in figure 4, accompanied by that for case 20 with
 $S/D=\infty$
and
 $L/D=3$
as a reference. The
 $Q$
-criterion is adopted to identify the vortical structures (Zhan & Hu Reference Zhan, Li, Wai and Hu2019; Zhu et al. Reference Zhu, Zhang, Yu, Zhao and Gao2024c), i.e.
 \begin{equation} Q=\dfrac {1}{2}(\left \| \boldsymbol{\varOmega } \right \|^2-\left \| \boldsymbol{S} \right \|^2). \end{equation}
Here,
 $\boldsymbol{\varOmega }$
and
 $\boldsymbol{S}$
are the antisymmetric part (vorticity tensor) and symmetric part (strain rate tensor) of the velocity gradient tensor
 $\boldsymbol{\nabla \!}\overrightarrow {U}$
, respectively. The iso-surface of the normalised
 $Q$
-criterion (scaled by its maximum value) is used to visualise the three-dimensional vortical structures, with coloured contours showing the strain rate magnitude
 $S$
. As
 $S$
increases, the deformation of the corresponding fluid region intensifies. For the single starting jet, the flow field is axisymmetric, which is reflected in the three-dimensional vortical structures and the strain rate contours (figure 4
a).
Three-dimensional vortical structures identified by the normalised
 $Q$
-criterion (iso-surface at
 $Q=0$
) with coloured contours representing the strain rate magnitude
 $S$
for (a) the single starting jet (case 20,
 $S/D=\infty$
and
 $L/D=3$
) and (b)–(d) the twin-starting jets (case 15,
 $S/D=2$
and
 $L/D=3$
). The quadrant with
 $Z\gt 0$
and
 $Y\gt 0$
is removed for illustration.

During the initiation stage of twin-starting jets, shear layers roll up at both nozzle exit edges to form two leading vortex rings (Didden Reference Didden1979), denoted as the 1st LVR and 2nd LVR (figure 4b). Both the 1st LVR and 2nd LVR translate in the positive
 $X$
-axis direction under their self-induced velocity (Zhu et al. Reference Zhu, Zhang, Gao and Yu2022) and continue to grow as they absorb fluid and vorticity from the jets, as shown in figure 4(c). The contours of
 $S$
on the iso-surface of the
 $Q$
-criterion show that the vortical structures are not axisymmetric about their respective jet axes from the onset. At
 $t^*=0.938$
, the region, where the 1st LVR and 2nd LVR are close to each other, displays higher values of
 $S$
(figure 4b). As the wake develops to
 $t^*=2.938$
(figure 4c), this portion of the two vortex rings undergoes significant deformation. In addition, near the nozzle exits, where stopping vortex rings are about to form due to the deceleration of starting jets (Zhu et al. Reference Zhu, Zhang, Yu, Gao and Zhao2024b), the contours of
 $S$
on the iso-surface of
 $Q$
-criterion clearly deviate from axisymmetry about their respective jet axes. This may be associated with the upstream-propagating influences resulting from the interaction between the 1st LVR and 2nd LVR. As the wake further develops to
 $t^*=3.84$
, a cavity with high values of
 $S$
emerges in the region where the 1st LVR and 2nd LVR are close to each other (figure 4d). From the half-view with
 $Z\gt 0$
, it is evident that this cavity forms as the vortical structures of the 1st LVR and 2nd LVR partially move upstream under their mutual interaction.
As the two starting jets are placed closer to each other, i.e. decreasing
 $S/D$
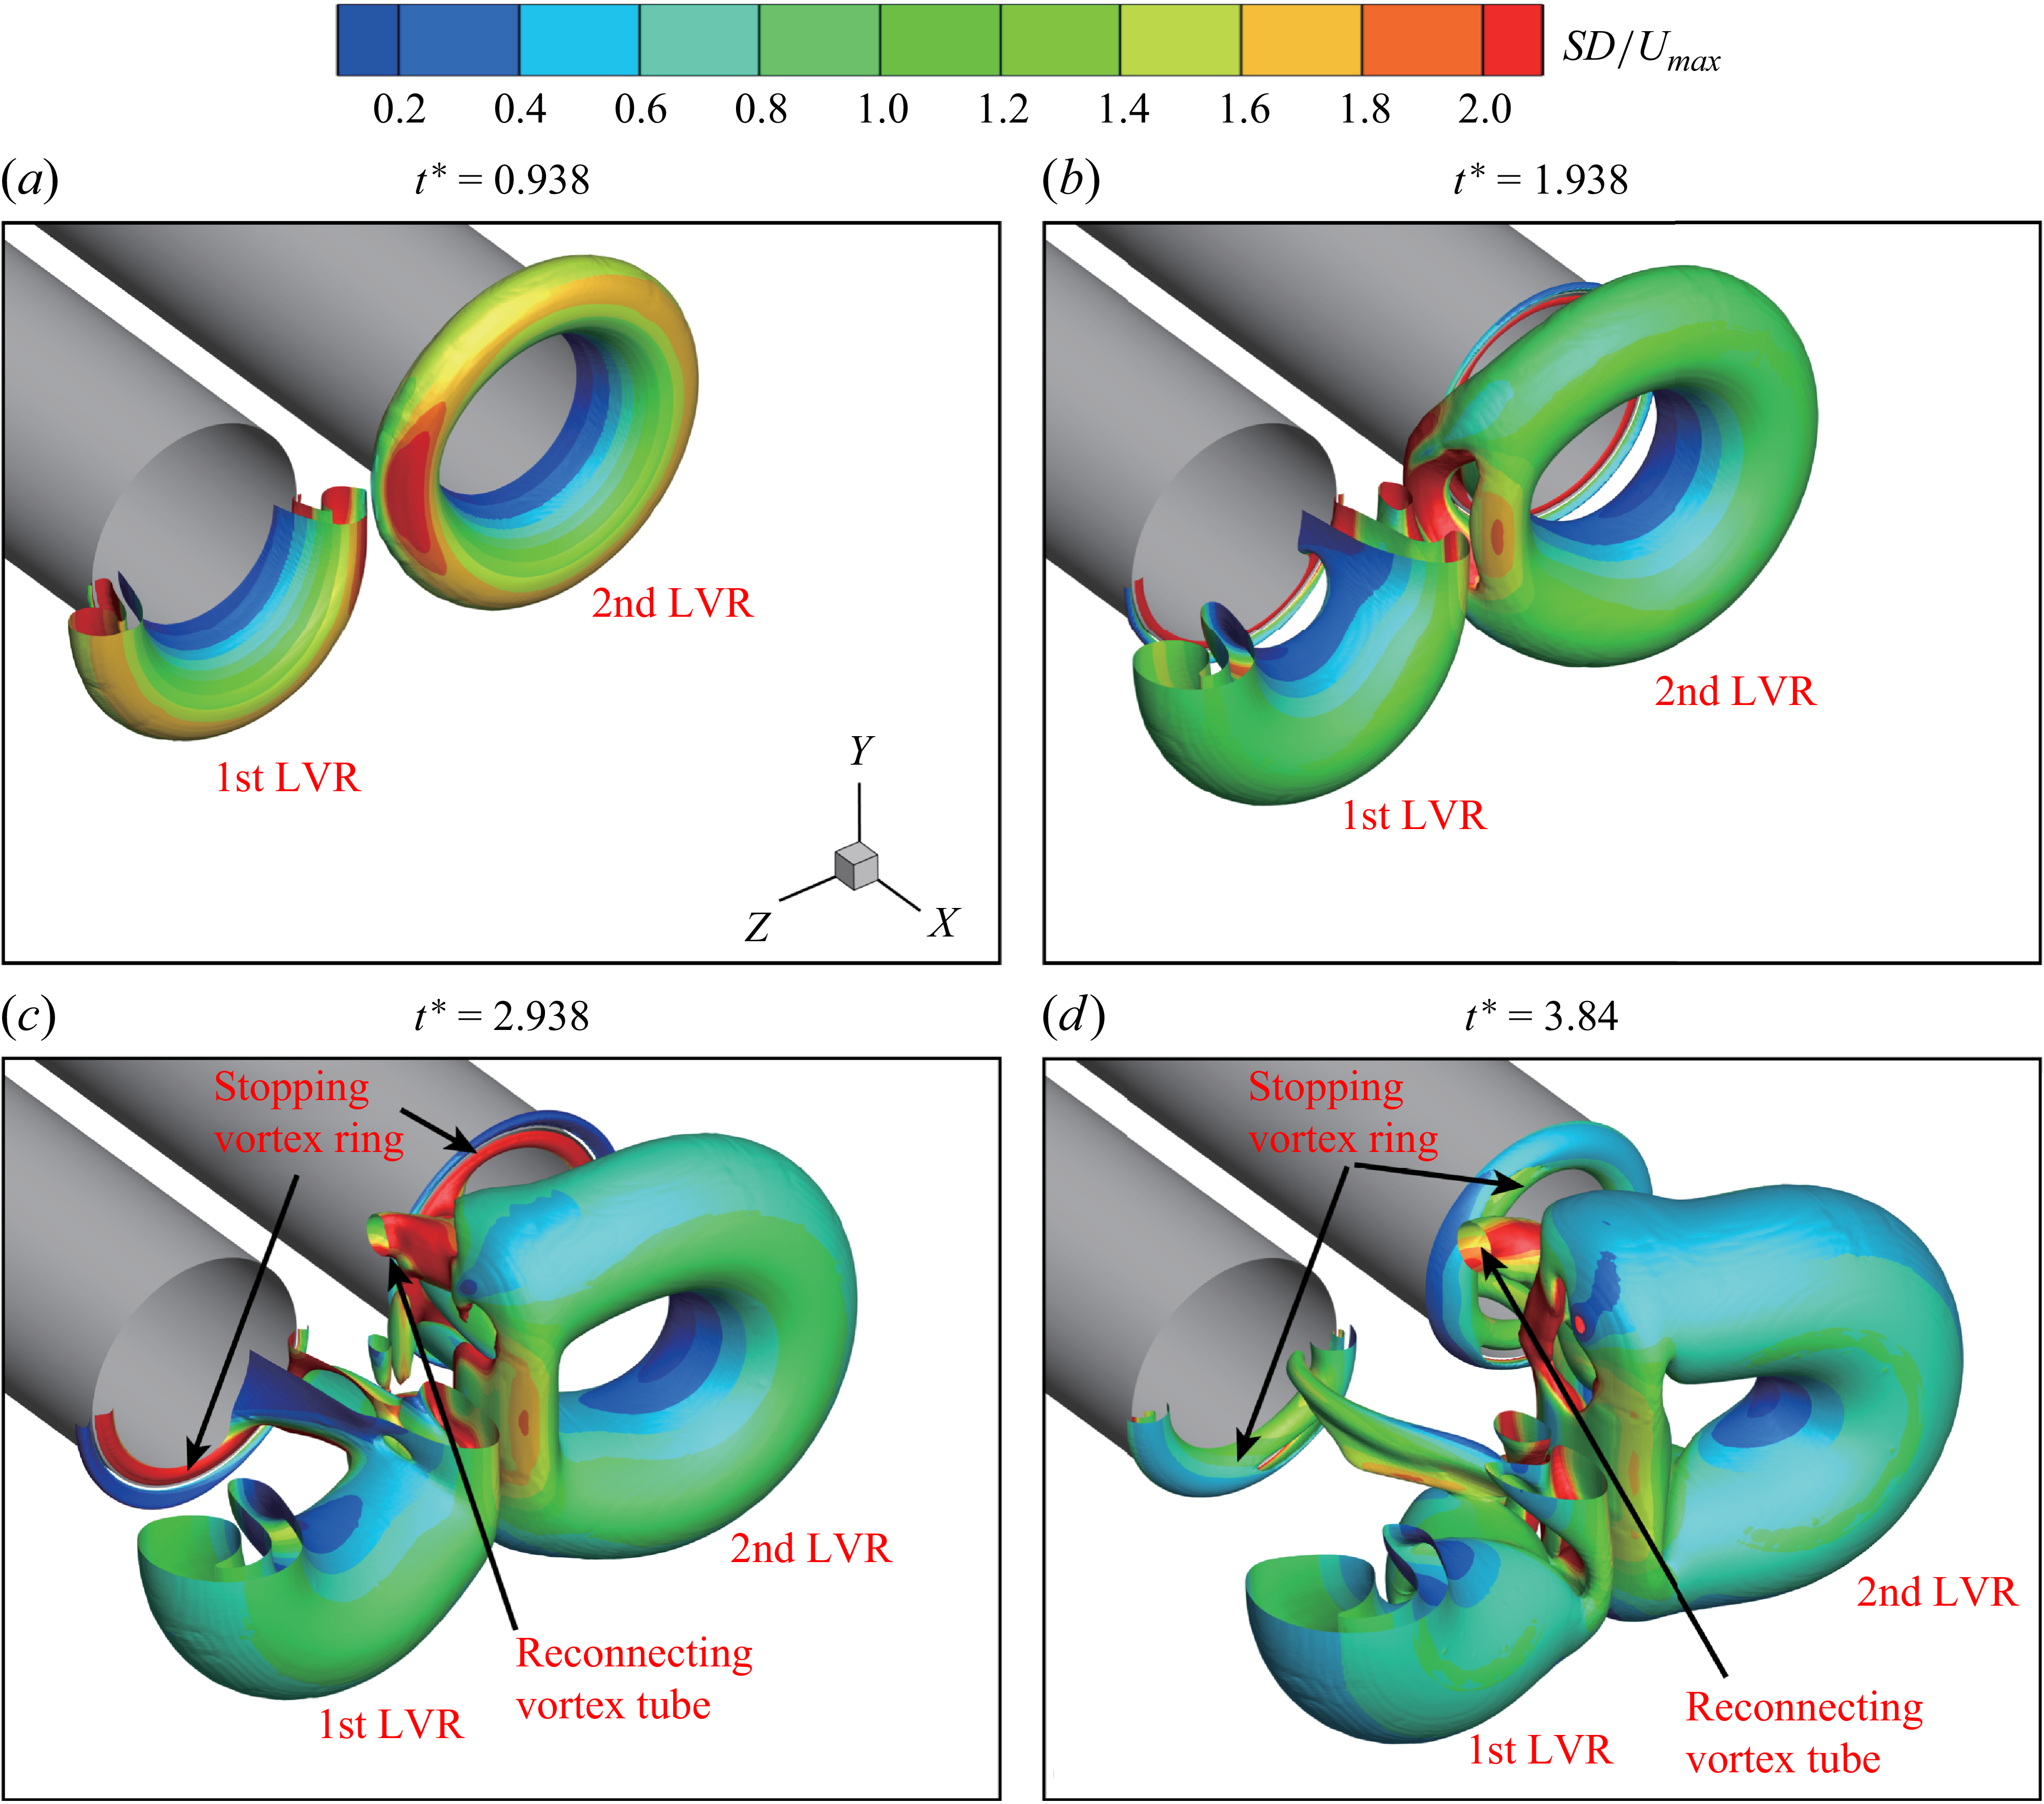
, the interaction between the 1st LVR and 2nd LVR intensifies, as expected. The development of vortical structures for case 13 with
 $S/D=1.5$
and
 $L/D=3$
is shown in figure 5. At
 $t^*=0.938$
, the contours of
 $S$
on the iso-surface of
 $Q$
-criterion show higher magnitudes within the interaction region (figure 5
a). Three-dimensional vortical structures of the 1st LVR and 2nd LVR are notably deformed and start to deviate from being axisymmetric about their respective jet axes. The cavity with high values of
 $S$
has already appeared in the region where the 1st LVR and 2nd LVR are close to each other at
 $t^*=1.938$
(figure 5
b). Compared with case 15 with
 $S/D=2$
, where the cavity appears after
 $t^*=2.938$
, the cavity forms significantly earlier in case 13 with
 $S/D=1.5$
. From the half-view with
 $Z\gt 0$
, it is evident that the vortical structures moving upstream are weaker than those observed in case 15 (recall figure 4
d). This can be attributed to the interaction disrupting the formation of 1st LVR and 2nd LVR at smaller S/D earlier, before they are fully developed. As the vortical structures continue to interact, two vortex tubes appear to connect the 1st LVR and 2nd LVR, as shown in figure 5(c). This indicates the reconnection between two vortex rings, which is consistent with the experimental observations of Chevalier (Reference Chevalier2023). The reconnection partially impedes the downstream translation of the 1st LVR and 2nd LVR, resulting in the complex three-dimensional vortical structures in the region where the twin-starting jets are in close proximity (figure 5
d).
Three-dimensional vortical structures identified by the normalised
 $Q$
-criterion (iso-surface at
 $Q=0$
) with coloured contours representing the strain rate magnitude
 $S$
for case 13 (
 $S/D=1.5$
and
 $L/D=3$
).

As
 $S/D$
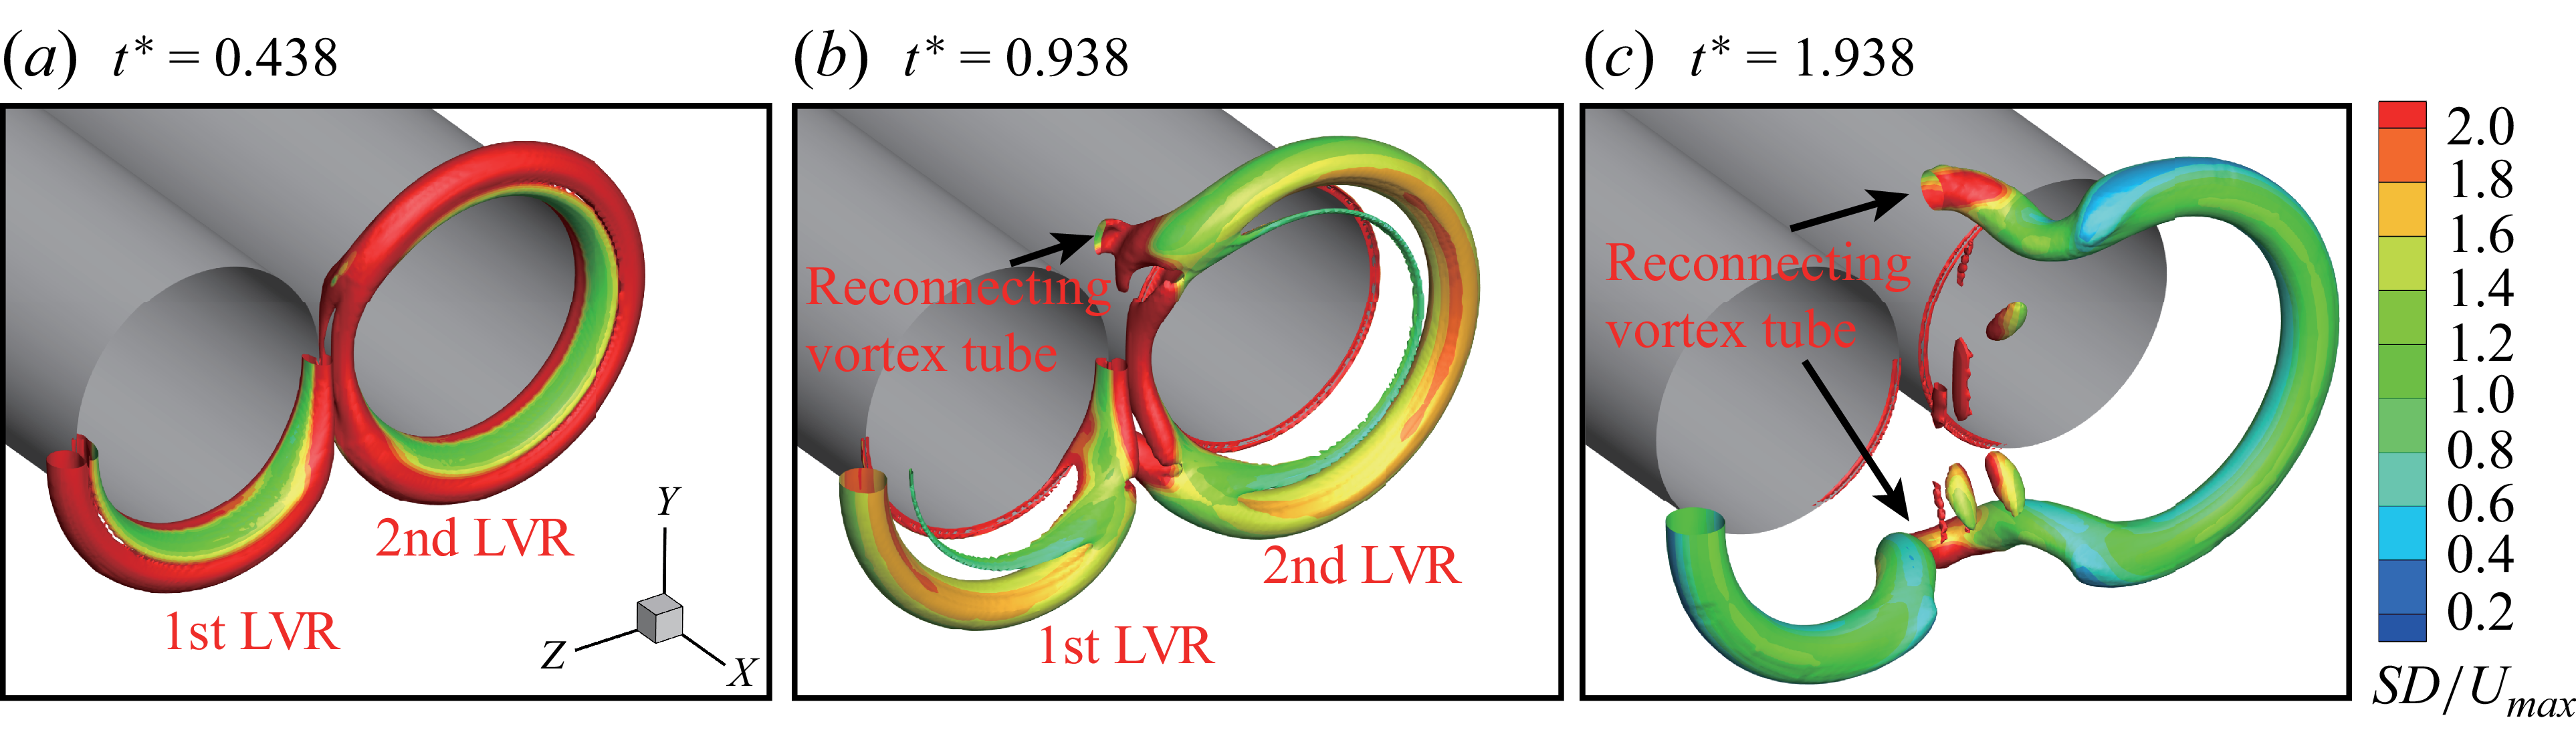
decreases further from 1.5, the reconnection between the two vortex rings occurs earlier. For the two nozzles in a nearly touching configuration at
 $S/D=1.1$
, the formation of two complete vortex rings cannot be observed, as shown in figure 6. Iso-surfaces of a higher normalised
 $Q$
-criterion (
 $Q=0.02$
) are employed to clearly reveal the reconnection of vortex rings without disturbance from the shear layers. Under this highly confined configuration, the shear layers of two starting jets in the regions where they approach each other are unable to roll up radially to form vortical structures (figure 6
a). In this region, strong cancellation of opposite-signed vorticity takes place (Zhu et al. Reference Zhu, Zhang, Gao and Yu2022). By
 $t^*=0.938$
, a pair of reconnecting vortex tubes has already formed, connecting the 1st LVR and 2nd LVR, as shown in figure 6(b). This reconnection occurs earlier than in case 13 (
 $S/D=1.5$
), where similar structures appear only after
 $t^*=1.938$
. In addition, there are still vortical structures formed by the jet shear layer between the two reconnecting vortex tubes. They are arranged approximately parallel to each other and nearly perpendicular to the reconnecting vortex tubes. As the flow develops, these vortical structures gradually dissipate (figure 6
c). Meanwhile, the two reconnecting vortex tubes transform into hairpin-like structures, whose legs are attached to the 1st LVR and 2nd LVR.
Three-dimensional vortical structures identified by the normalised
 $Q$
-criterion (iso-surface at
 $Q=0.02$
) with coloured contours representing the strain rate magnitude
 $S$
for case 11 (
 $S/D=1.1$
and
 $L/D=3$
).

The wake vortical structures of the twin-starting jets lose axisymmetry with respect to their respective jet axes but maintain symmetry about the plane containing both axes, i.e. the
 $X{-}Z$
plane in the Cartesian coordinate system shown in figure 1. In addition, the wakes of two jets are also symmetric about the
 $X{-}Y$
plane. These observations are based on the iso-surfaces of the
 $Q$
-criterion coloured by the contours of
 $S$
in figures 4 to 6. Analysis of vorticity magnitude profiles further confirms the planar symmetry characteristics. In Cartesian coordinates, the vorticity vector can be expressed as
 \begin{equation} \overrightarrow {\omega }= \left(\dfrac {\partial w}{\partial\! Y}-\dfrac {\partial v}{\partial\! Z}\right)\overrightarrow {X}+ \left(\dfrac {\partial u}{\partial\! Z}-\dfrac {\partial w}{\partial\! X}\right)\overrightarrow {Y}+ \left(\dfrac {\partial v}{\partial\! X}-\dfrac {\partial u}{\partial\! Y}\right)\overrightarrow {Z}. \end{equation}
The profiles of vorticity magnitude
 $\omega$
along lines parallel to
 $Y$
-axis or
 $Z$
-axis in the plane parallel to the
 $Y{-}Z$
plane at
 $X/D=1$
are shown in figure 7 for case 13 at
 $t^*=2.938$
. For the first starting jet at
 $Z\gt 0$
(figure 7
a), the profiles of
 $\omega$
at different
 $Z/D$
are symmetric about
 $Y/D=0$
. This indicates that the wake vortical structures of the first starting jet remain symmetric with respect to the
 $X{-}Z$
plane. Similarly, the profiles of
 $\omega$
at different
 $Y/D$
, covering the wakes of the two starting jets, are symmetric about
 $Z/D=0$
, as shown in figure 7(b). This confirms that the wakes of the first and second starting jets remain symmetric about the
 $X{-}Y$
plane. Furthermore, the interaction between the 1st LVR and 2nd LVR results in them deviating from the ideal annular geometry. The profiles of
 $\omega$
exhibit different variations for the same distance deviated from
 $Z/D=0.75$
(through the jet axis) to
 $Z/D=1.25$
and
 $Z/D=0.25$
(figure 7
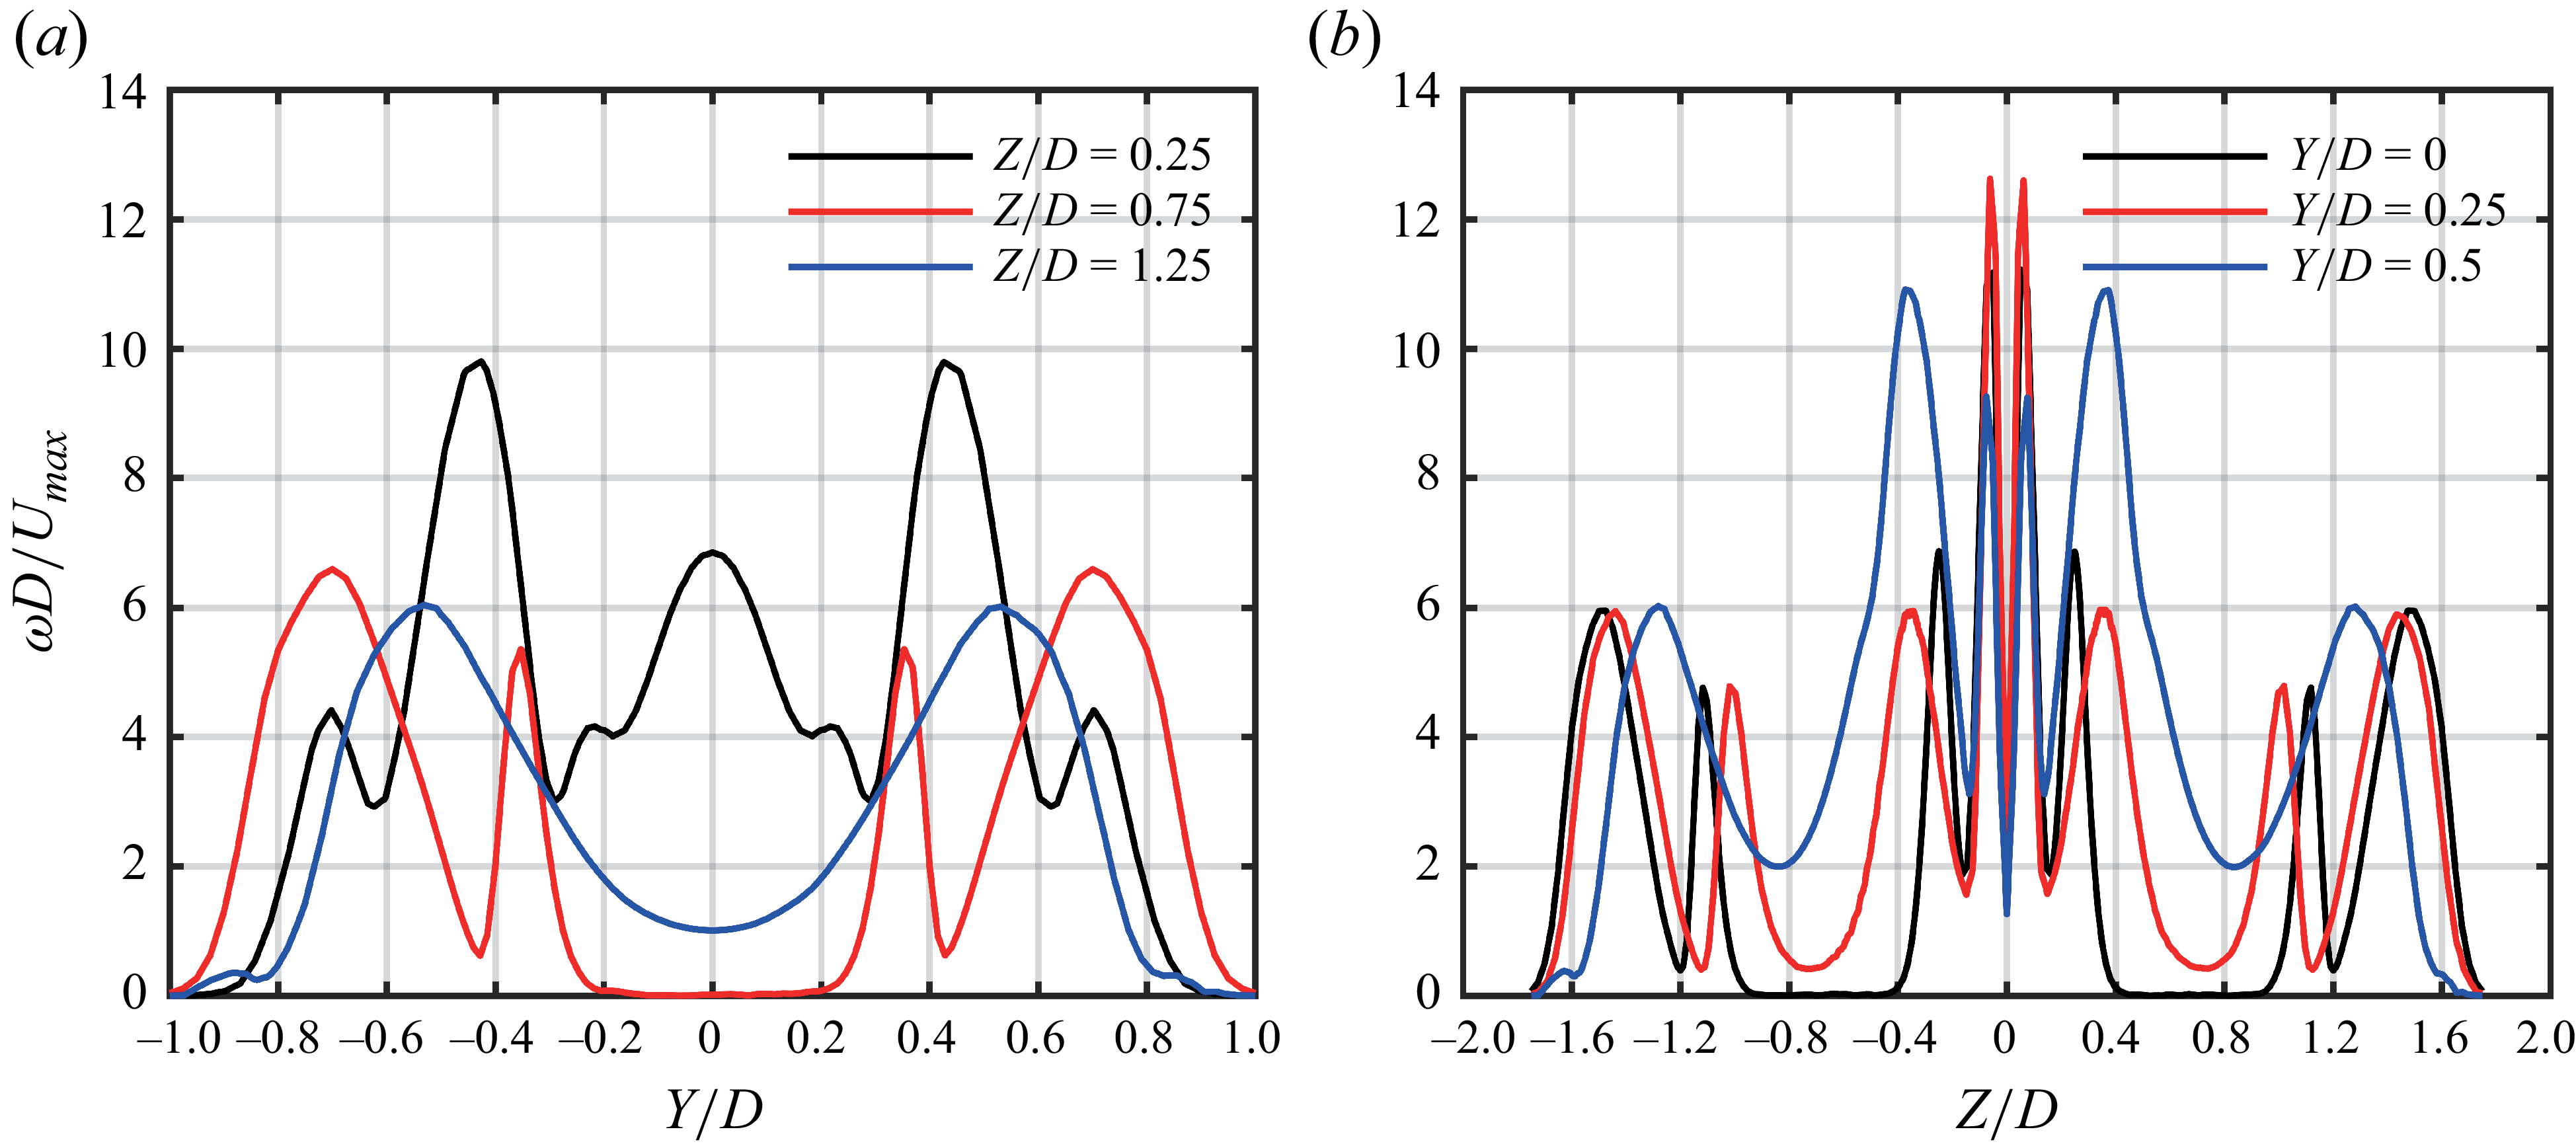
a). At
 $Z/D=0.75$
, the profile shows two main peaks corresponding to the vortex cores of the 1st LVR, along with two narrower peaks near the centre associated with the trailing shear layer (Gao & Yu Reference Gao and Yu2012). As the profile shifts to
 $Z/D=1.25$
, the magnitudes of the two main peaks decrease, and their positions move closer to
 $Y/D=0$
. This is consistent with the annular geometry of the vortex ring. However, for the profile at
 $Z/D=0.25$
, the two main peaks become sharper and more pronounced, while an abnormally broad peak emerges between them.
Profiles of vorticity magnitude
 $\omega$
along the lines parallel to (a) the
 $Y$
-axis and (b) the
 $Z$
-axis in the plane of
 $X/D=1$
for case 13 (
 $S/D=1.5$
and
 $L/D=3$
) at
 $t^*=2.938$
.

3.1.2. Influence on the leading vortex ring characteristics
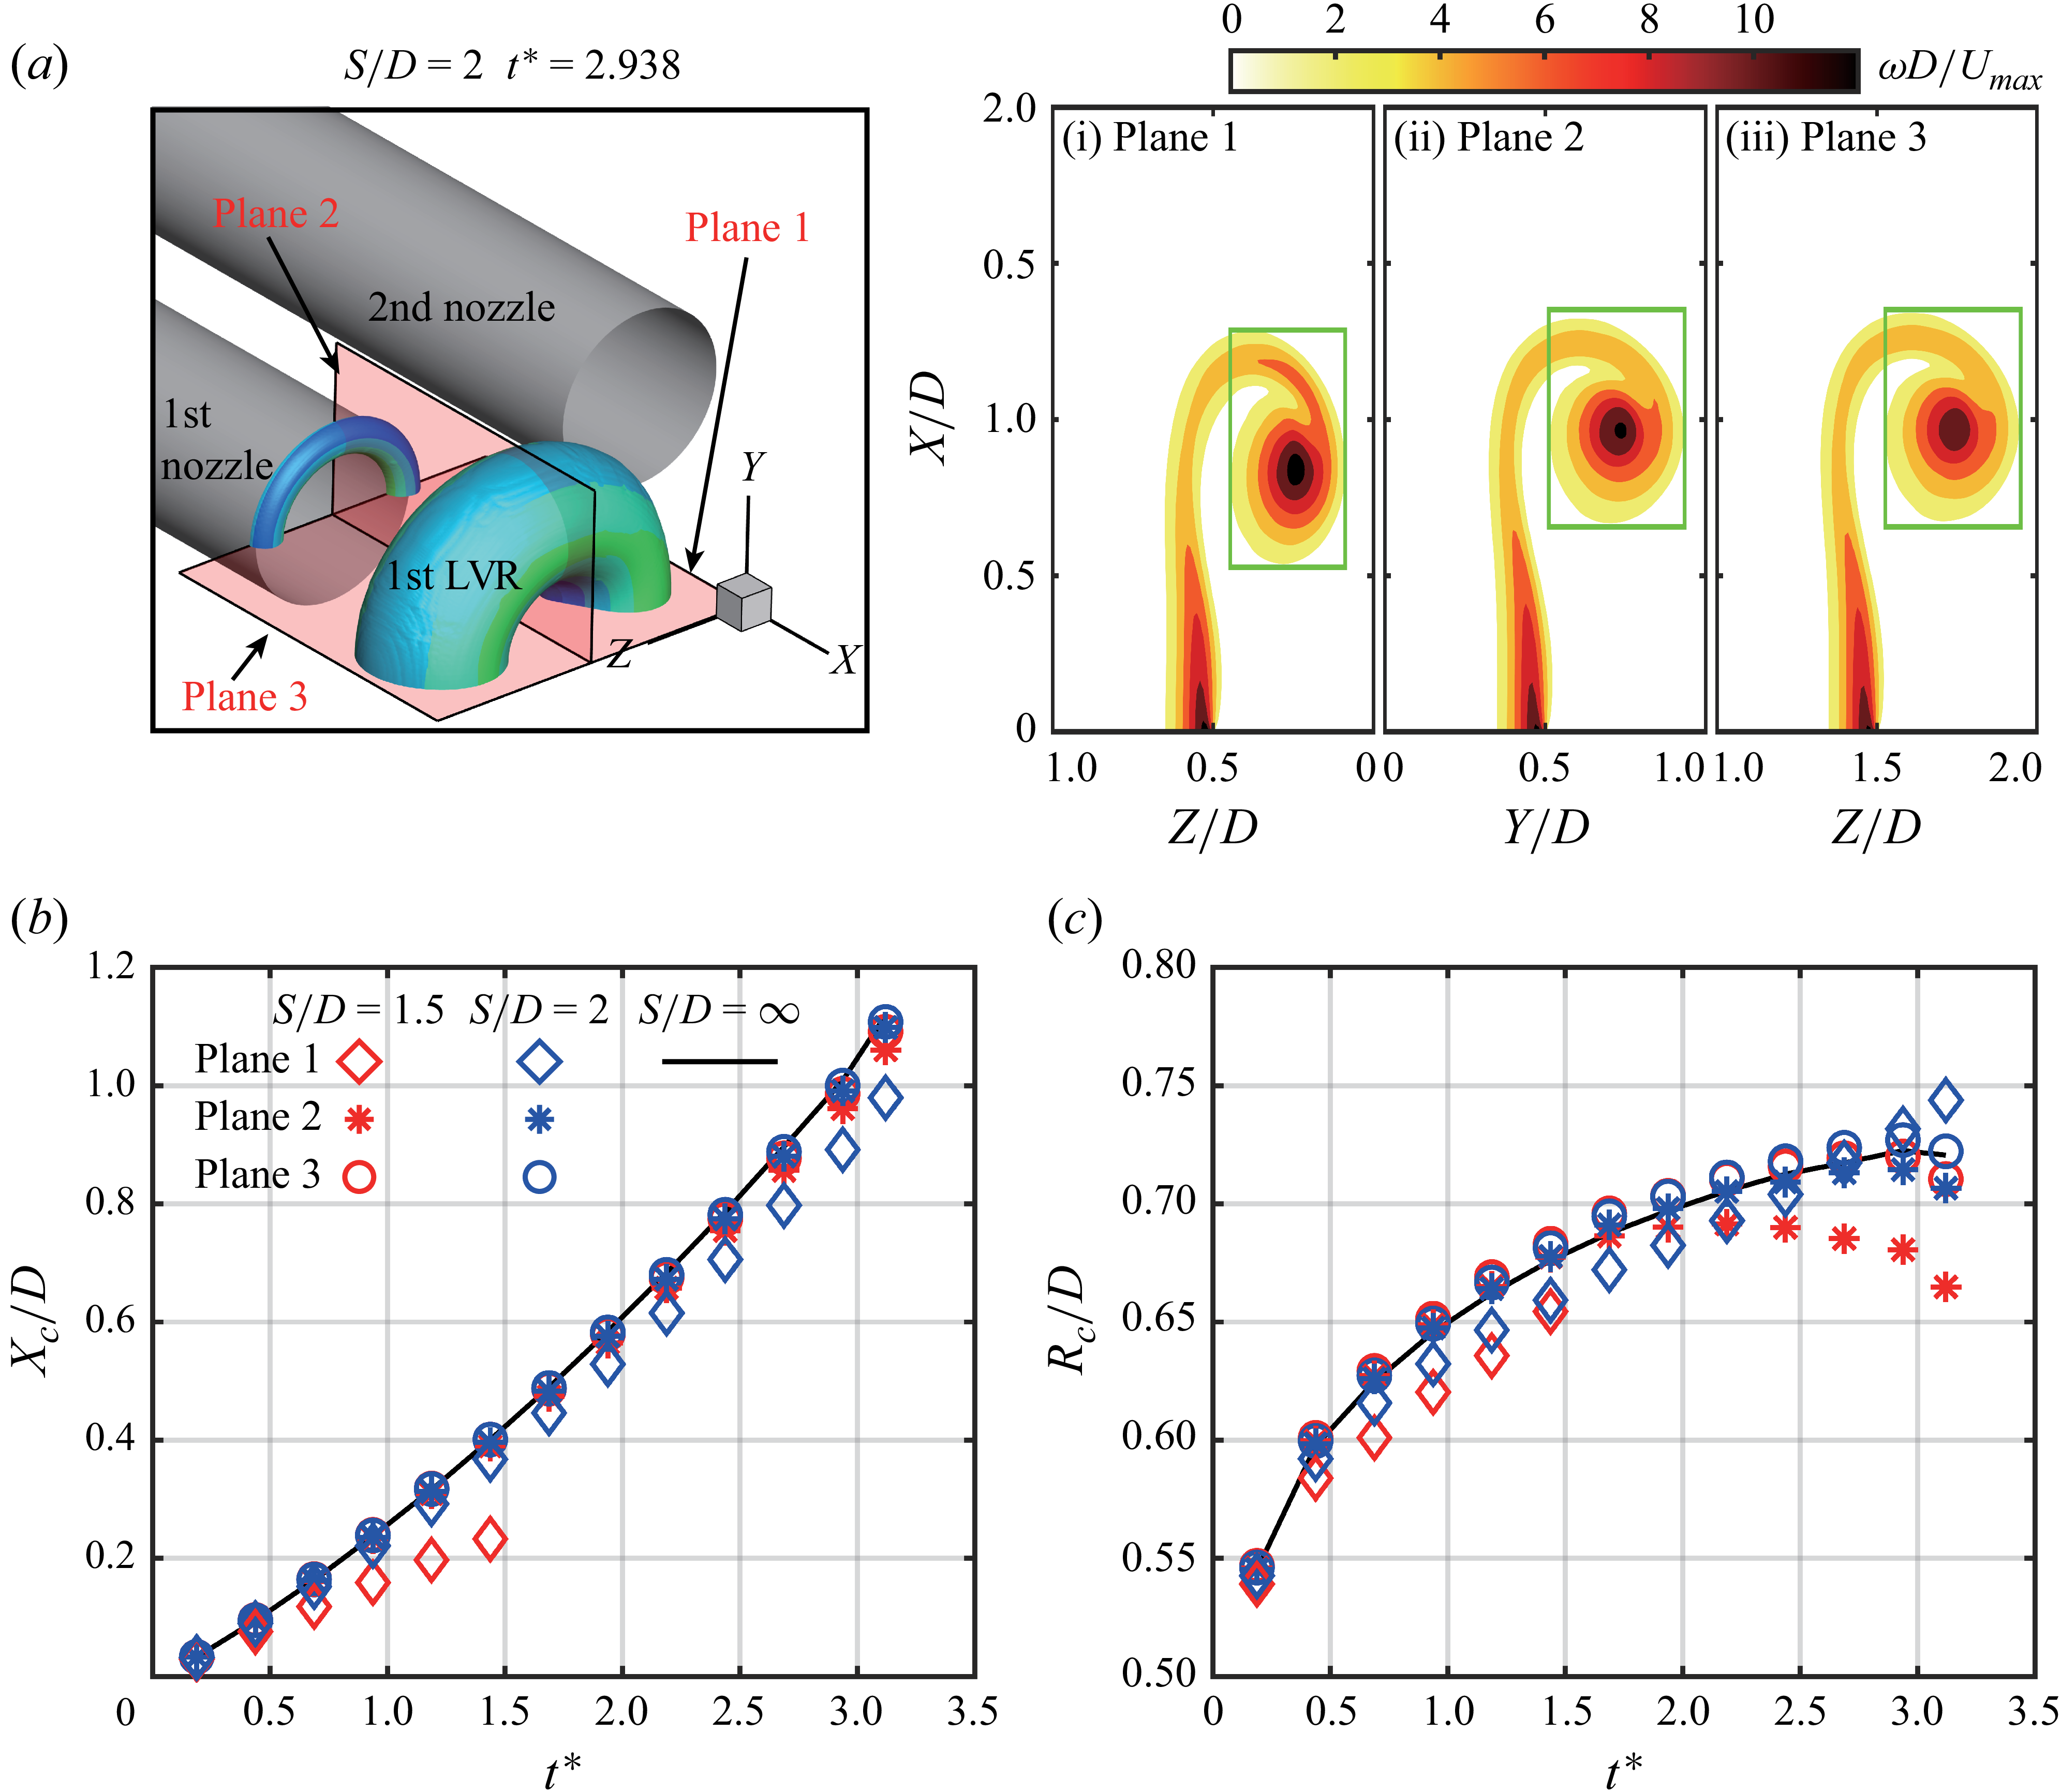
For the leading vortex ring generated by a single starting jet, the vortex core characteristics remain consistent across planes at different azimuthal angles around the jet axis (Krieg & Mohseni Reference Krieg and Mohseni2021; Limbourg & Nedić Reference Limbourg and Nedić2021). However, this azimuthal uniformity does not hold for the twin-starting jets. Based on the planar symmetry of the wake vortical structures in twin-starting jets, three planes are selected by rotating around the axis of the first starting jet, i.e. plane 1, plane 2 and plane 3, as shown in figure 8(a). The corresponding contours of vorticity magnitude
 $\omega$
on these planes are shown from figure 8(ai) to 8(aiii) for case 15 at
 $t^*=2.938$
. The interaction causes variations in the vorticity distribution across these three planes. In addition, the significant variation is observed between plane 1 and plane 2, while the difference between plane 2 and plane 3 is negligible. This suggests that the interaction primarily affects the adjacent portions of the 1st LVR and 2nd LVR. This conclusion remains valid when the 1st LVR and 2nd LVR undergo reconnection, particularly during the initial formation stage.
(a) Contours of vorticity magnitude
 $\omega$
in case 15 (
 $S/D=2$
and
 $L/D=3$
) at
 $t^*=2.938$
on different planes around the axis of the first starting jet, (b) vortex core axial position
 $X_c$
and (c) radial distance
 $R_c$
from the vortex core to the jet axis for case 13 (
 $S/D=1.5$
), case 15 and case 20 (
 $S/D=\infty$
) with
 $L/D=3$
.

The position of vortex core also varies across different azimuthal planes. Following the method of James & Madnia (Reference James and Madnia1996) and Zhu et al. (Reference Zhu, Zhang, Gao and Yu2022,Reference Zhu, Zhang, Yu, Zhao and Gao2024c), the vortex core position on the
 $X{-}Z$
plane can be calculated by
 \begin{align} X_c=\frac {\iint _A X\omega\, {\rm d}A}{\iint _A \omega\, {\rm d}A}, \end{align}
 \begin{align} Z_c=\frac {\iint _A Z\omega\, {\rm d}A}{\iint _A \omega\, {\rm d}A}. \end{align}
The above equations are directly applied to plane 1 and plane 3 located on the
 $X{-}Z$
plane. For plane 2, located on the
 $X{-}Y$
plane, the calculation of
 $Y_c$
in (
 $X_c, Y_c$
) is performed by replacing
 $Z$
on the right-hand side of (3.4) with
 $Y$
. The integration region is determined by selecting a rectangular area at each instant, which fully encompasses the vortex core while excluding the trailing shear layer (Zhu et al. Reference Zhu, Zhang, Yu, Zhao and Gao2024c), as shown by the green rectangles from figure 8(ai) to 8(aiii). To unify the expression of
 $(X_c,Z_c)$
on plane 1 and plane 3 and
 $(X_c,Y_c)$
on plane 2,
 $X_c$
is directly adopted as the axial distance from the vortex core to the nozzle exit (
 $X/D=0$
), while
 $Y_c$
and
 $Z_c$
are converted to the radial distance
 $R_c$
from the vortex core to the jet axis
 $(Y/D=0, Z=0.5S)$
. For an axisymmetric vortex ring, twice of
 $R_c$
can be taken as the vortex ring diameter (Didden Reference Didden1979; Das, Bansal & Manghnani Reference Das, Bansal and Manghnani2017).
The developments of
 $X_c$
and
 $R_c$
on the three planes are shown in figure 8(b) and 8(c), respectively. The results corresponding to plane 1 in case 13 with
 $S/D=1.5$
are unavailable after
 $t^*=1.438$
due to the reconnection. For comparison, the results from case 20 with
 $S/D=\infty$
, i.e. the single starting jet, are included, showing good consistency across all three planes. Comparing with the results in case 20, it can be observed that the interaction between two leading vortex rings reduces
 $X_c$
, i.e. slows down the downstream translation of vortex rings. This effect becomes more obvious as
 $S/D$
decreases. However, the interaction affects
 $X_c$
differently across the three planes, gradually weakening from plane 1 to plane 3, with the results on plane 3 nearly coinciding with those of the non-interacting case at
 $S/D=\infty$
. Similarly, for plane 1,
 $R_c$
in the cases with
 $S/D=1.5$
and
 $S/D=2$
is smaller than that with
 $S/D=\infty$
during the initial stage. This can be attributed to the geometric constraints induced by the twin-starting jets, i.e. the zero flow flux at the symmetry plane (
 $X{-}Y$
plane) (Athanassiadis & Hart Reference Athanassiadis and Hart2016). At a later stage,
 $R_c$
for
 $S/D=2$
exceeds that for
 $S/D=\infty$
on plane 1. This may result from the interaction modifying the vorticity distribution within the vortex core, which is also a key factor governing the vortex core position (3.4). For plane 2,
 $R_c$
in the cases with
 $S/D=1.5$
and
 $S/D=2$
initially coincides with that for
 $S/D=\infty$
, but becomes smaller at a later stage. This transition occurs earlier and is more pronounced as
 $S/D$
decreases. The development of
 $R_c$
on plane 3 follows a similar trend to that on plane 2, except that the results for
 $S/D=1.5$
and
 $S/D=2$
are slightly larger than those for
 $S/D=\infty$
. Overall, the influence of interaction on vortex core position exhibits a distinct azimuthal dependence, being strongest on plane 1 and gradually diminishing toward plane 3. This is consistent with the conclusion from vorticity distribution shown earlier in figure 8(a).
The flow development of the single and twin-starting jets is directly compared on the
 $X{-}Z$
plane, which includes both plane 1 and plane 3 as defined in figure 8(a). Figure 9 presents the contours of
 $Y$
-component vorticity
 $\omega _Y$
along with streamlines originating from
 $X/D=-0.2$
;
 $\omega _Y$
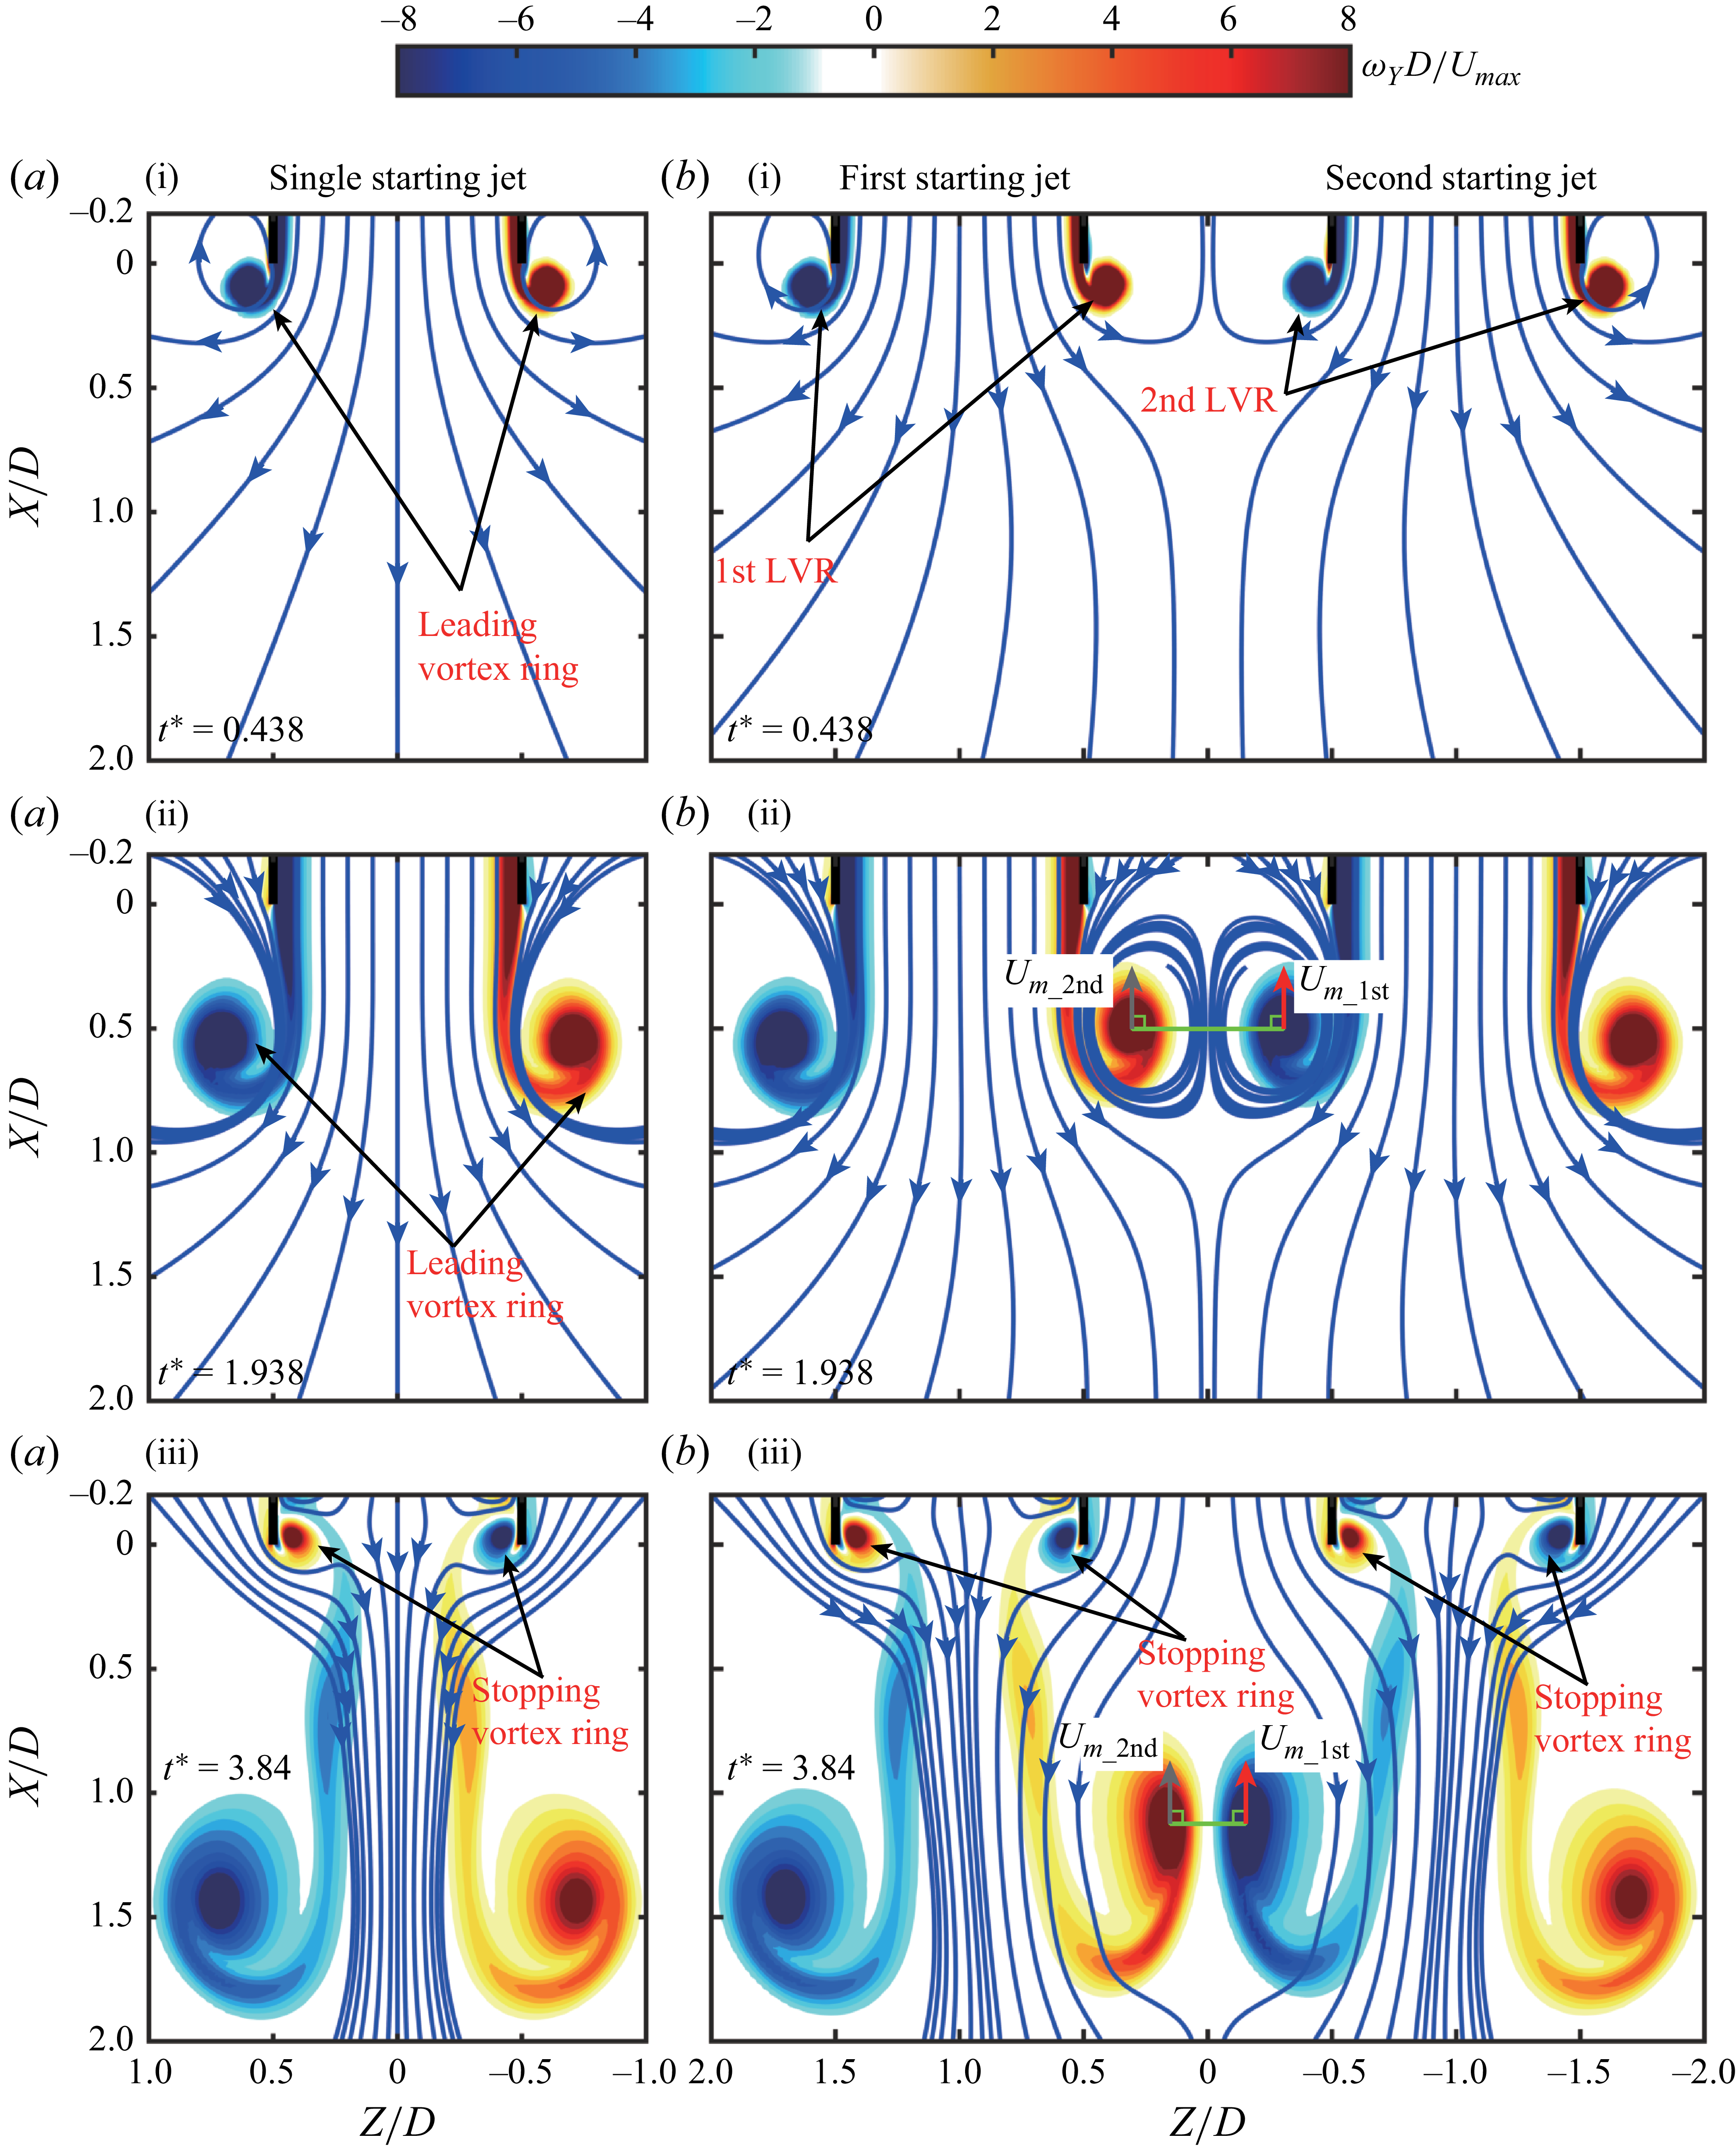
is the second term on the right-hand side of (3.2). In addition, the visualisations of the fluid released from the nozzles, obtained using the fluid tracer method (Yang, Jia & Yin Reference Yang, Jia and Yin2012; Zhu et al. Reference Zhu, Zhang, Yu, Gao and Zhao2024b), are shown as Movie 1 to Movie 10 in the supplementary materials for cases 11–20. For the single starting jet, the vorticity contours and streamlines in the wake exhibit complete symmetry about the jet axis (figure 9
a). The leading vortex ring is generated by the roll-up of jet shear layer at the nozzle exit edge (Didden Reference Didden1979), and then translates downstream under its self-induced velocity (figure 9
ai to 9
aii). The vorticity region corresponding to trailing shear layer is then observed behind it. After the termination of starting jet, a stopping vortex ring (Das et al. Reference Das, Bansal and Manghnani2017; Zhu et al. Reference Zhu, Zhang, Yu, Gao and Zhao2024b) with an opposite sign of
 $\omega _Y$
relative to the leading vortex ring forms near the nozzle exit (figure 9
aiii). Meanwhile, the streamlines near the nozzle exit show a radially inward flow toward the jet axis (Zhu et al. Reference Zhu, Zhang, Yu, Gao and Zhao2024b), while maintaining symmetry.
Comparison of vorticity contours
 $\omega _Y$
with streamlines on the
 $X{-}Z$
plane between (a) a single starting jet (case 20) and (b) twin-starting jets (case 15 with
 $S/D=2$
). Here,
 $U_{m\_1st}$
and
 $U_{m\_2nd}$
are the mutually induced velocities from the 1st LVR and 2nd LVR, respectively.

For the twin-starting jets with
 $S/D=2$
shown in figure 9(b), the interaction between the 1st LVR and 2nd LVR disrupts the symmetry of their respective wakes about the jet axes, i.e.
 $Z/D=\pm 1$
. Initially, the shear layers of two starting jets roll up at their respective nozzle exit edges to form the coplanar 1st LVR and 2nd LVR (figure 9
bi). The zero flow flux at
 $Z/D=0$
(
 $X{-}Y$
plane) constrains the radial development of streamlines from two nozzles, thereby reducing their curvature toward
 $Z/D=0$
. As the 1st LVR and 2nd LVR grow and translate downstream, the vortex cores close to
 $Z/D=0$
of the 1st LVR and 2nd LVR begin to interact with each other, as shown in figure 9(bii) at
 $t^*=1.938$
. The mutually induced velocities, defined according to Sadri & Krueger (Reference Sadri and Krueger2017) and Zhu et al. (Reference Zhu, Zhang, Gao and Yu2022), slow down their downstream movement. This may explain why
 $X_c$
calculated on plane 1 is smaller than that obtained on plane 3. After the termination of twin-starting jets, the vortex cores close to
 $Z/D=0$
of the 1st LVR and 2nd LVR begin to touch each other and show significant deformation (figure 9
biii). Meanwhile, the streamlines corresponding to these two jets bend toward
 $Z/D=0$
, which is similar to the wake of twin-continuous jets (Wang, Lee & Hassan Reference Wang, Lee and Hassan2016). In addition, the stopping vortex rings generated near the nozzle exits lose symmetry about their respective jet axes, as evidenced by the asymmetric streamlines near the nozzle exits.
In general, the wake of twin-starting jets remains symmetric about
 $Z/D=0$
. Combining the constraint of zero flow flux at
 $Z/D=0$
, the behaviour of each jet resembles that of an offset steady jet, i.e. a steady jet interacting with a wall parallel to its axis (Agelin-Chaab & Tachie Reference Agelin-Chaab and Tachie2011). As it develops downstream, the offset jet gradually develops into a flow pattern analogous to that of a canonical wall jet (Hoch & Jiji Reference Hoch and Jiji1981). The presence of a parallel wall has been shown to increase the pressure near the nozzle exit (Glauert Reference Glauert1956; Bakke Reference Bakke1957) and thereby enhance thrust. Several investigations have investigated the interactions between a starting jet and a parallel wall (O’Loughlin & Bohl Reference O’Loughlin and Bohl2010; Cabaleiro, Laborde & Artana Reference Cabaleiro, Laborde and Artana2015), focusing mainly on the kinematic characteristics and the associated vortex–wall interactions. The flow structures observed in such vortex–wall interactions exhibit notable similarities to those arising from the interaction between twin-starting jets, as discussed by Cabaleiro et al. (Reference Cabaleiro, Laborde and Artana2015) (see figures 4 and 5 in their manuscript). However, the consequent influence of such interaction on thrust generation has not yet been systematically explored. The analysis of force generation in twin-starting jets presented in present work may also offer new insights into this issue. It should be noted that the interaction between twin-starting jets satisfies only the condition of zero flow flux at
 $Z/D = 0$
, rather than the no-slip constraint imposed by a physical wall. Furthermore, the formation of a confined vortex ring can be interpreted as the interaction between a starting jet and a coaxial cylindrical wall, which confines the radial expansion of leading vortex ring and slows it down (Stewart et al. Reference Stewart, Niebel, Jung and Vlachos2012; Danaila et al. Reference Danaila, Luddens, Kaplanski, Papoutsakis and Sazhin2018). This behaviour closely resembles that of the vortex cores close to
 $Z/D=0$
of the 1st LVR and 2nd LVR in twin-starting jets.
3.2. Influence on the generation of axial thrust
The most concerned force generated by a starting jet is the axial thrust
 $F_{\textit{axial}}$
required for propulsion, which can be calculated by (2.7). In order to explore the underlying mechanism by which the interaction affects thrust generation,
 $F_{\textit{axial}}$
is further decomposed into three components as follows (cf. figure 2):
 \begin{equation} F_{\textit{axial}}=F_{L{\textit 1}\_P}+F_{L1\_U}+F_{L2\_X}, \end{equation}
where
 ${F}_{L{\textit 1}\_P}$
and
 $F_{L1\_U}$
are the first and second terms on the right-hand side of (2.4), respectively, representing the axial thrust contributions from the gauge pressure and momentum flux at the nozzle exit (Krueger & Gharib Reference Krueger and Gharib2003; Gao et al. Reference Gao, Wang, Yu and Chyu2020). They can be expressed as
 \begin{align} {F}_{L{\textit 1}\_P}=\int _0^{0.5D}\int _0^{2\pi }\! P(x,r,\theta )|_{x=0}r\, {\rm d}\theta\, {\rm d}r, \end{align}
 \begin{align} F_{L1\_U}=\int _0^{0.5D}\int _0^{2\pi }\! \rho u^2(x,r,\theta )|_{x=0}r\, {\rm d}\theta\, {\rm d}r. \end{align}
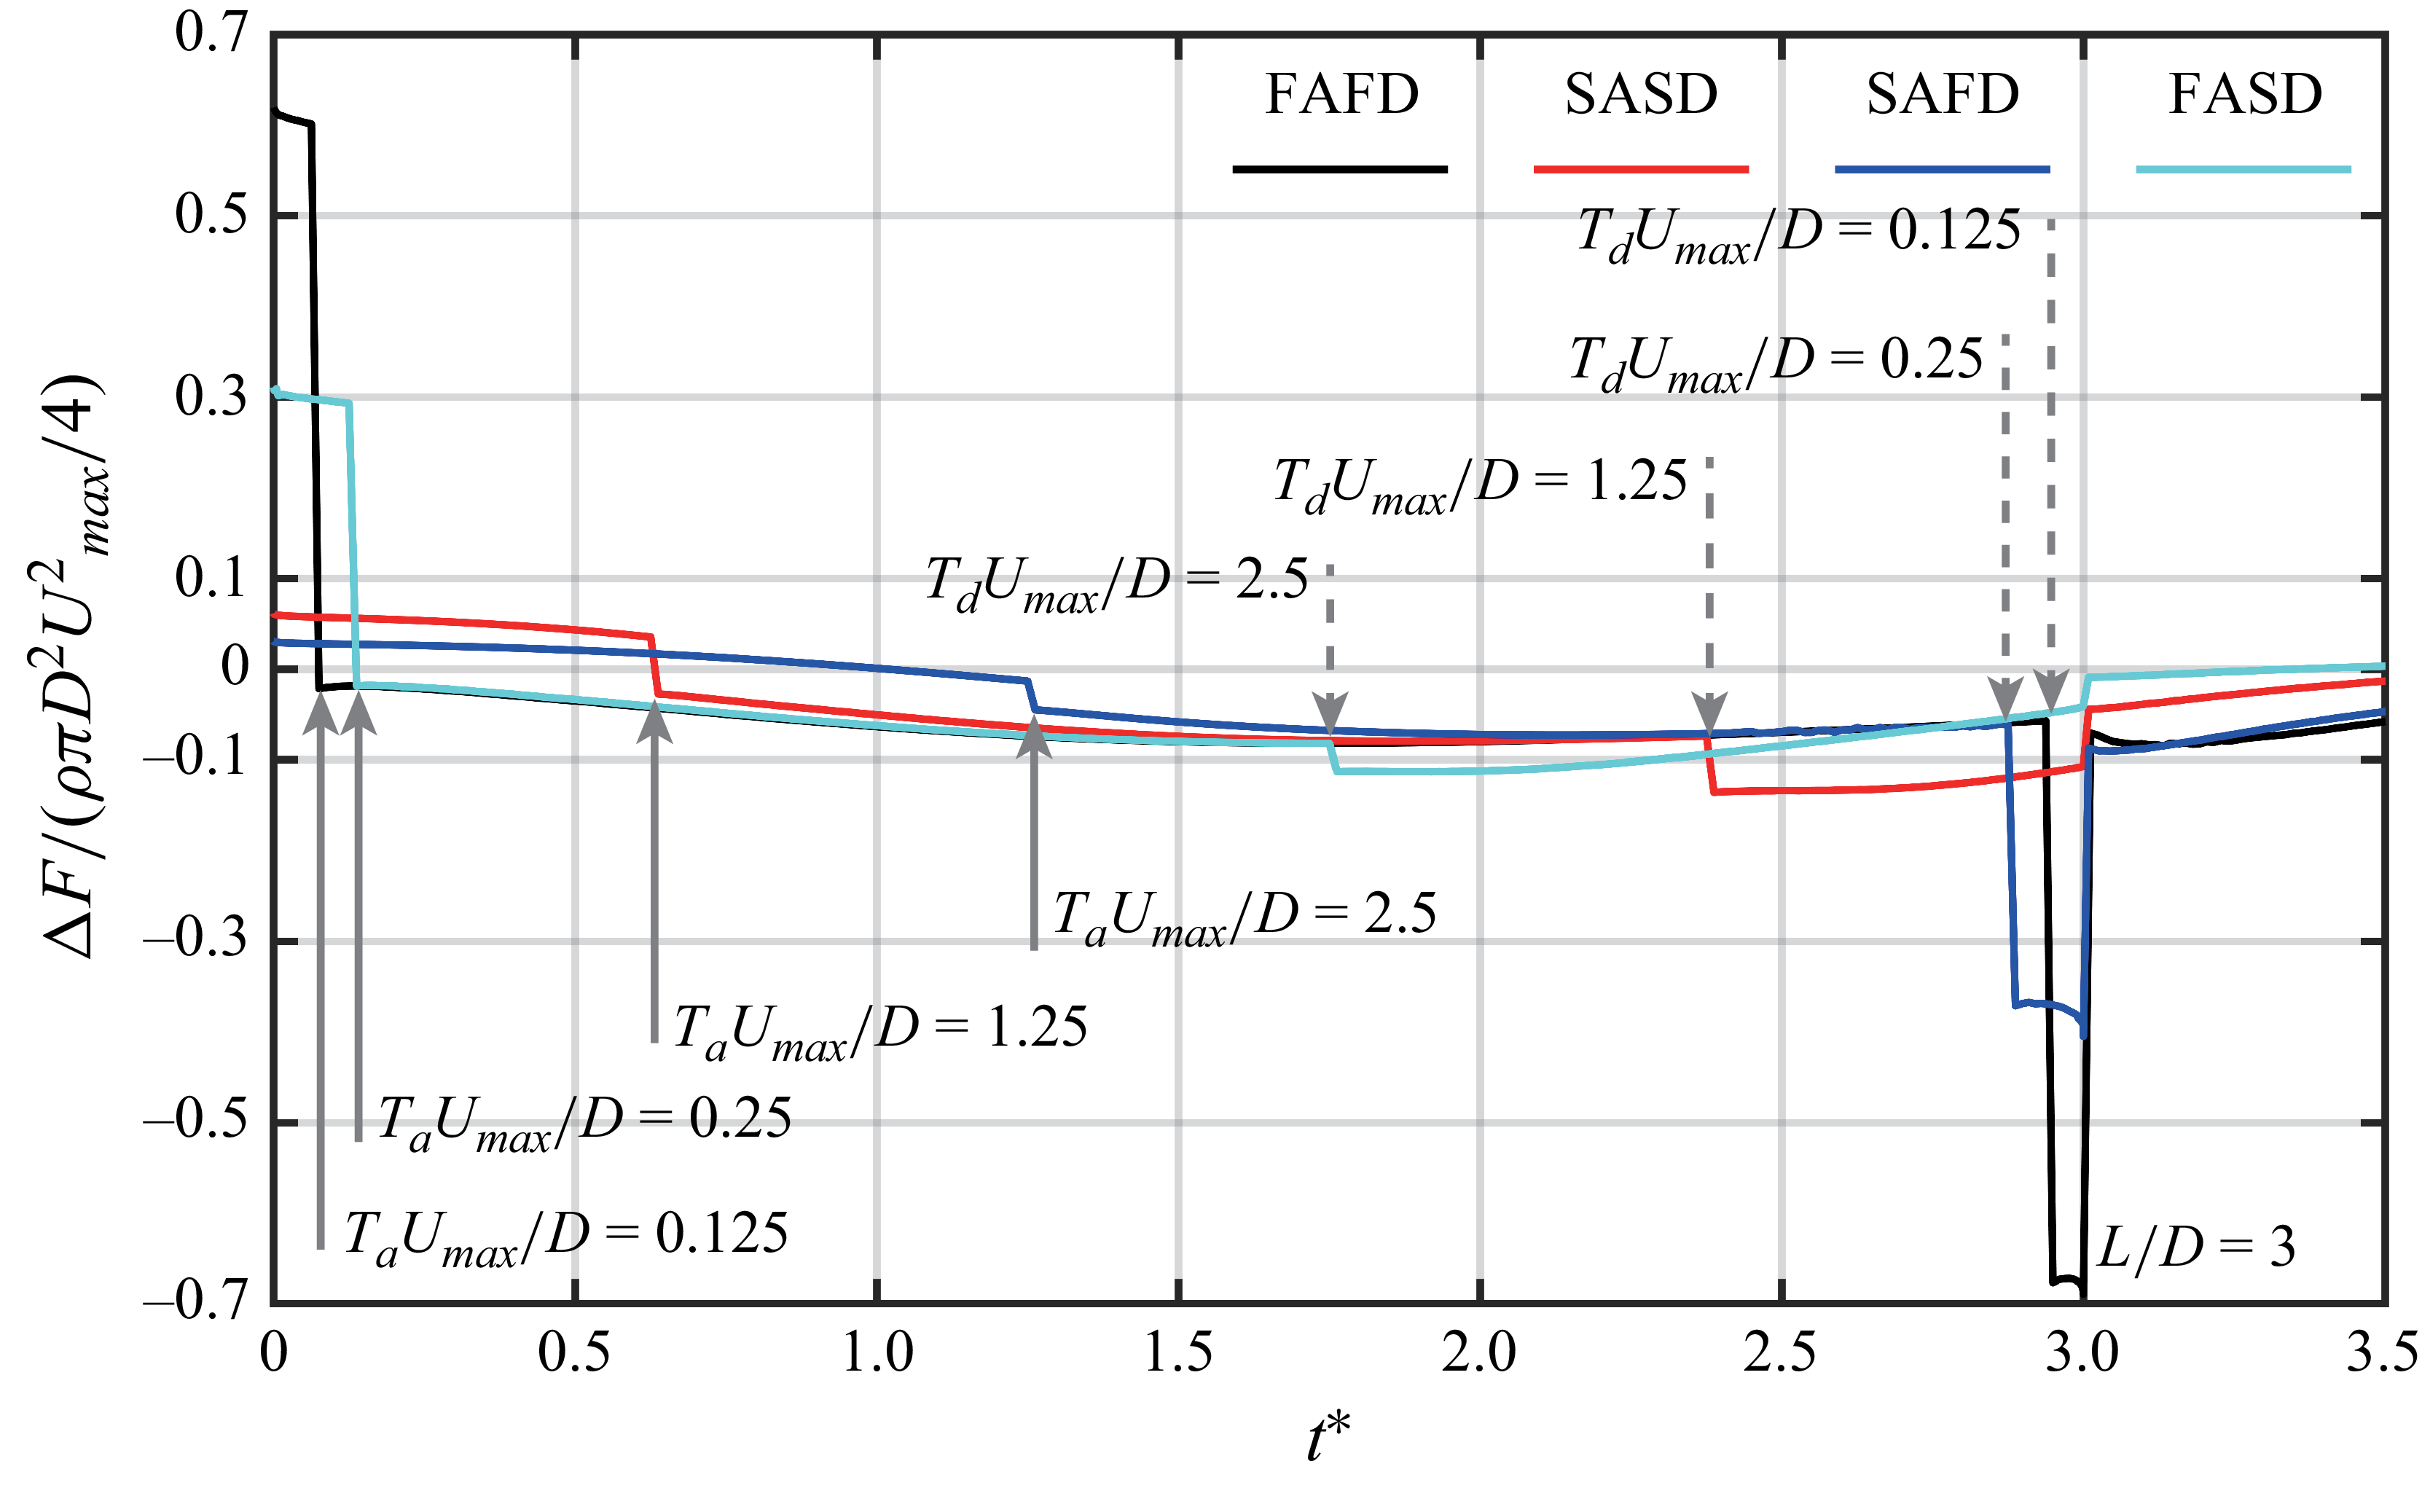
In order to more clearly illustrate the influence of interaction, the thrust generated by the twin-starting jets is compared with twice that of a single starting jet. Therefore, the thrust difference
 $\Delta{\kern-1pt}F$
is defined as follows:
 \begin{equation} \Delta F(t)|_{S/D\neq \infty }=F(t)|_{S/D\neq \infty }-2F(t)|_{S/D= \infty }. \end{equation}
A positive
 $\Delta{\kern-1pt}F$
indicates that the interaction enhances the generation of axial thrust, while a negative
 $\Delta{\kern-1pt}F$
implies that the interaction weakens it. The value of
 $\Delta{\kern-1pt}F$
induced by the interaction of twin-starting jets is calculated separately for
 $F_{\textit{axial}}$
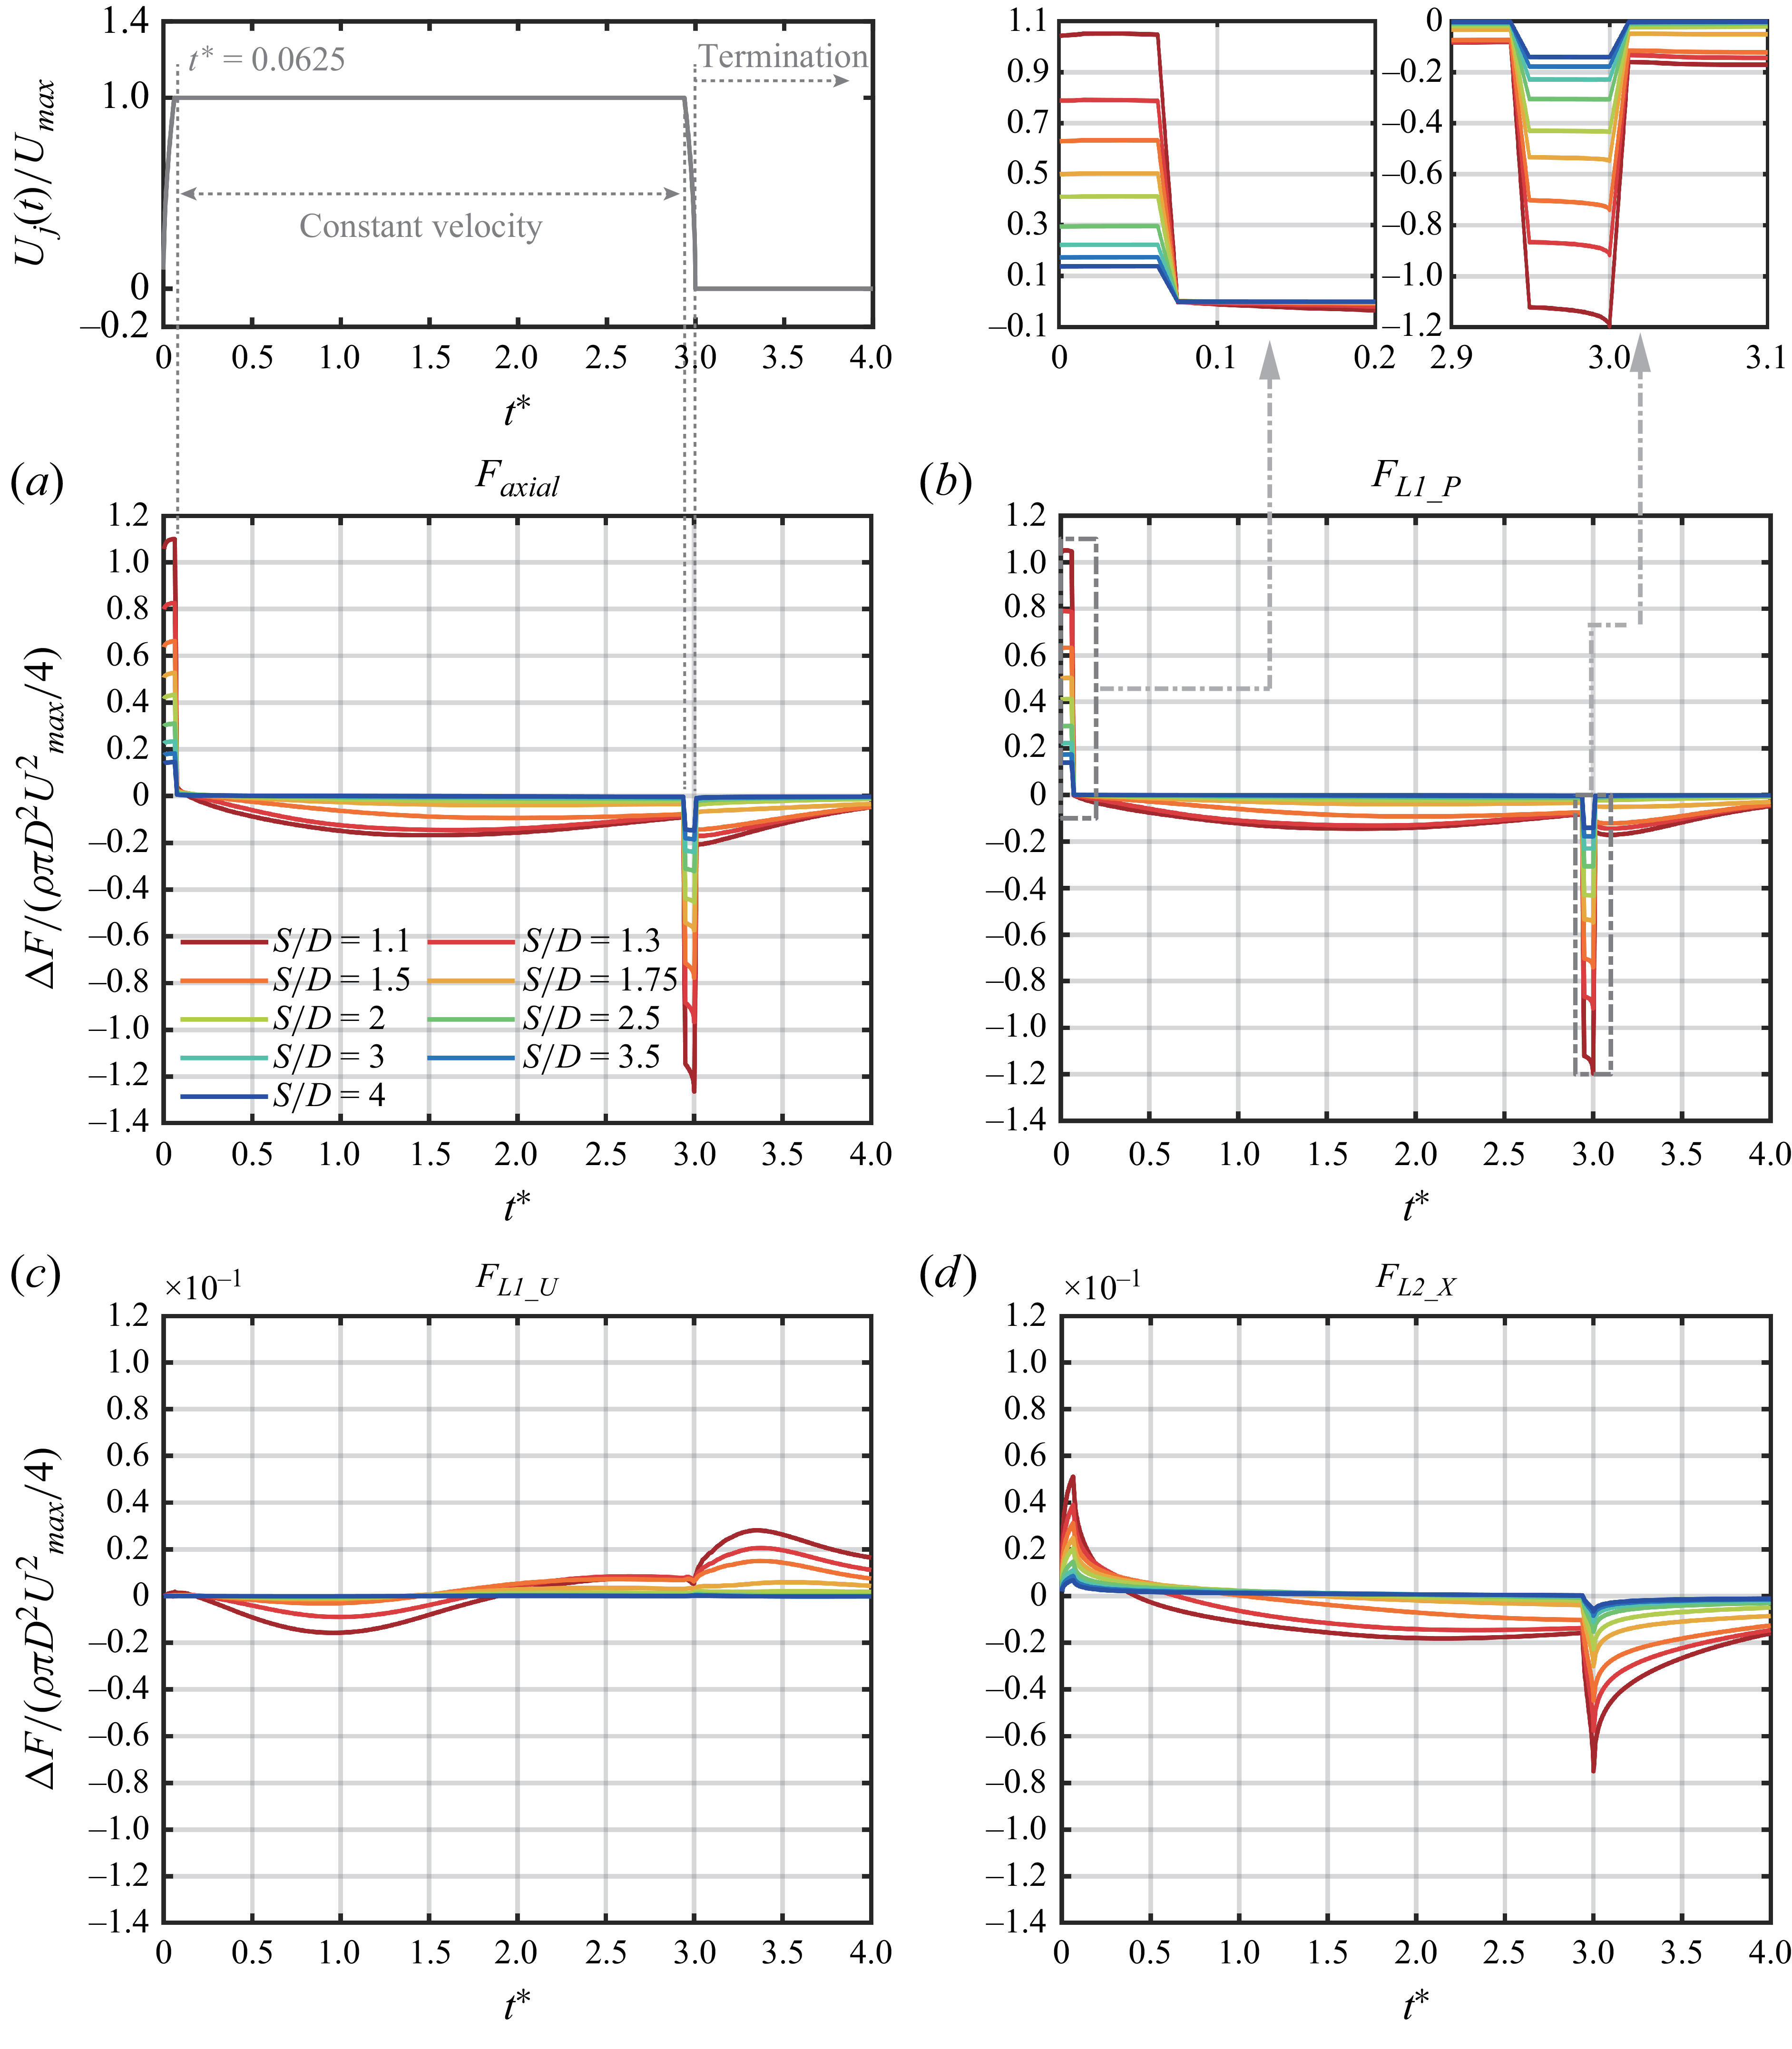
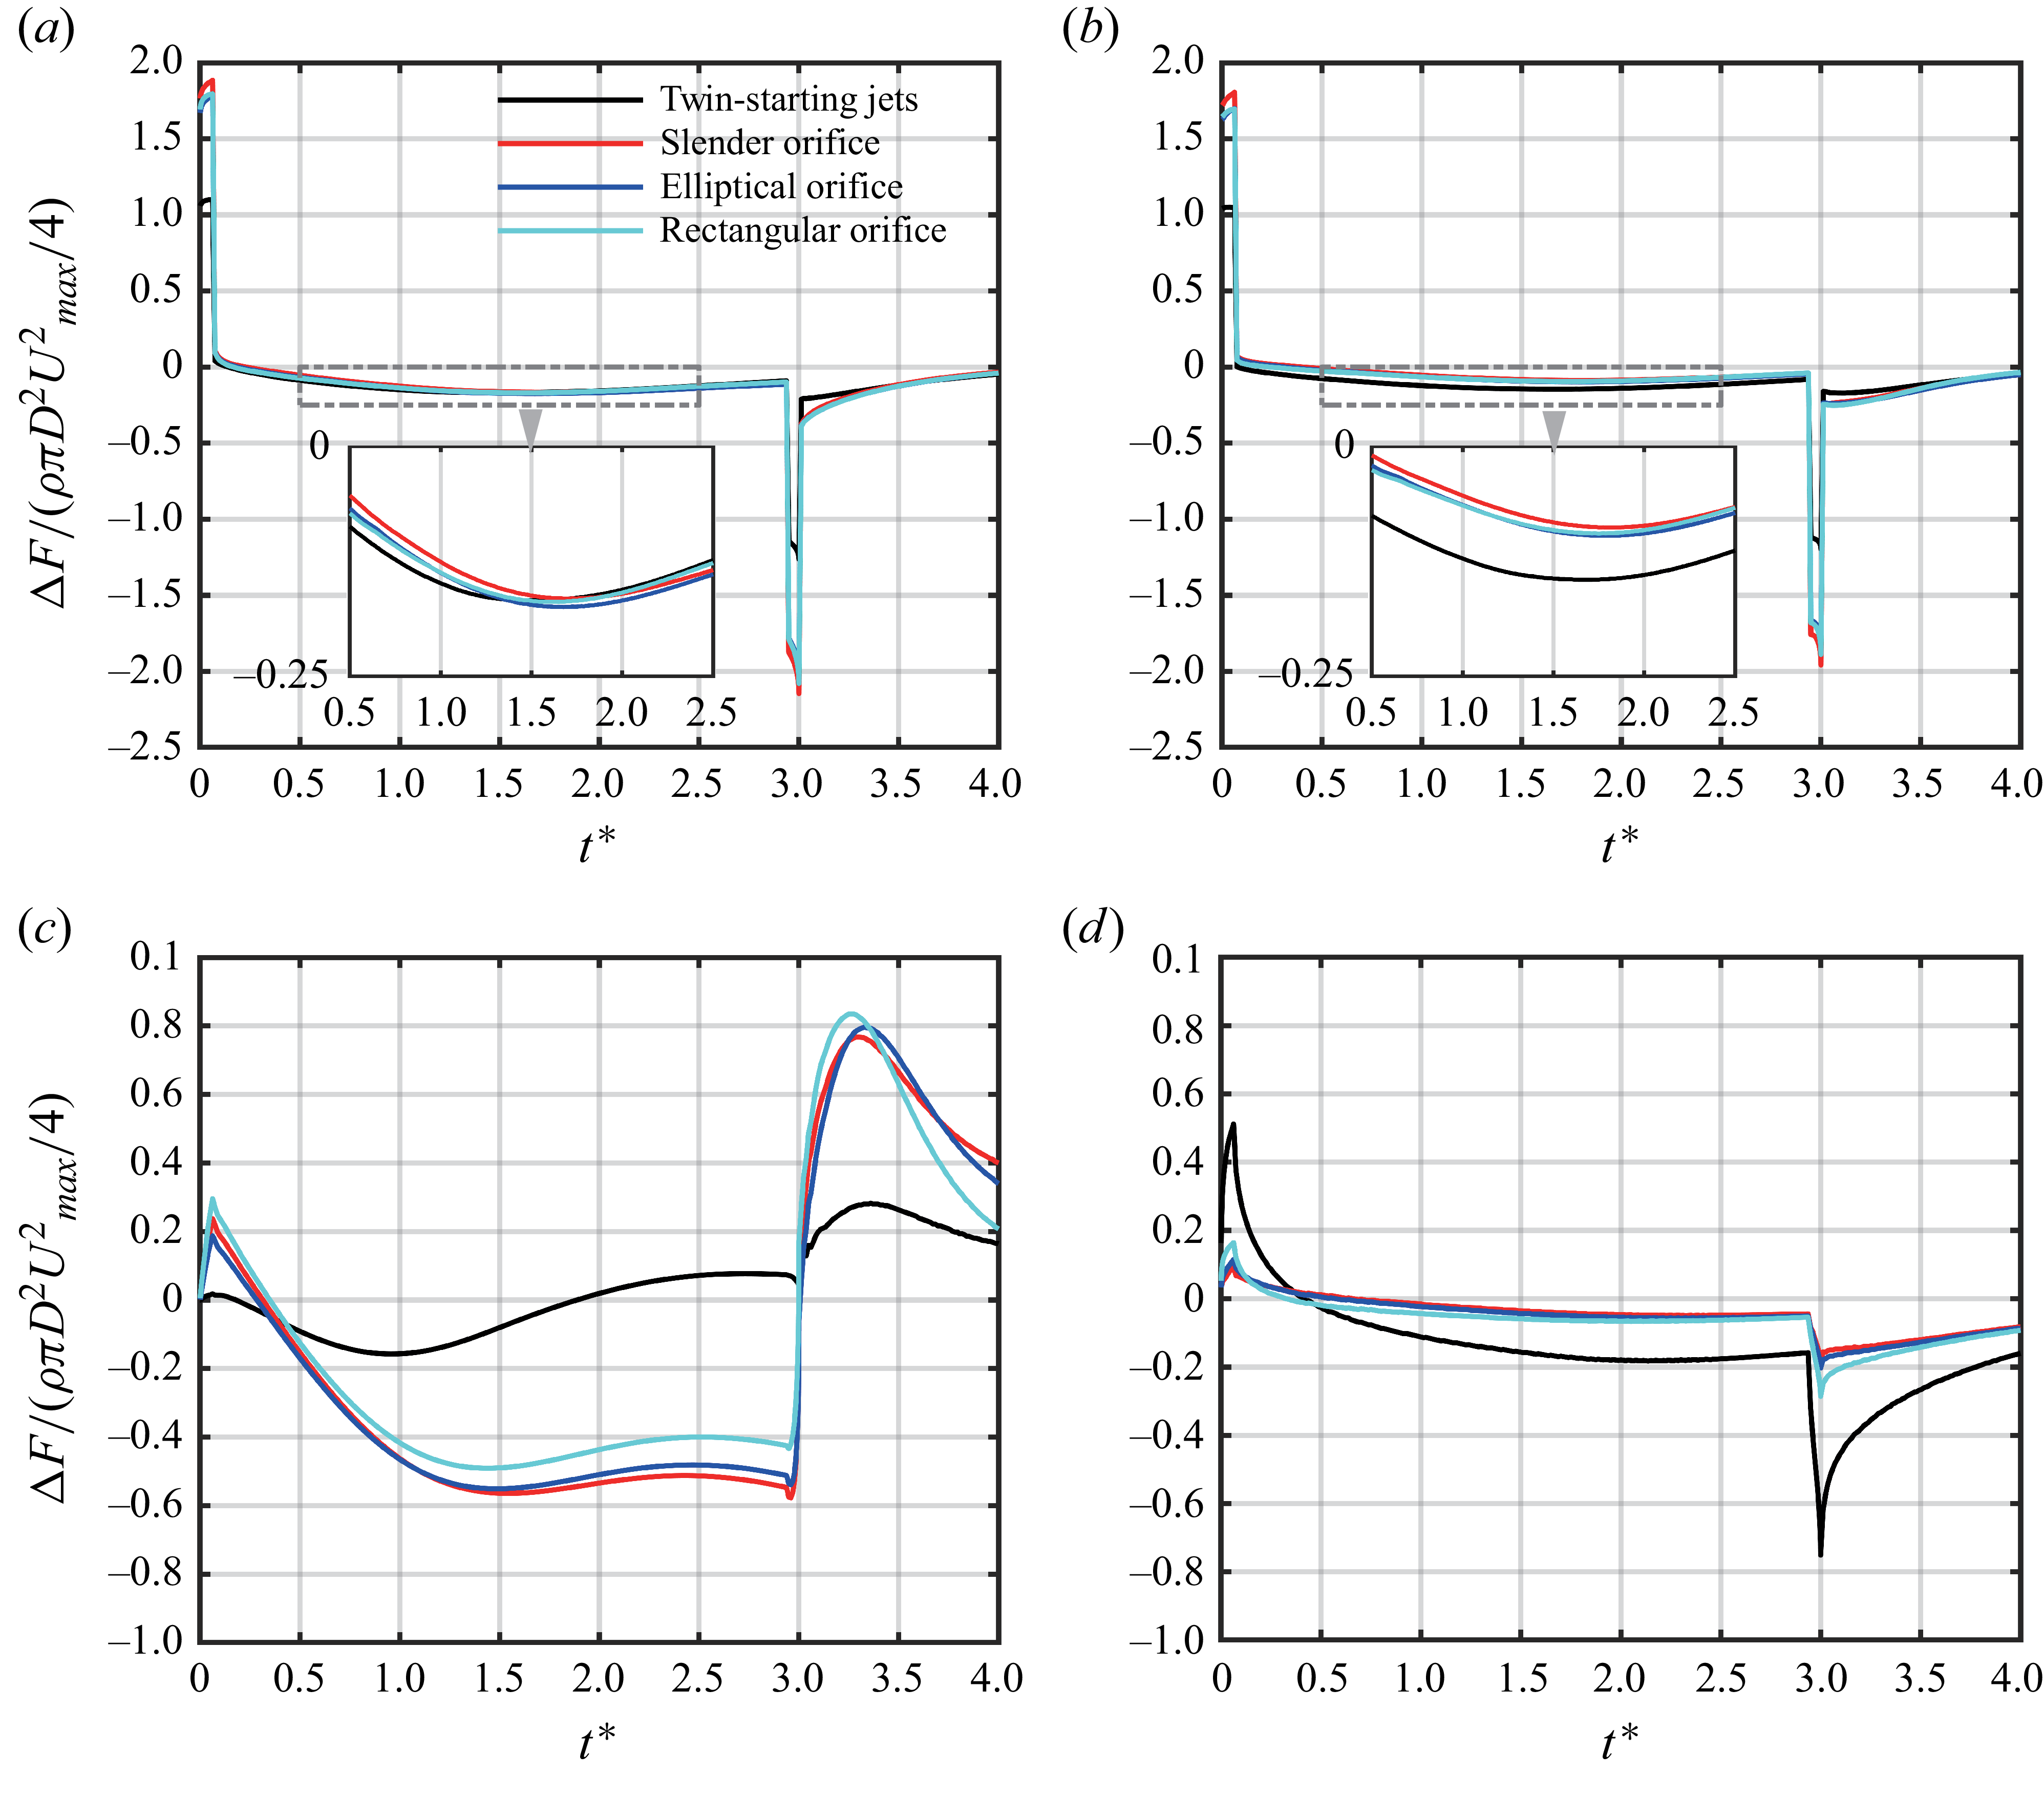
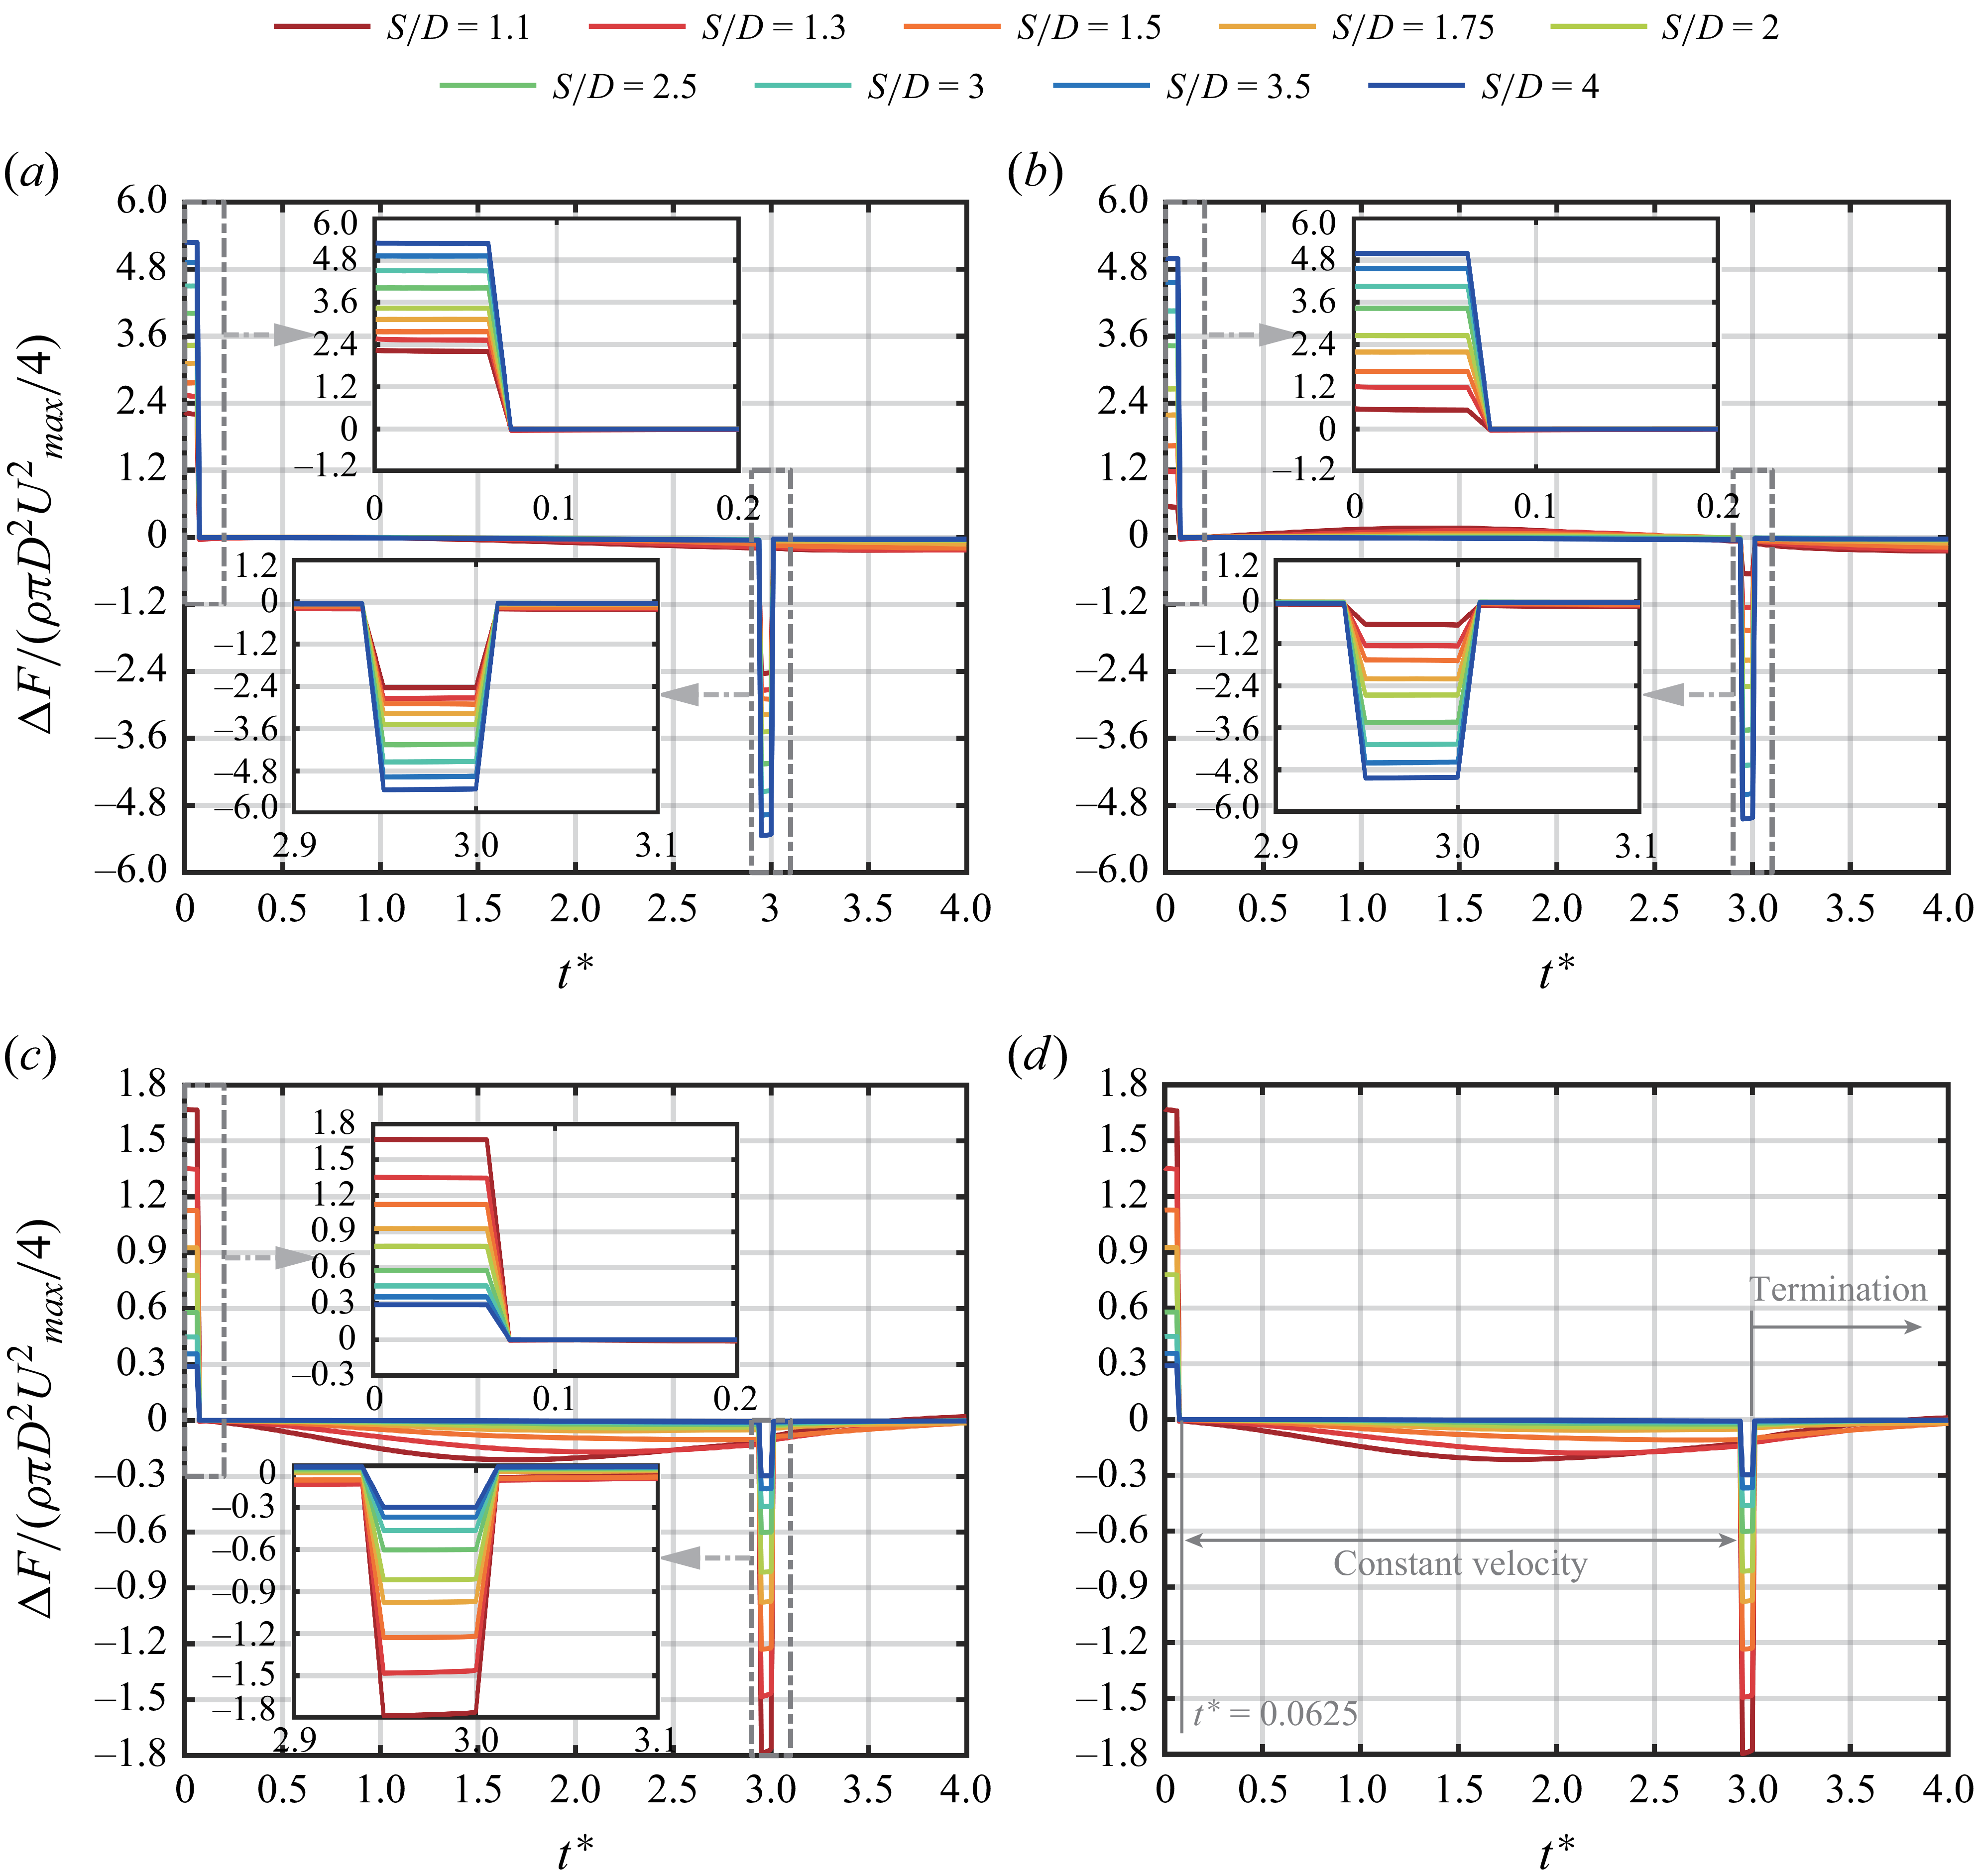
and its three components (3.5). The results are shown in figure 10 for cases 11-19 with
 $L/D=3$
and
 $S/D$
ranging from 1.1 to 4. The value of
 $\Delta{\kern-1pt}F$
for
 $F_{\textit{axial}}$
is governed by the interaction of twin-starting jets mainly through its influence on the generation of
 ${F}_{L{\textit 1}\_P}$
. The development of
 $\Delta{\kern-1pt}F$
for
 $F_{\textit{axial}}$
and
 ${F}_{L{\textit 1}\_P}$
exhibits nearly identical trends at each
 $S/D$
. In contrast, the contributions from the other two components,
 $\Delta{\kern-1pt}F$
for
 $F_{L1\_U}$
and
 $F_{L2\_X}$
(figure 10
c and 10
d), are negligible, with magnitudes approximately one order of magnitude smaller than that of
 $\Delta{\kern-1pt}F$
for
 ${F}_{L{\textit 1}\_P}$
.
Development of the thrust difference
 $\Delta{\kern-1pt}F$
calculated by (3.8), including (a) total axial thrust
 $F_{\textit{axial}}$
and its components: (b)
 ${F}_{L{\textit 1}\_P}$
, (c)
 $F_{L1\_U}$
and (d)
 $F_{L2\_X}$
, for cases 11-19 with
 $L/D=3$
.

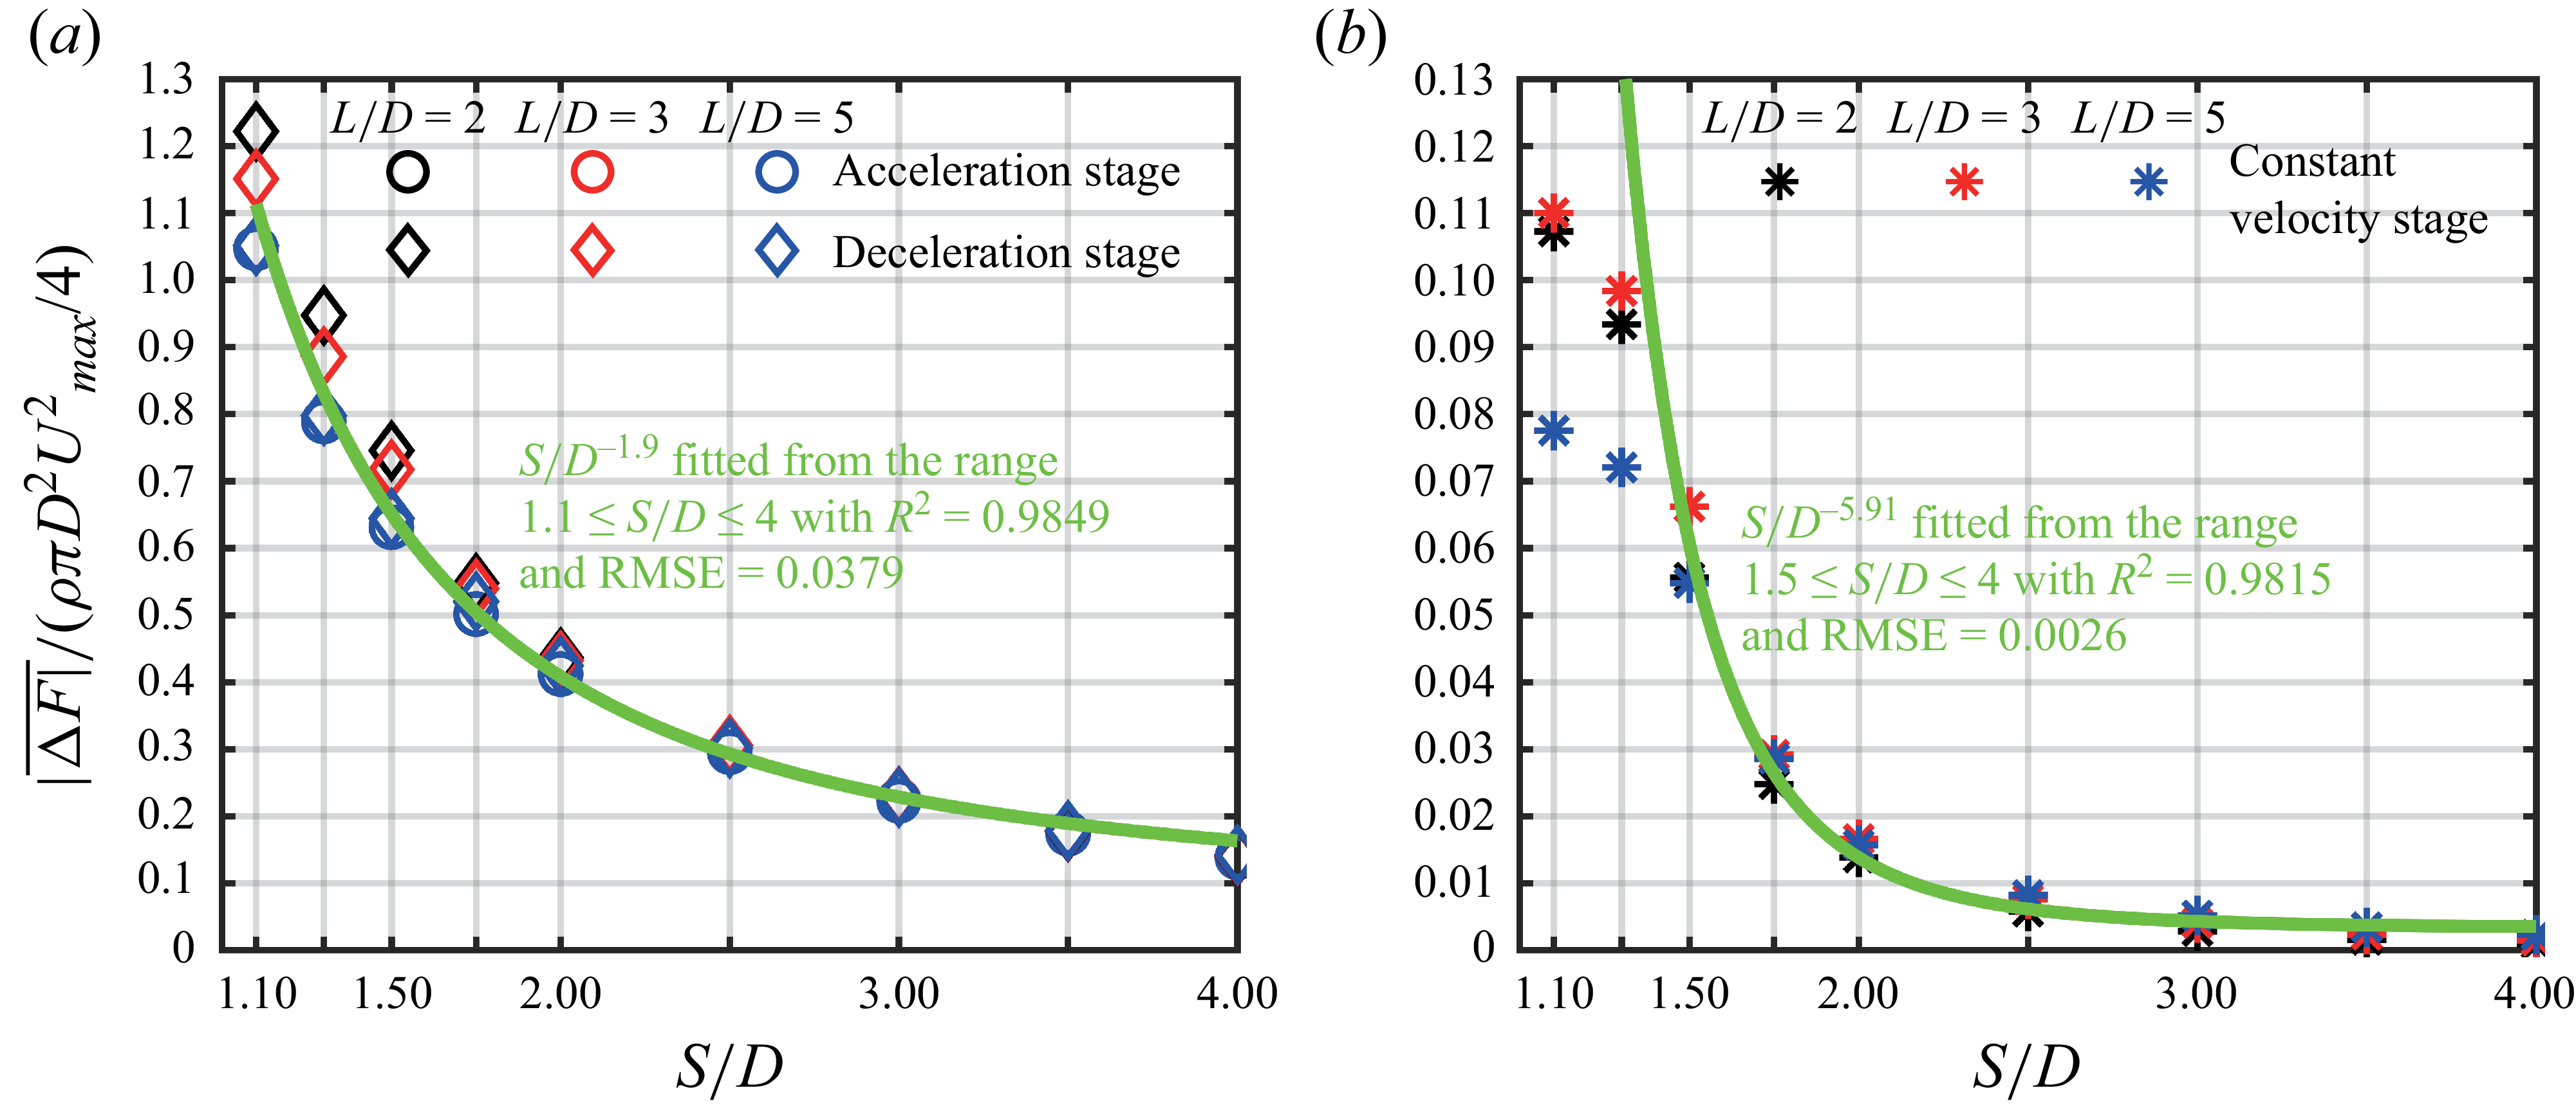
As shown in figure 10(a),
 $\Delta{\kern-1pt}F$
for
 $F_{\textit{axial}}$
is positive during the acceleration stage and negative during the deceleration stage, with comparable magnitudes in both stages. The magnitude of
 $\Delta{\kern-1pt}F$
exceeds
 $100\,\%$
of
 $\rho \pi\! D^2U_{\textit{max}}^2/4$
at
 $S/D=1.1$
. The value of
 $\rho \pi\! D^2U_{\textit{max}}^2/4$
can be considered as the thrust magnitude generated by a continuous jet with velocity
 $U_{\textit{max}}$
(Krueger & Gharib Reference Krueger and Gharib2003). During the constant velocity stage,
 $\Delta{\kern-1pt}F$
remains negative and is approximately one order of magnitude smaller than that during the acceleration and deceleration stages. This suggests that they might be governed by different mechanisms. After the termination of starting jet, the negative
 $\Delta{\kern-1pt}F$
increases only slightly in magnitude relative to that during the constant velocity stage. Both during the constant velocity stage and after the termination of the starting jets, the jet acceleration is zero, and the thrust generation is therefore primarily influenced by the vortical structures in the wake (Gao et al. Reference Gao, Wang, Yu and Chyu2020). The slight increase in the magnitude of
 $\Delta{\kern-1pt}F$
after jet termination can be associated with the additional stopping vortex ring generated during the deceleration stage. Furthermore, variations in
 $S/D$
do not alter the overall development trend of
 $\Delta{\kern-1pt}F$
under the twin-starting jet interaction throughout the aforementioned stages. That is, the four stages characterised by positive, negative or relatively small and large
 $\Delta{\kern-1pt}F$
remain unchanged. Only the magnitude of
 $\Delta{\kern-1pt}F$
increases within each stage as
 $S/D$
decreases.
3.2.1. Mechanisms responsible for the generation of thrust difference
The generation of
 ${F}_{L{\textit 1}\_P}$
is directly governed by the pressure field near the nozzle exit, as shown in (3.6). As a result, the underlying mechanisms responsible for the development of
 $\Delta{\kern-1pt}F$
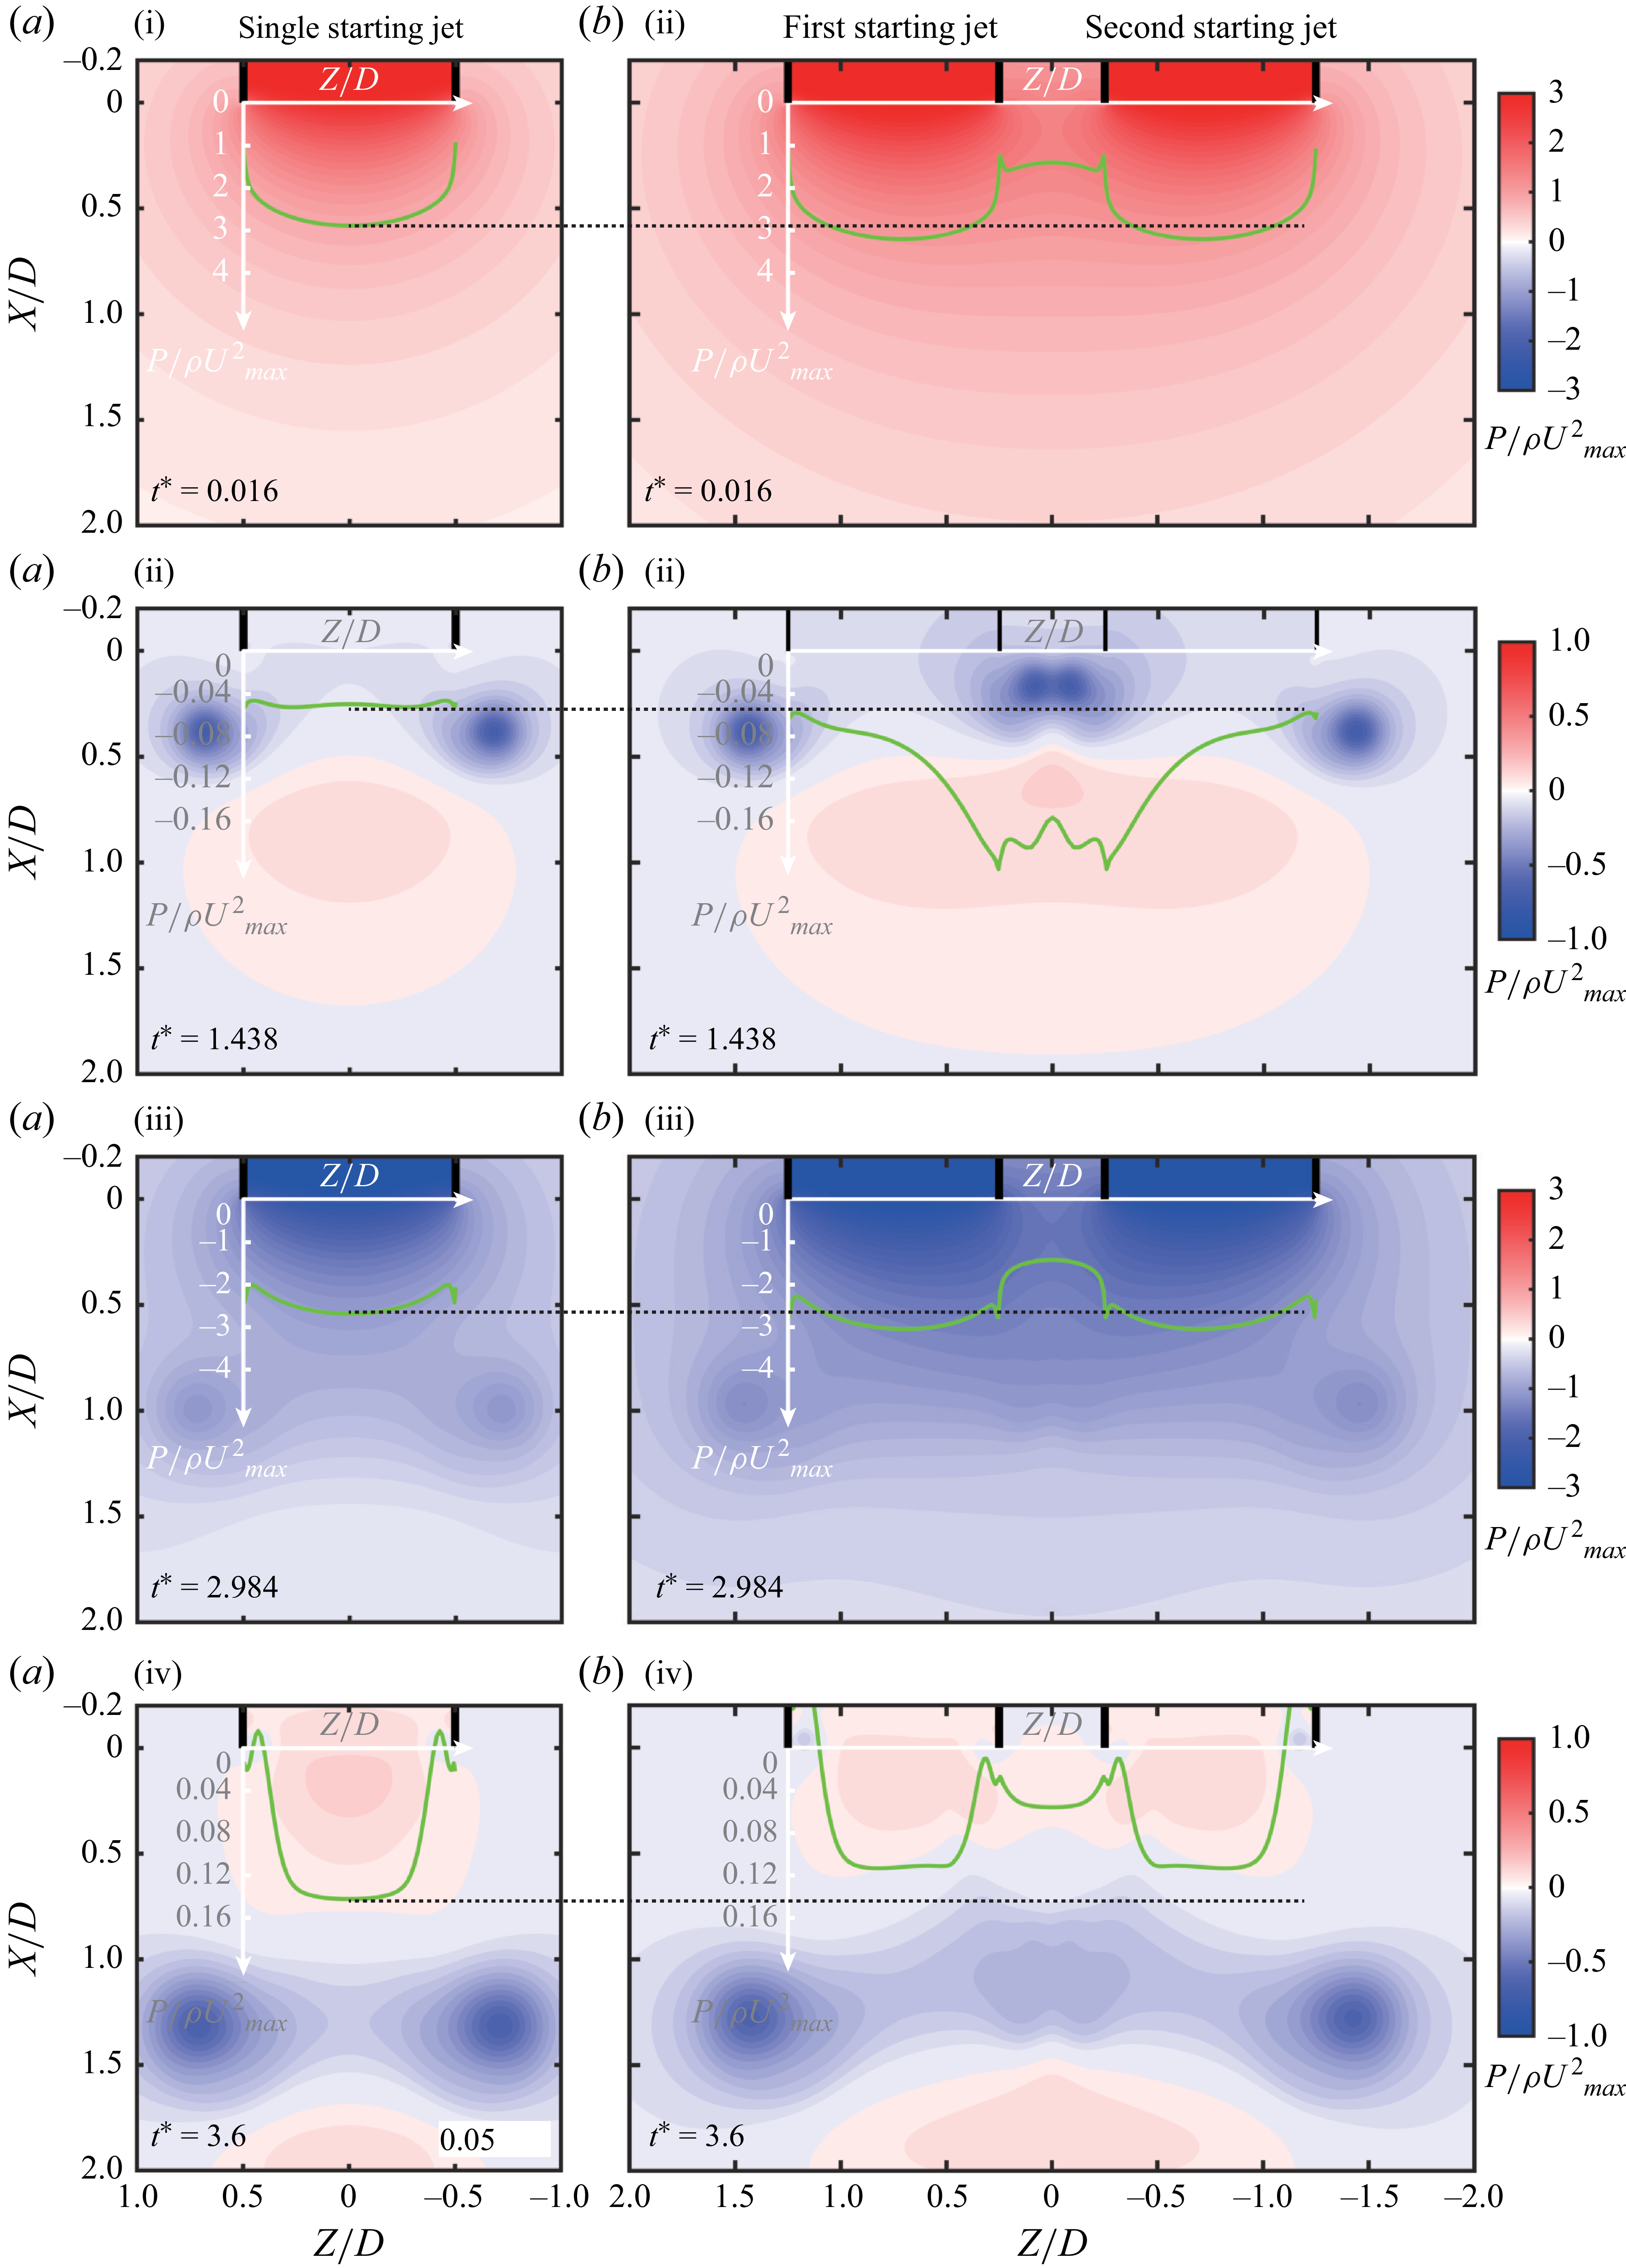
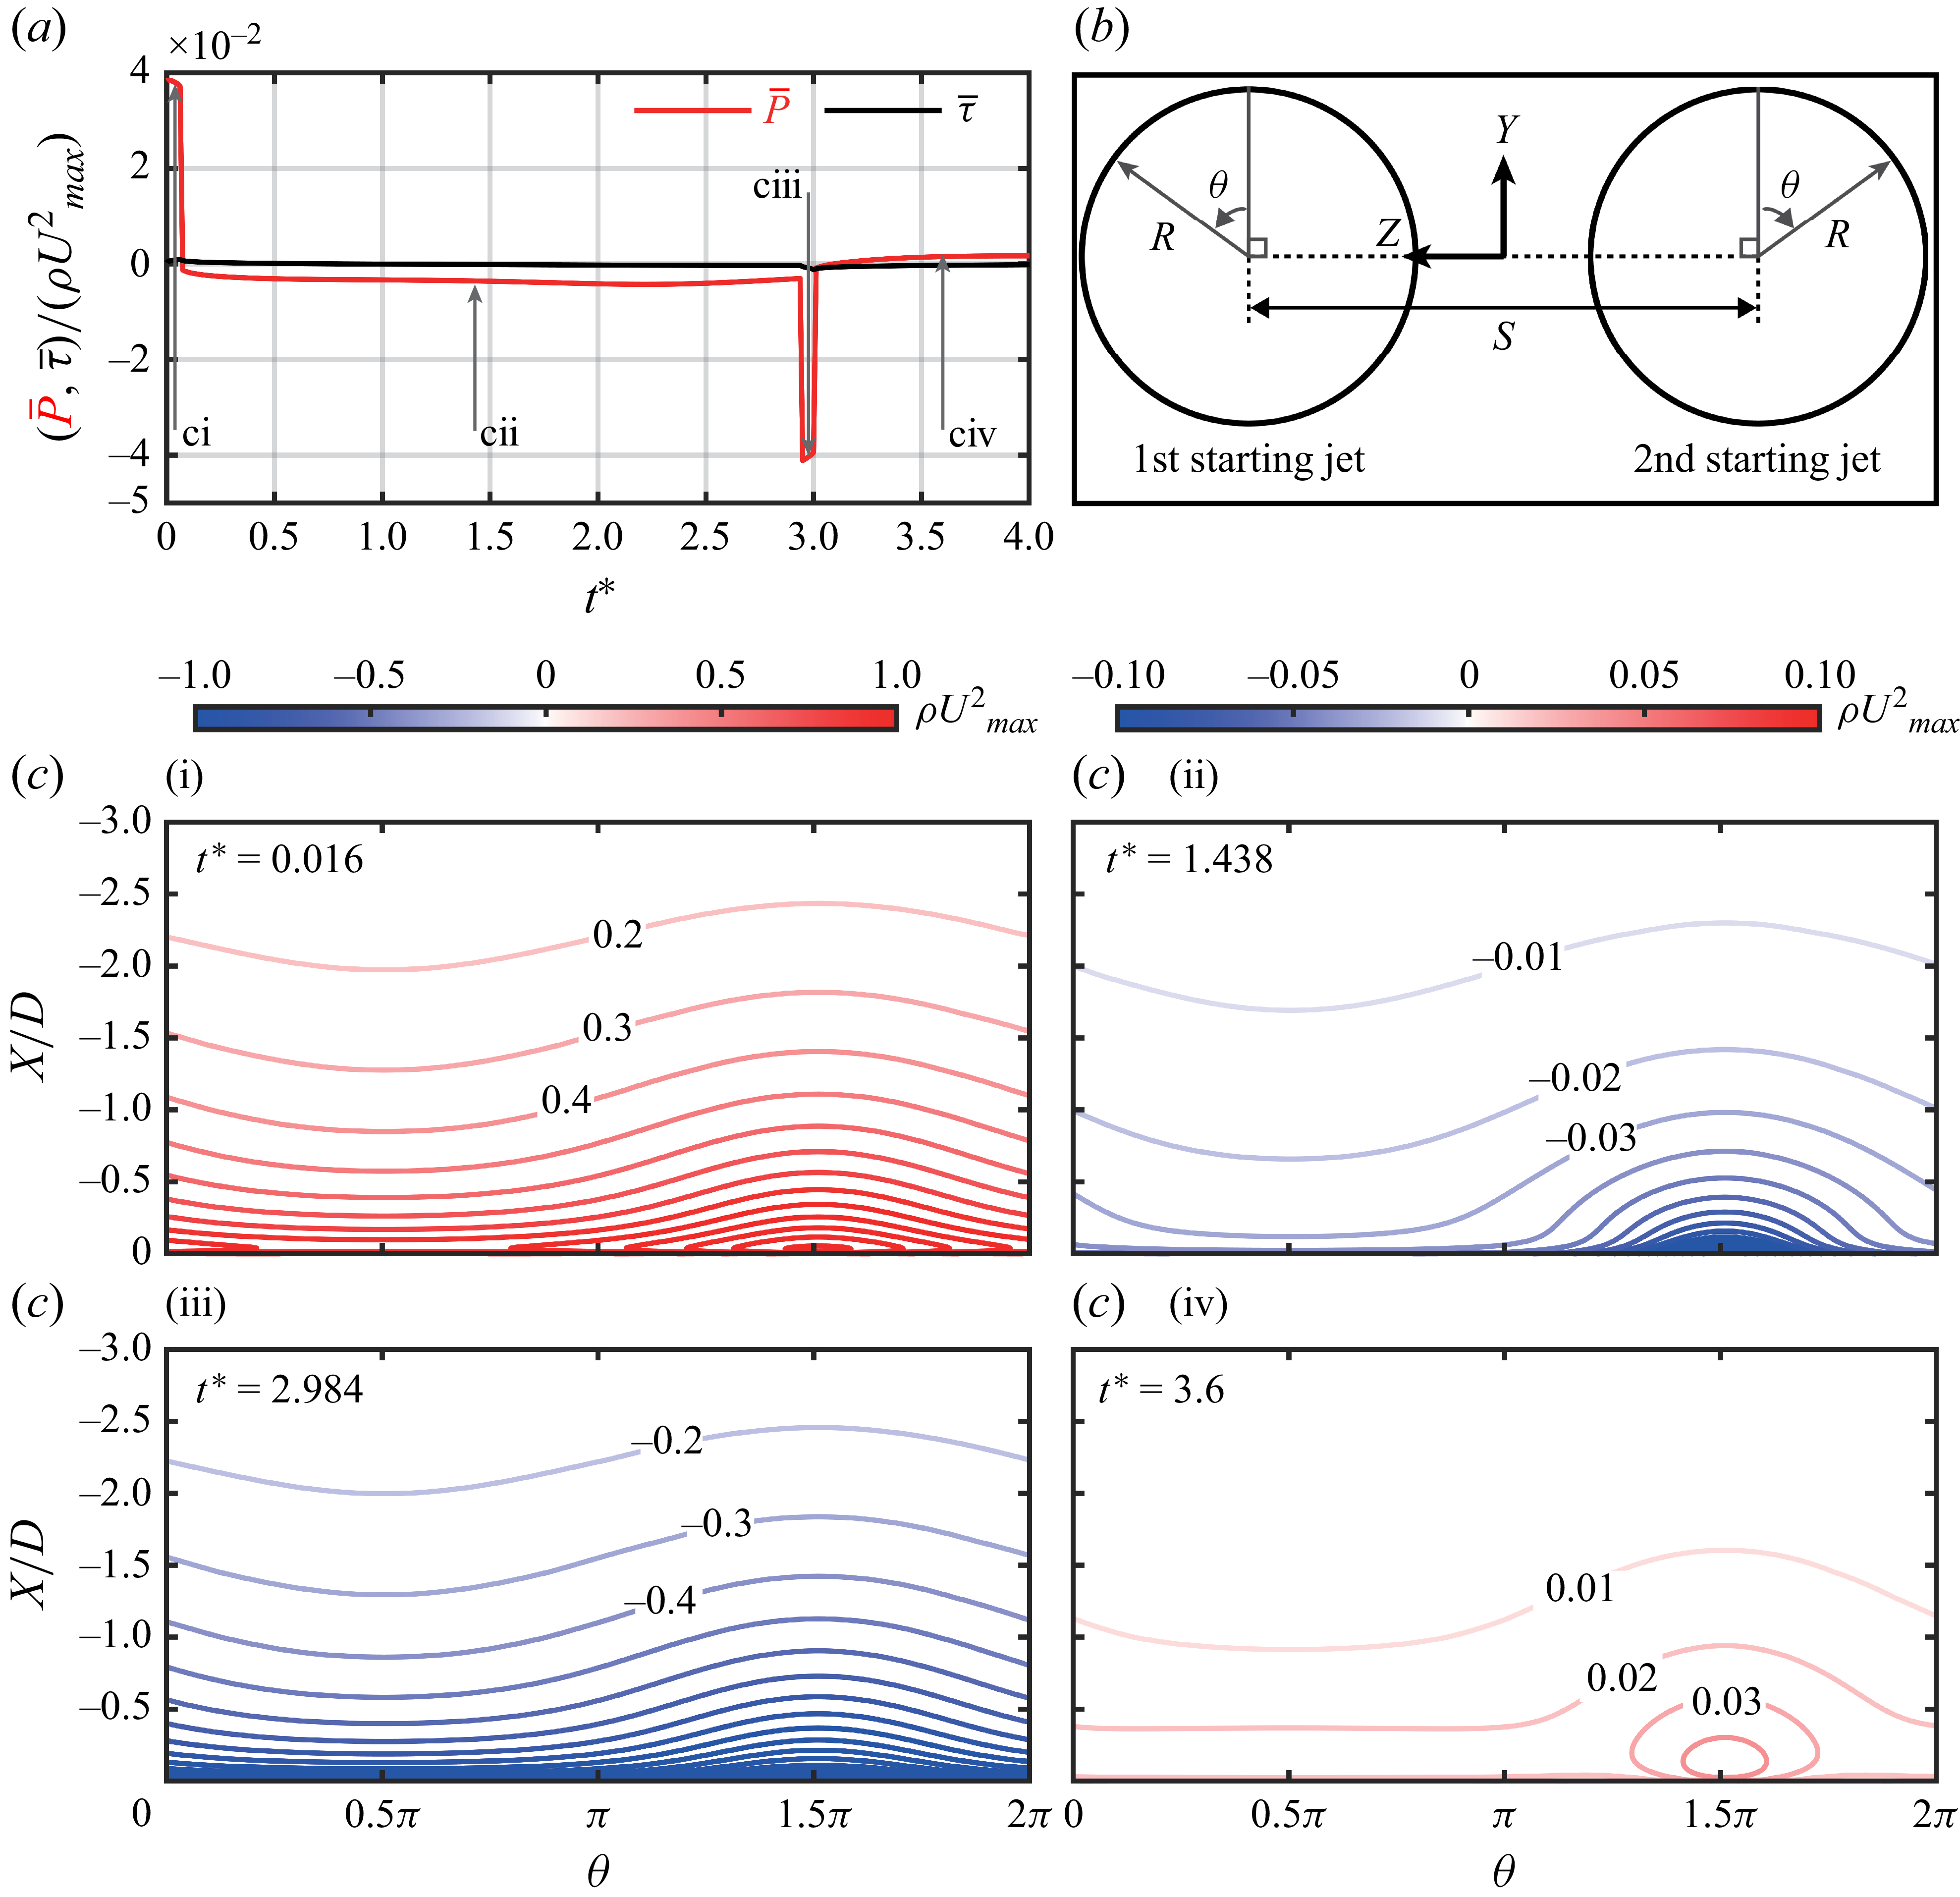
can be elucidated by examining the pressure field near the nozzle exits. Figure 11 presents the pressure fields at four instants, corresponding to the acceleration stage (
 $t^*=0.016$
), constant velocity stage (
 $t^*=1.438$
), deceleration stage (
 $t^*=2.984$
) and the period after jet termination (
 $t^*=3.6$
).
Comparison of pressure fields in the
 $X{-}Z$
plane between (a) a single starting jet (case 20) and (b) the twin-starting jets (case 13 with
 $S/D = 1.5$
). The pressure profiles at the nozzle exits are shown as green solid lines together with the corresponding coordinate system.

The mechanisms responsible for the generation of
 $\Delta{\kern-1pt}F$
during both the acceleration and deceleration stages can be considered as the mutually induced pressure (denoted as MIP). The acceleration of starting jet induces positive gauge pressure near the nozzle exit (figure 11
ai), which corresponds to the positive
 ${F}_{L{\textit 1}\_P}$
(Gao et al. Reference Gao, Wang, Yu and Chyu2020). For the twin-starting jets, the simultaneous acceleration of two jets generates additional positive gauge pressure at each other’s nozzle exits (figure 11
bi). This additional pressure increase results in a positive
 $\Delta{\kern-1pt}F$
. A similar mechanism occurs during the deceleration stage, but the additional gauge pressure induced by the jet deceleration becomes negative (figure 11
aiii and 11
biii). Therefore,
 $\Delta{\kern-1pt}F$
during the deceleration stage exhibits a comparable magnitude but opposite sign to that during the acceleration stage. As the two nozzles are positioned farther away, i.e. increasing
 $S/D$
, the MIP near each nozzle exit weakens. Therefore, the magnitude of
 $\Delta{\kern-1pt}F$
decreases as
 $S/D$
increases during both the acceleration and deceleration stages.
The coupling effects of vortex rings, which includes both leading vortex rings and stopping vortex rings, introduce
 $\Delta{\kern-1pt}F$
during the constant velocity stage and the period after jet termination. During the constant velocity stage, the pressure field near the nozzle exit is primarily governed by the leading vortex ring. Similar to a moving ellipsoidal solid, the leading edge of vortex ring induces a region of positive gauge pressure (Athanassiadis Reference Athanassiadis2016), while its vortex core induces a region of negative gauge pressure (Schlueter-Kuck & Dabiri Reference Schlueter-Kuck and Dabiri2016), as shown in figure 11(aii). The pressure field near the nozzle exit is affected by the latter, which gradually weakens as the leading vortex ring translates downstream from the nozzle exit. However, this is altered in the twin-starting jets. Only the vortex cores away from
 $Z=0$
of the 1st LVR and 2nd LVR move downstream as expected (see figure 11
bii). The vortex cores close to
 $Z=0$
translate more slowly (
 $S/D \gt 1.5$
) due to the mutually induced velocities. Therefore, the nozzle exits of twin-starting jets maintain negative gauge pressure for a longer duration compared with that of single starting jet, corresponding to the negative
 $\Delta{\kern-1pt}F$
for
 ${F}_{L{\textit 1}\_P}$
. The negative gauge pressure induced by one vortex core on the other nozzle exit further amplifies the magnitude of negative
 $\Delta{\kern-1pt}F$
. As
 $S/D$
increases, both the mutually induced velocities between the 1st LVR and 2nd LVR and the negative gauge pressure near the nozzle exit induced by another leading vortex ring are weakened. Therefore, the magnitude of
 $\Delta{\kern-1pt}F$
is reduced. After the termination of starting jet, the negative
 $\Delta{\kern-1pt}F$
induced by the interaction between the 1st LVR and 2nd LVR persists. However, the magnitude of negative
 $\Delta{\kern-1pt}F$
after termination exceeds that before deceleration, as shown from its development in figure 10. In addition, the reconnection between the 1st LVR and 2nd LVR at
 $S/D \lt 1.5$
(recall figure 6) appears to invalidate the interaction between vortex rings described above. After the formation of the 1st LVR and 2nd LVR, they quickly merge into a single vortex ring, which appears to have a different effect on thrust generation compared with the interaction of two separate vortex rings. In the region where the two nozzles are in close proximity, partial interactions between the residual shear layers can still be observed. Therefore, the mechanism by which vortex ring interactions influence thrust generation transitions as
 $S/D$
decreases from above 1.5 to below 1.5. To illustrate the difference, the coupling effects of vortex rings are denoted as CEVR for
 $S/D\gt 1.5$
, and as CEVR-R for
 $S/D\lt 1.5$
.
The difference in
 $\Delta{\kern-1pt}F$
before and after the deceleration stage can be related to the generation of stopping vortex rings. The stopping vortex ring induces a region of lower pressure near its vortex cores, i.e. a small region near the nozzle exit edge (figure 11
aiv). In addition, the induced flow from the stopping vortex ring attempts to transport ambient fluid back into the nozzle, thereby increasing the pressure over a larger region at the nozzle exit centre (Gao et al. Reference Gao, Wang, Yu and Chyu2020). In general, the presence of stopping vortex ring enhances the generation of
 ${F}_{L{\textit 1}\_P}$
(Zhu et al. Reference Zhu, Zhang, Yu, Gao and Zhao2024b). However, for twin-starting jets, the vortex cores close to
 $Z=0$
of two stopping vortex rings exhibit weaker strength compared with those away from
 $Z = 0$
, as shown in figure 11(biv). The negative gauge pressure region induced by them is hardly noticeable. The positive gauge pressure induced by the stopping vortex rings at the nozzle exit centre is therefore weakened, diminishing their beneficial effect and thereby increasing the magnitude of negative
 $\Delta{\kern-1pt}F$
. The weaker vortex cores close to
 $Z=0$
of two stopping vortex rings can also be explained by the pressure distribution shown in figure 11(aiii) and 11(biii). The formation of stopping vortex ring arises from the interaction of radially inward flow with the nozzle wall (Maxworthy Reference Maxworthy1977; Das et al. Reference Das, Bansal and Manghnani2017). The pressure gradient along the
 $Z$
-axis, induced by the deceleration of the starting jet and directed toward the nozzle interior (figure 11aiii) drives the radially inward flow (Zhu et al. Reference Zhu, Zhang, Yu, Gao and Zhao2024b). However, for twin-starting jets, this pressure gradient on the side close to
 $Z = 0$
decreases with decreasing
 $S/D$
, owing to the overlap of negative gauge pressure regions. As a result, the radially inward flow and the corresponding stopping vortex rings are weakened.
The magnitude of
 $\Delta{\kern-1pt}F$
induced by both interaction mechanisms, i.e. the MIP and the coupling effects of vortex rings (CEVR at
 $S/D\gt 1.5$
and CEVR-R at
 $S/D\lt 1.5$
), which decreases with increasing
 $S/D$
, is quantitatively analysed below. During the acceleration stage, the effects of CEVR or CEVR-R can be neglected because the leading vortex rings are still weak. In the constant velocity stage, the magnitude of
 $\Delta{\kern-1pt}F$
governed solely by CEVR (CEVR-R) is approximately one order of magnitude smaller than that governed by MIP for cases with the FAFD velocity program (recall figure 10), i.e. those with sufficiently high acceleration and deceleration rates. Therefore, during the deceleration stage where both mechanisms coexist, the generation of
 $\Delta{\kern-1pt}F$
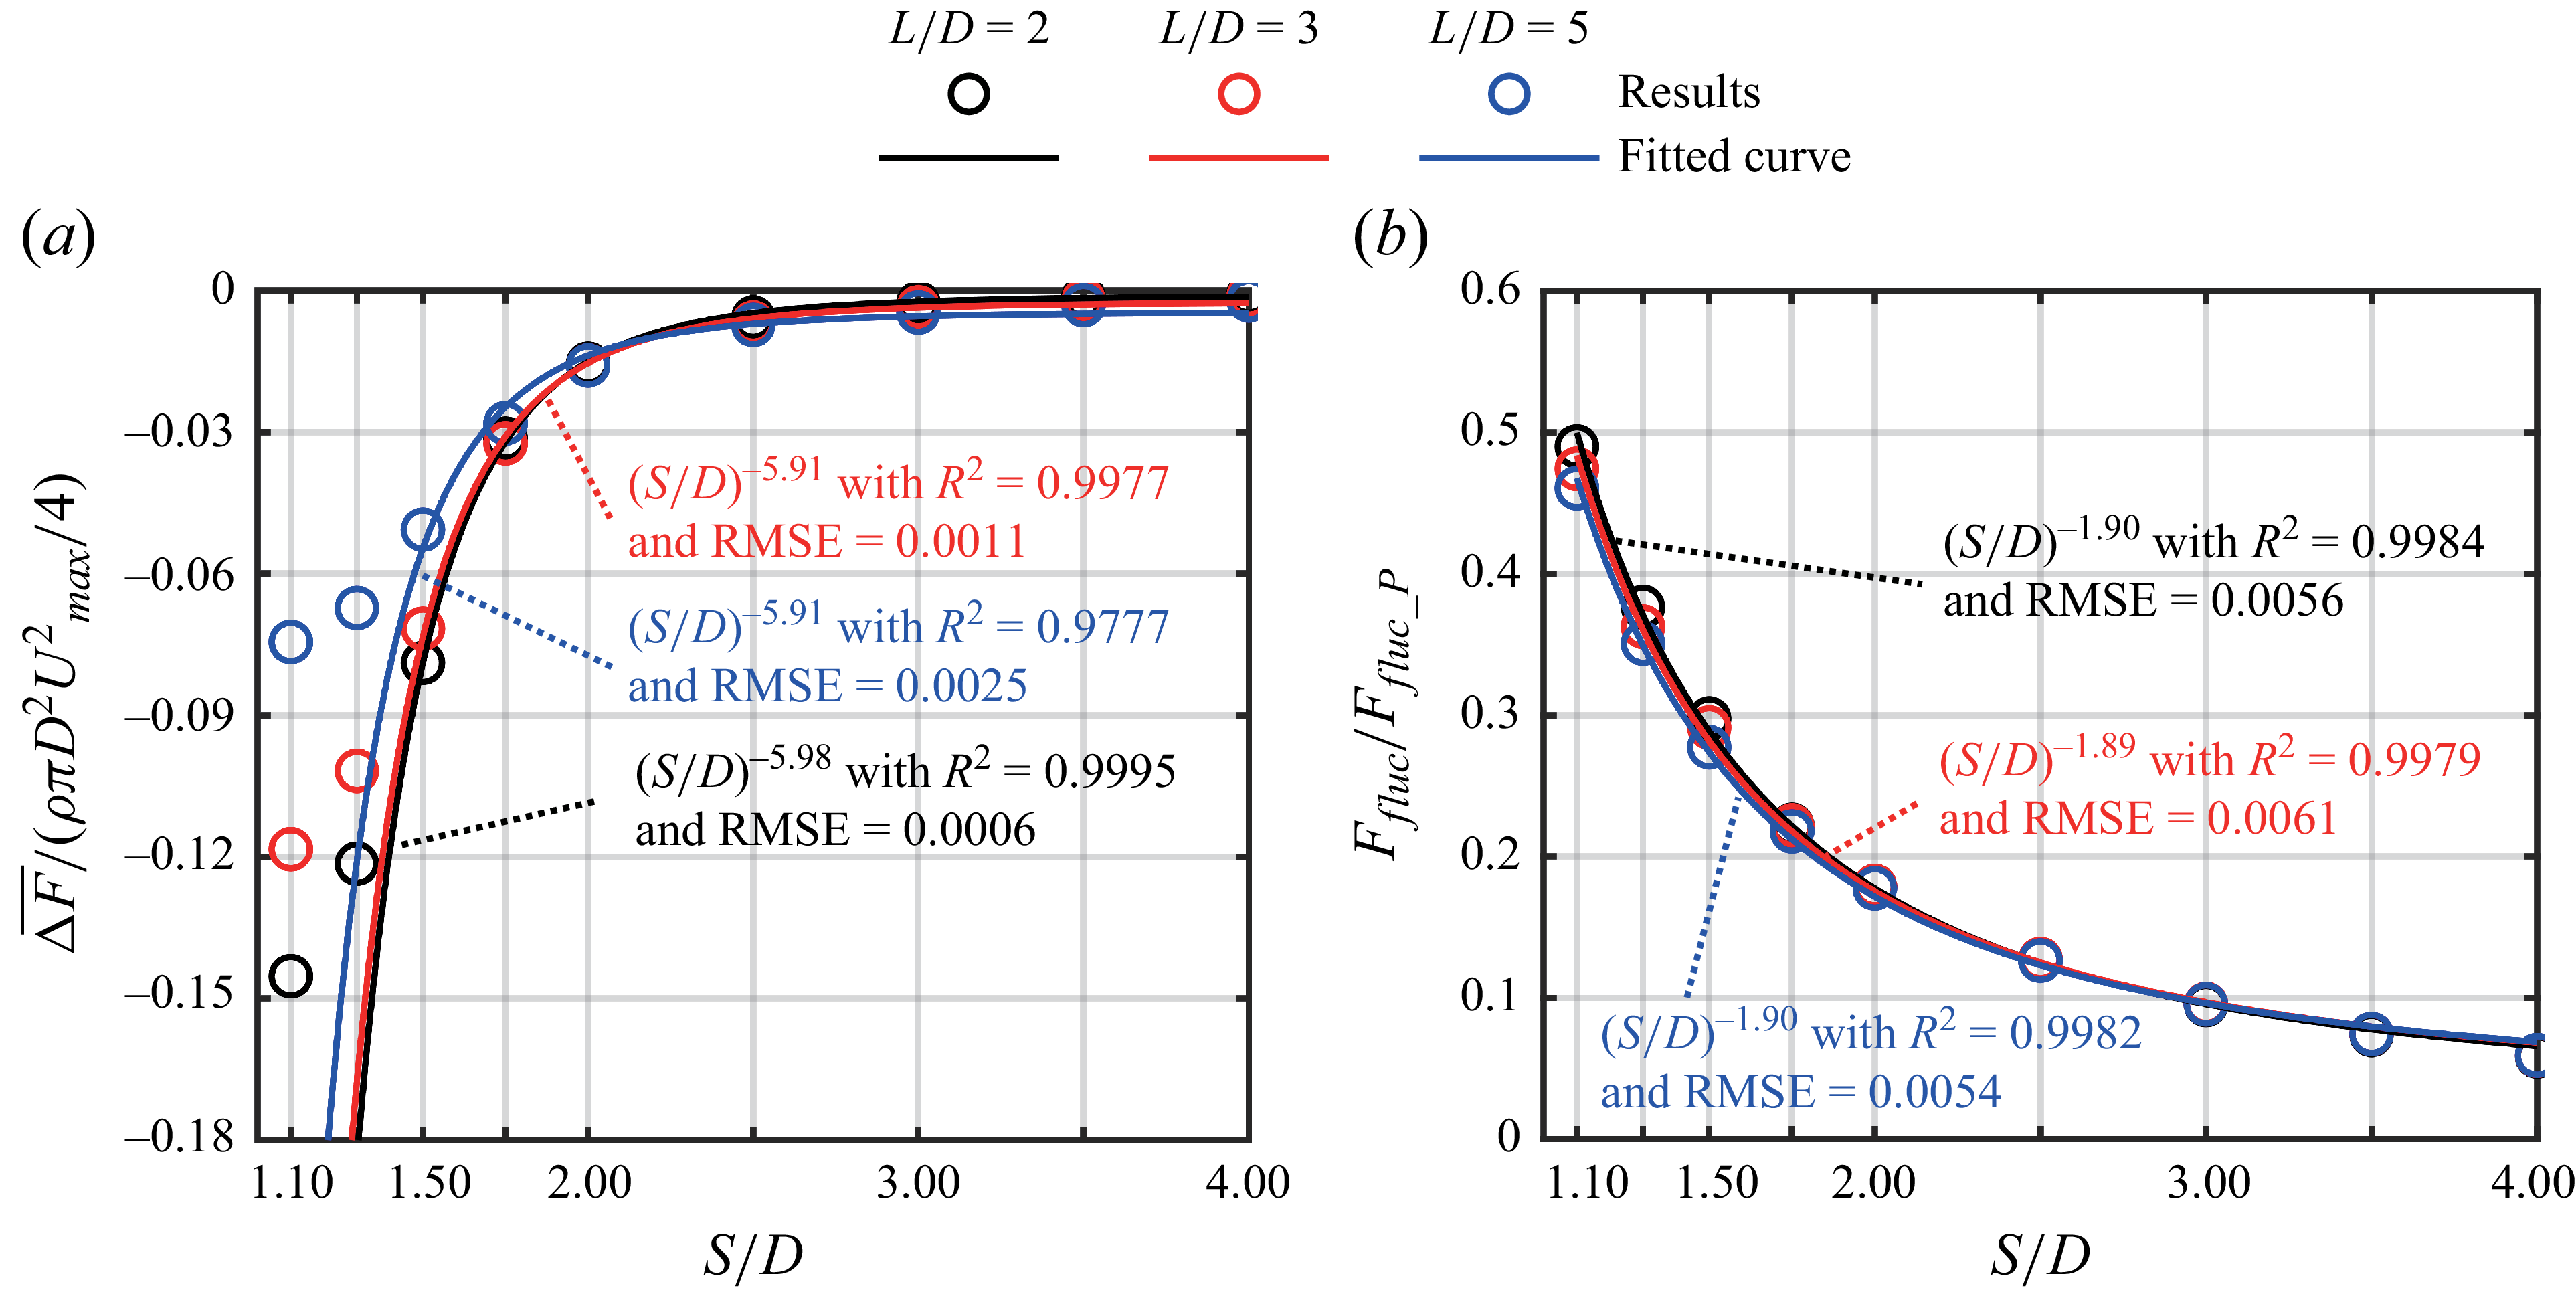
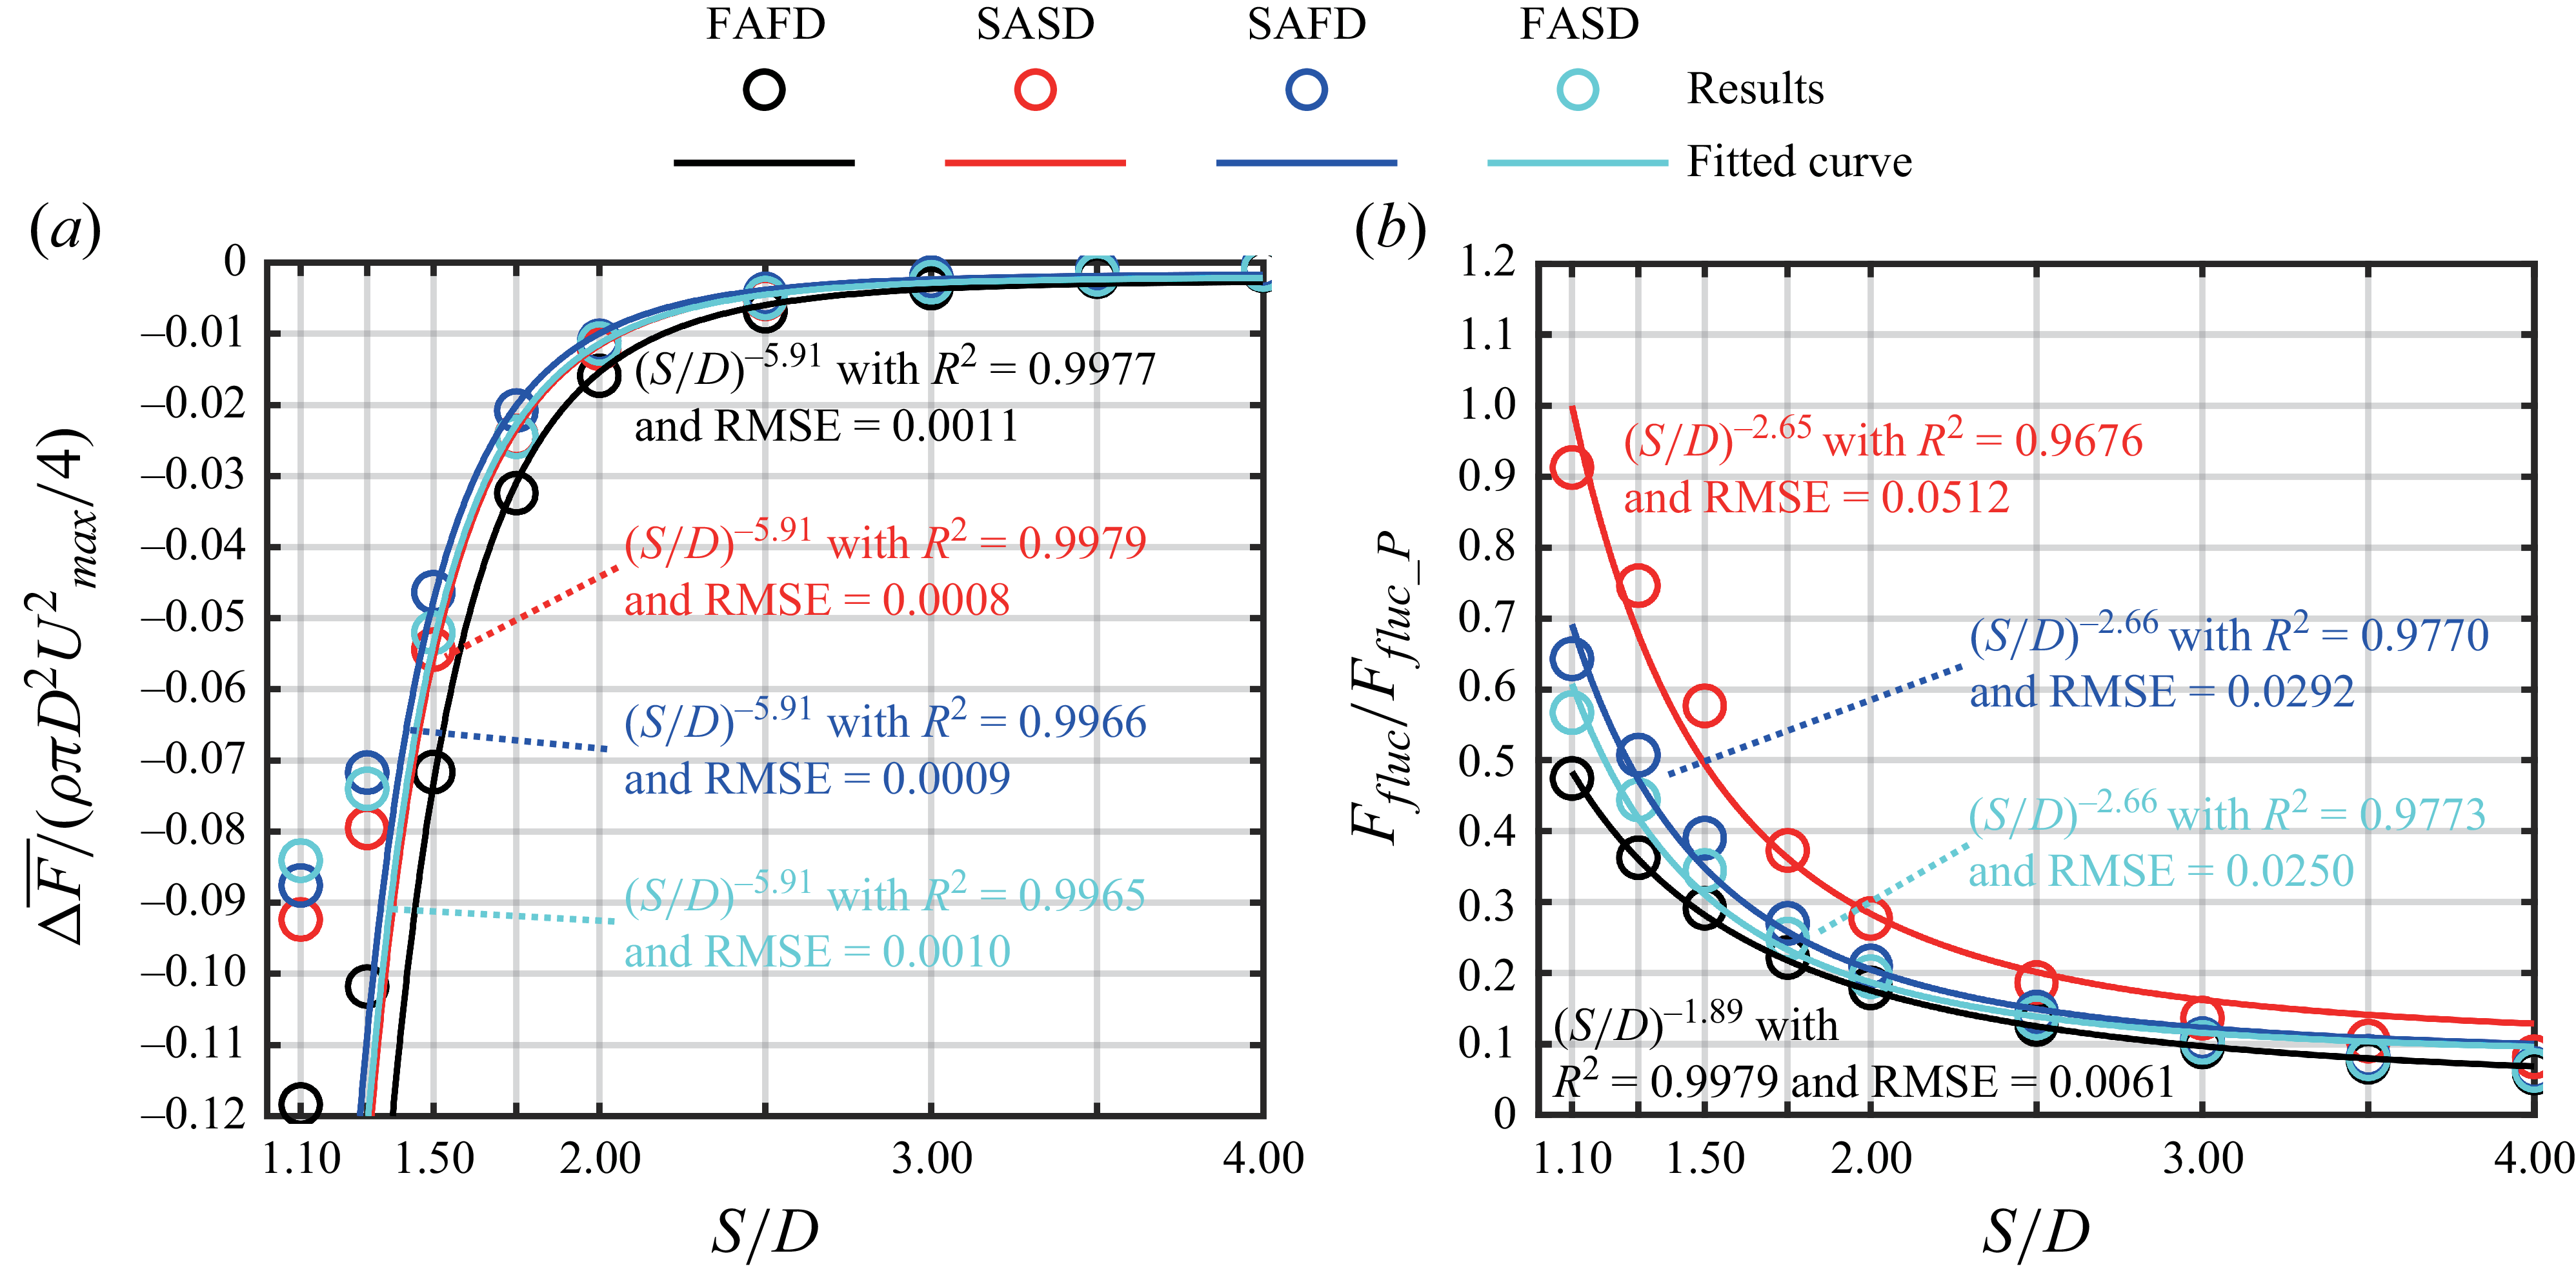
can be considered primarily governed by MIP. The time-averaged magnitudes of thrust difference
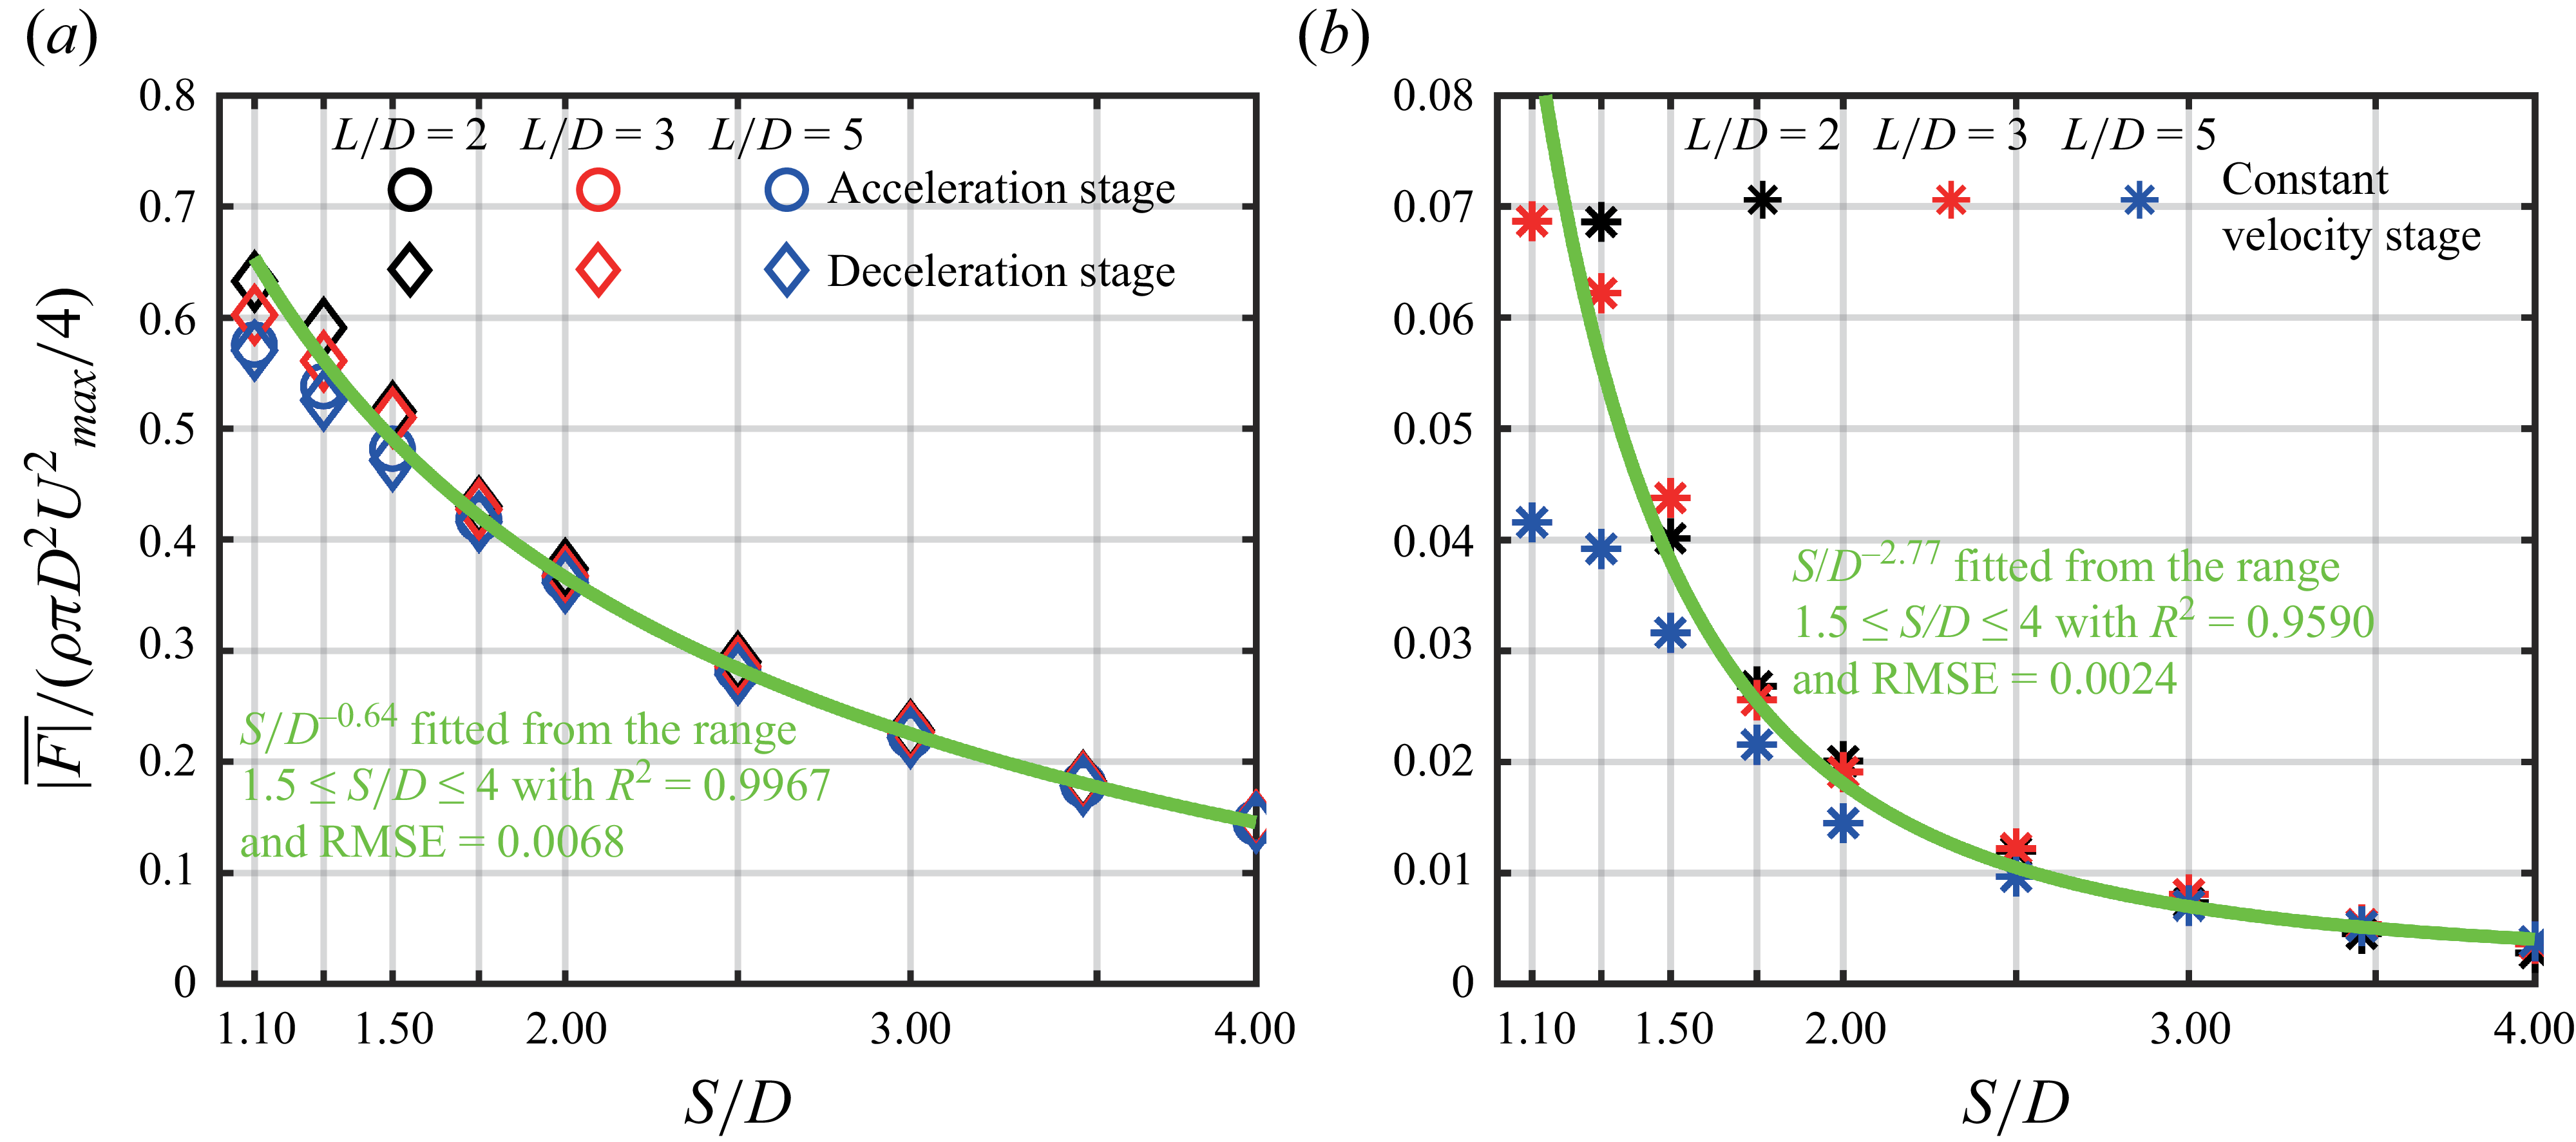
 $\overline {|\Delta F|}$
during the acceleration (deceleration) stage and the constant velocity stage are shown in figure 12 as a function of
 $S/D$
at different
 $L/D$
for cases with the FAFD velocity program. Here,
 $\overline {|\Delta F|}$
is calculated as follows:
 \begin{equation} \overline {|\Delta F|}=\dfrac {\int _{t_1}^{t_2}|\Delta F(t)|{\rm d}t}{t_2-t_1}, \end{equation}
where the integration interval extends from the initial time
 $t_1$
to the final time
 $t_2$
of each stage. In the three stages dominated by either MIP or CEVR (CEVR-R),
 $\overline {|\Delta F|}$
increases with decreasing
 $S/D$
, while variations in
 $L/D$
have little effect on
 $\overline {|\Delta F|}$
. The relationship between
 $\overline {|\Delta F|}$
and
 $S/D$
is fitted to a power-law function using the nonlinear least squares curve fitting method, with the results shown as green solid lines in figure 12. The fitted relationships indicate that
 $\overline {|\Delta F|}$
scales as
 $(S/D)^{-1.9}$
for stages dominated by MIP and as
 $(S/D)^{-5.91}$
for the stage dominated by CEVR. For the latter, only results corresponding to
 $1.5\leqslant S/D\leqslant 4$
are considered, since the 1st LVR and 2nd LVR undergo reconnection near the nozzle exits before propagating downstream, i.e. dominated by CEVR-R, as
 $S/D$
further decreases below 1.5. The transition from CEVR to CEVR-R produces a turning point in the trend of
 $\overline {|\Delta F|}$
, which increases rapidly with decreasing
 $S/D$
until
 $S/D = 1.5$
, but the rate of increase diminishes for
 $S/D \lt 1.5$
. To evaluate the quality and robustness of the scaling relationships, two statistical indicators,
 $R^2$
and
 $\textrm{RMSE}$
, are employed. Their values are annotated near the fitted curves in figure 12. The results show that
 $R^2\gt 0.98$
, indicating an almost perfect correlation, and
 $\textrm{RMSE}$
remains within
 $5\,\%$
of the overall magnitude range, confirming minimal fitting errors and high reliability of the scaling relationships. Furthermore, sensitivity analysis based on the scaling relationships indicates that the interaction dominated by CEVR is more significantly influenced by variations in
 $S/D$
than that dominated by MIP. Nevertheless,
 $\overline {|\Delta F|}$
corresponding to MIP remains approximately one order of magnitude greater than that associated with CEVR (CEVR-R).
Time-averaged magnitudes of thrust difference
 $\overline {|\Delta F|}$
as a function of
 $S/D$
at different
 $L/D$
, calculated during (a) the acceleration or deceleration stages dominated by the MIP, and (b) the constant velocity stage dominated by the coupling effects of vortex rings (CEVR or CEVR-R).

3.2.2. Modelling of mutually induced pressure
The effects of MIP can be regarded as the simple superposition of the pressure fields induced by the acceleration (deceleration) of two individual starting jets. The gauge pressure profiles along the radial direction
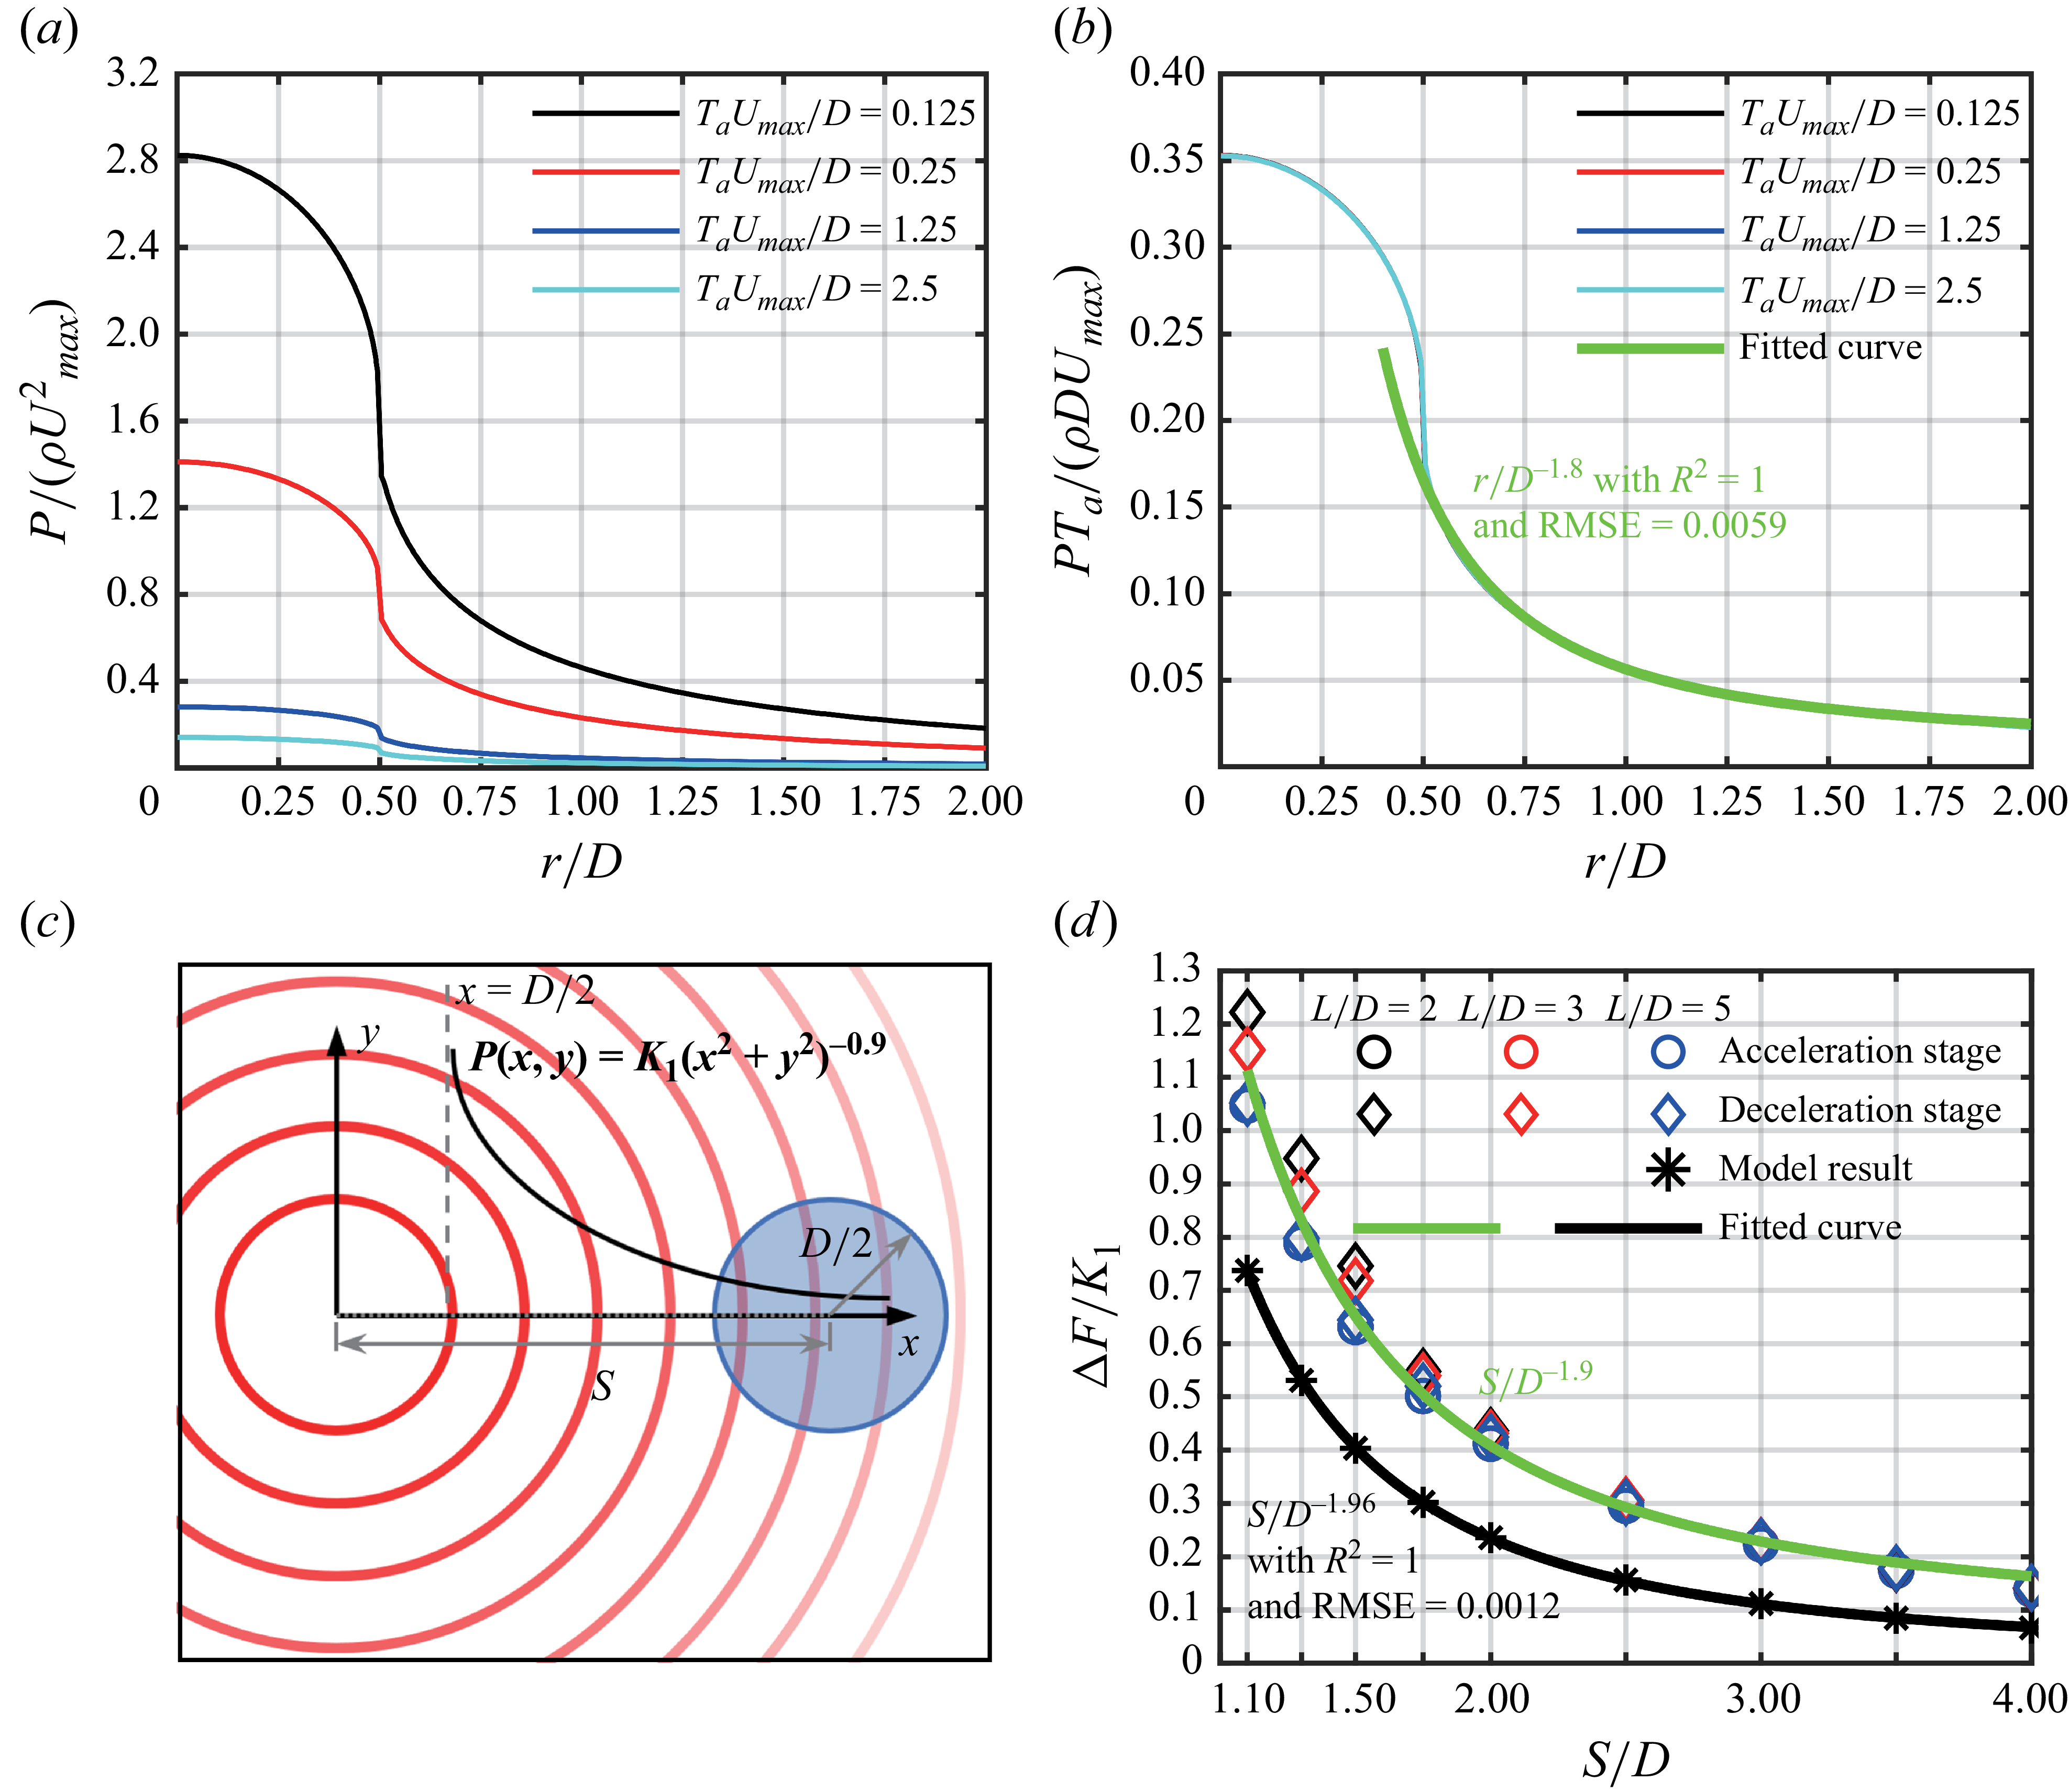
 $P(r)$
(the cylindrical coordinate system shown in figure 2) at the nozzle exit plane are shown in figure 13(a) for single starting jets with different durations of acceleration stage
 $T_aU_{\textit{max}}/D$
. Here,
 $P(r)$
is extracted at the initial instant of acceleration (
 $t^*=0.01$
) to avoid interference from the formation of the leading vortex ring, which could otherwise disturb the acceleration-induced pressure field. The acceleration of starting jet induces positive gauge pressure both inside the nozzle (
 $r/D\lt 0.5$
) and in the surrounding region outside the nozzle (
 $r/D\gt 0.5$
). For
 $r/D\gt 0.5$
,
 $P(r)$
decreases radially outward and gradually approaches 0. Furthermore,
 $P(r)$
increases as
 $T_aU_{\textit{max}}/D$
decreases (equivalent to increasing acceleration rate), consistent with the results reported by Gao et al. (Reference Gao, Wang, Yu and Chyu2020). The results of scaling
 $P(r)$
by
 $D/(T_aU_{\textit{max}})$
are shown in figure 13(b), where the profiles corresponding to different
 $T_aU_{\textit{max}}/D$
collapse into a single curve. Furthermore, a power-law function is fitted to the portion of
 $P(r)$
at
 $r/D\gt 0.5$
using the nonlinear least squares method, yielding
 $P(r)\sim (r/D)^{-1.8}$
. The corresponding statistical indicators confirm an excellent fitting quality, with
 $R^2=1$
and
 $\textrm{RMSE} =0.0059$
(approximately
 $1\,\%$
of the magnitude range).
(a,b) Profiles of gauge pressure along radial direction from the nozzle exit centre for single starting jets with different
 $T_aU_{\textit{max}}/D$
at
 $t^*=0.01$
; (c) schematic of the model describing the pressure field induced by one jet at another nozzle exit; (d) variation of
 $\Delta{\kern-1pt}F$
generated by MIP as a function of
 $S/D$
obtained from model, compared with the numerical results in figure 12(a).

In the region of
 $r/D\gt 0.5$
, the pressure induced by the acceleration (deceleration) of the starting jet can be modelled as a compact disk source field with a diameter of
 $D$
, coinciding with the nozzle exit (Krueger Reference Krueger2005). The axial velocity distribution within the nozzle exit
 $u(\boldsymbol {e},t)$
can be treated as the equivalent surface source density, i.e.
 \begin{equation} \sigma (\boldsymbol {e},t)=u(\boldsymbol {e},t), \end{equation}
where
 $\boldsymbol {e}$
is two-dimensional position vector of each point within the nozzle exit. Assuming that the flow outside the nozzle (
 $r/D\gt 0.5$
) is approximately irrotational, the velocity potential
 $\phi$
satisfies Laplace’s equation and can be expressed as a convolution of the Green’s function over the nozzle exit
 $E$
 \begin{equation} \phi (\boldsymbol {L},t)=\dfrac {1}{4\pi }\iint _E\dfrac {\sigma (\boldsymbol {e},t)}{\boldsymbol {L}-\boldsymbol {e}}{\rm d}E, \end{equation}
where
 $\boldsymbol {L}$
is two-dimensional position vector of the point outside the nozzle exit. Although the observation points in present work are located in the near-to-intermediate field (
 $0.5\lt r/D\leqslant 4$
), the potential can still be interpreted through a multipole-like expansion (Chwang & Wu Reference Chwang and Wu1975; Batchelor Reference Batchelor2000), which provides a rational framework for understanding the radial decay of the pressure
 \begin{equation} \phi (\boldsymbol {L},t)=\dfrac {1}{4\pi }\! \left[\dfrac {Q(t)}{r}+\dfrac {\boldsymbol {W}(t)\boldsymbol{\cdot }\boldsymbol {L}}{r^3}+\mathcal{O}\right]\!, \end{equation}
where
 $Q(t)=\iint _E\!\sigma {\rm d}E$
represents the monopole contribution,
 $W(t)=\iint _E\sigma \boldsymbol {e} {\rm d}E$
denotes the dipole strength and
 $\mathcal{O}$
corresponds to the higher-order terms. The monopole term represents the unsteady volume flux associated with the acceleration and deceleration of jets. The dipole term reflects the non-uniform momentum distribution within the nozzle exit (Krieg & Mohseni Reference Krieg and Mohseni2013). As for the higher-order terms, they represent finer flow structures and vorticity dynamics that are primarily confined to the near field. In the present work, their influence within the region of
 $0.5\lt r/D\leqslant 4$
is negligible and can be reasonably omitted from the analysis, as any residual contribution would only slightly alter the effective radial decay exponent of
 $P(r)$
. The magnitude of
 $\boldsymbol {L}$
corresponds exactly to the radial distance to the nozzle exit centre, i.e.
 $|\boldsymbol {L}|=r$
. The unsteady pressure induced by the acceleration (deceleration) of the starting jet can then be obtained from the linearised Bernoulli relation (Ryhming Reference Ryhming1973), as follows:
 \begin{equation} P(r,t)=-\rho \dfrac {\partial \phi }{\partial t}. \end{equation}
Introducing (3.12), (3.13) can be rewritten as
 \begin{equation} P(r,t)=-\dfrac {\rho }{4\pi }\! \left[\dfrac {\dot {Q}(t)}{r}+\dfrac {\dot {\boldsymbol {W}}(t)\boldsymbol{\cdot }\boldsymbol {L}}{r^3} \right]\!. \end{equation}
This provides a theoretical basis for the observed radial decay of the gauge pressure, i.e.
 $P(r)\sim (r/D)^{-1.8}$
, which falls between the asymptotic behaviours expected for monopole (
 $r^{-1}$
) and dipole (
 $r^{-2}$
) source fields. The actual pressure field reflects a combined contribution from both modes, rather than being governed by a single idealised source type.
Therefore, taking the nozzle exit centre as the origin, the induced pressure field outside the nozzle generated by acceleration can be expressed in a two-dimensional Cartesian coordinate system as
 \begin{equation} P(x,y)=\dfrac {K_1}{(x^2+y^2)^{0.9}}. \end{equation}
This equation is applicable to the region of
 $x^2+y^2\gt D^2/4$
, as schematically illustrated in figure 13(c). Here,
 $K_1$
is related to
 $T_aU_{\textit{max}}/D$
based on the scaling relationship from figure 13(a) to figure 13(b), i.e.
 \begin{equation} K_1=\dfrac {K_2}{T_aU_{\textit{max}}/D}, \end{equation}
where
 $K_2$
can be considered as a constant. The final effect corresponds to the superposition of the additional pressure field at the location of the other nozzle exit, which is positioned at a distance
 $S$
from the nozzle exit centre, as schematically indicated by the blue circle in figure 13(c). Therefore,
 $\Delta{\kern-1pt}F$
generated by MIP on another starting jet can be expressed similarly to (3.6) as
 \begin{equation} \Delta F=K_1\iint _E\dfrac {1}{(x^2+y^2)^{0.9}}{\rm d}E. \end{equation}
The above equation is integrated over the area of the other nozzle exit, i.e. the blue circle. The centre of this nozzle exit lies on the
 $x$
-axis, and the integration region can be expressed as
 \begin{equation} (x-S)^2+y^2\leqslant D^2/4. \end{equation}
The relationship between
 $\Delta{\kern-1pt}F$
and
 $S/D$
, obtained from the numerical integration, is shown as black stars in figure 13(d). The results shown in figure 12(a) are also included in figure 13(d) without scaling. The scaling relationship between
 $\Delta{\kern-1pt}F$
and
 $S/D$
predicted by the model is consistent with that obtained from numerical results. A power-law function, fitted using the nonlinear least squares curve fitting method, is applied to these discrete results from the model, yielding
 $\Delta F\sim (S/D)^{-1.96}$
(the black line in figure 13
d). This is close to
 $\overline {|\Delta F|}\sim (S/D)^{-1.9}$
obtained directly from the pressure field of twin-starting jets during the acceleration (deceleration) stage. Equation (3.16) defining
 $K_1$
needs to be modified when applying the model to the deceleration stage dominated by MIP. The denominator on the right-hand side of (3.16) should be replaced by
 $T_dU_{\textit{max}}/D$
, and
 $K_2$
should take the opposite sign.
3.2.3. Coupling effects of vortex rings
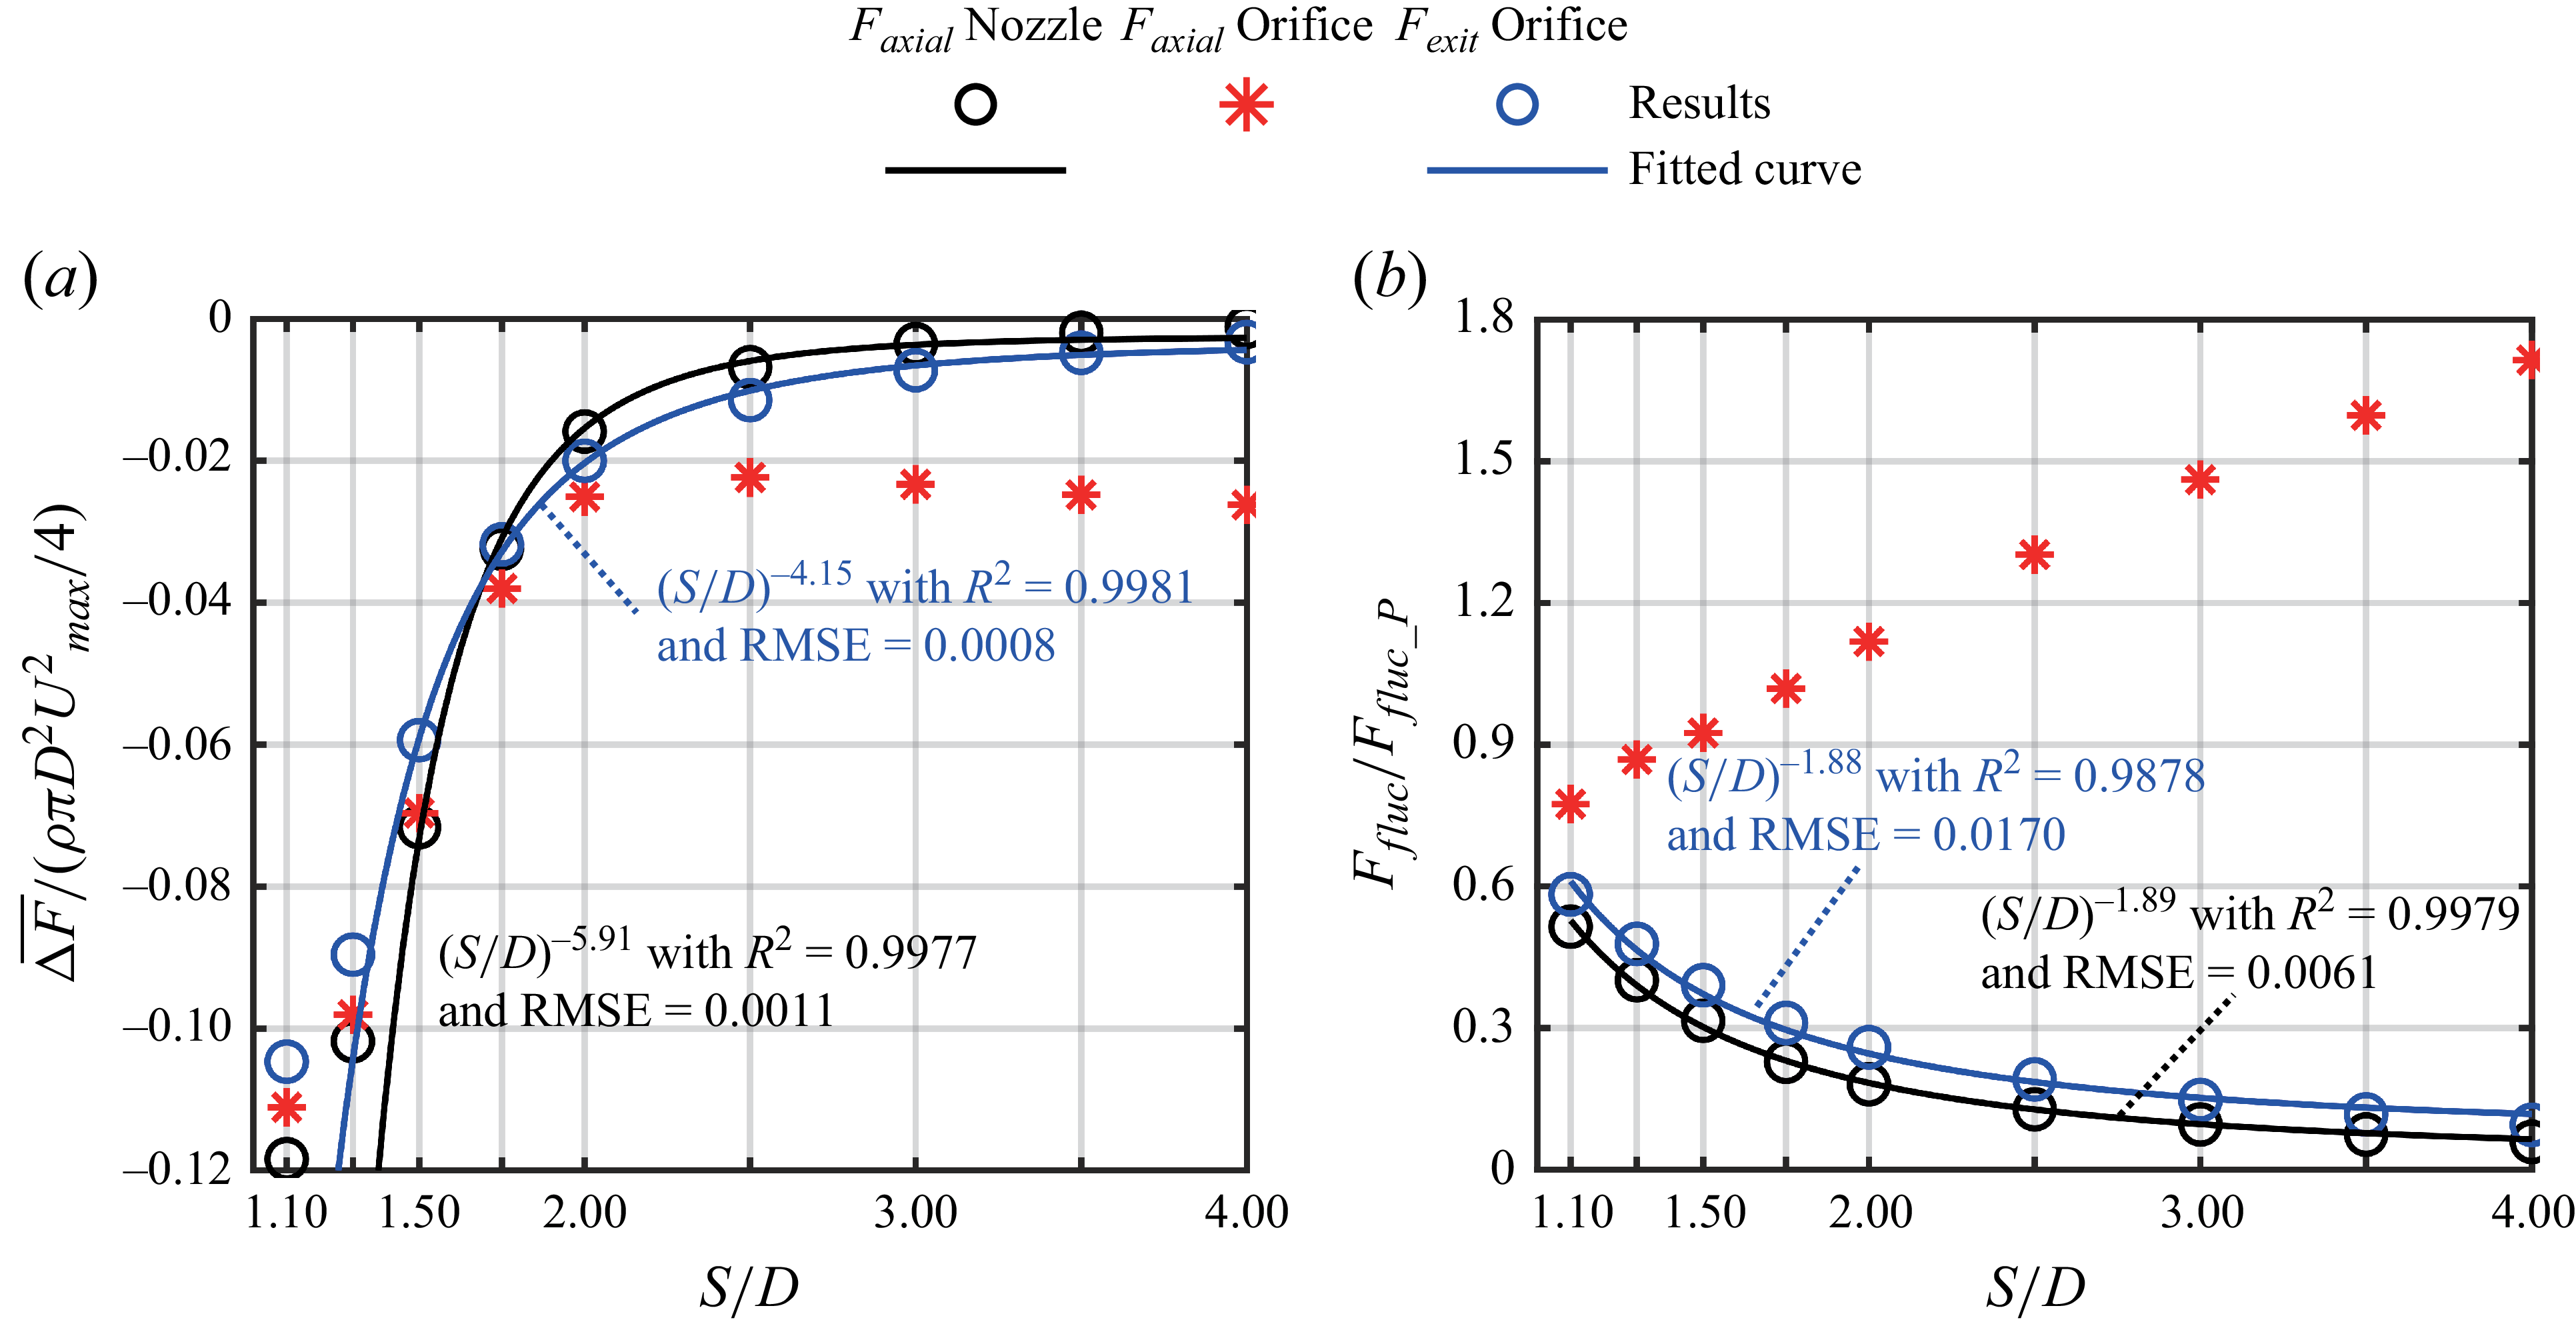
Within the coupling effects of vortex rings, the primary contribution originates from the interaction between the 1st LVR and 2nd LVR, while the stopping vortex rings come into play only after the termination of the starting jets. The average thrust reduction caused by the interaction between the 1st LVR and 2nd LVR without reconnection has been modelled by Athanassiadis & Hart (Reference Athanassiadis and Hart2016). The influence of interaction on thrust is mainly reflected in the component
 ${F}_{L{\textit 1}\_P}$
. From (3.6),
 $\Delta{\kern-1pt}F$
induced by CEVR can be expressed as
 \begin{equation} \Delta F \sim P_\textit{ind}, \end{equation}
where
 $P_\textit{ind}$
denotes the negative gauge pressure induced by the neighbouring starting jet under CEVR. It is related to the induced velocity from the vortex ring of the neighbouring starting jet, that is,
 \begin{equation} P_\textit{ind} \sim \rho u^2_\textit{ind}. \end{equation}
Athanassiadis (Reference Athanassiadis2016) derived that the velocity induced by a toroidal vortex ring scales as
 $u_\textit{ind}\sim r^{-3}_\textit{ind}$
, where
 $r_\textit{ind}$
is the distance from the field point to the centre of the vortex ring. In the present work, it can be approximated by the spacing between the axes of the two starting jets, i.e.
 $r_\textit{ind}\sim S$
. Therefore, the scaling relationship for CEVR can be expressed as
 \begin{equation} \Delta F \sim (S/D)^{-6}. \end{equation}
This is close to the scaling relationship of
 $\overline {|\Delta F|} \sim (S/D)^{-5.91}$
for the stage dominated by CEVR in the range of
 $1.5\leqslant S/D\leqslant 4$
mentioned above.
As
 $S/D$
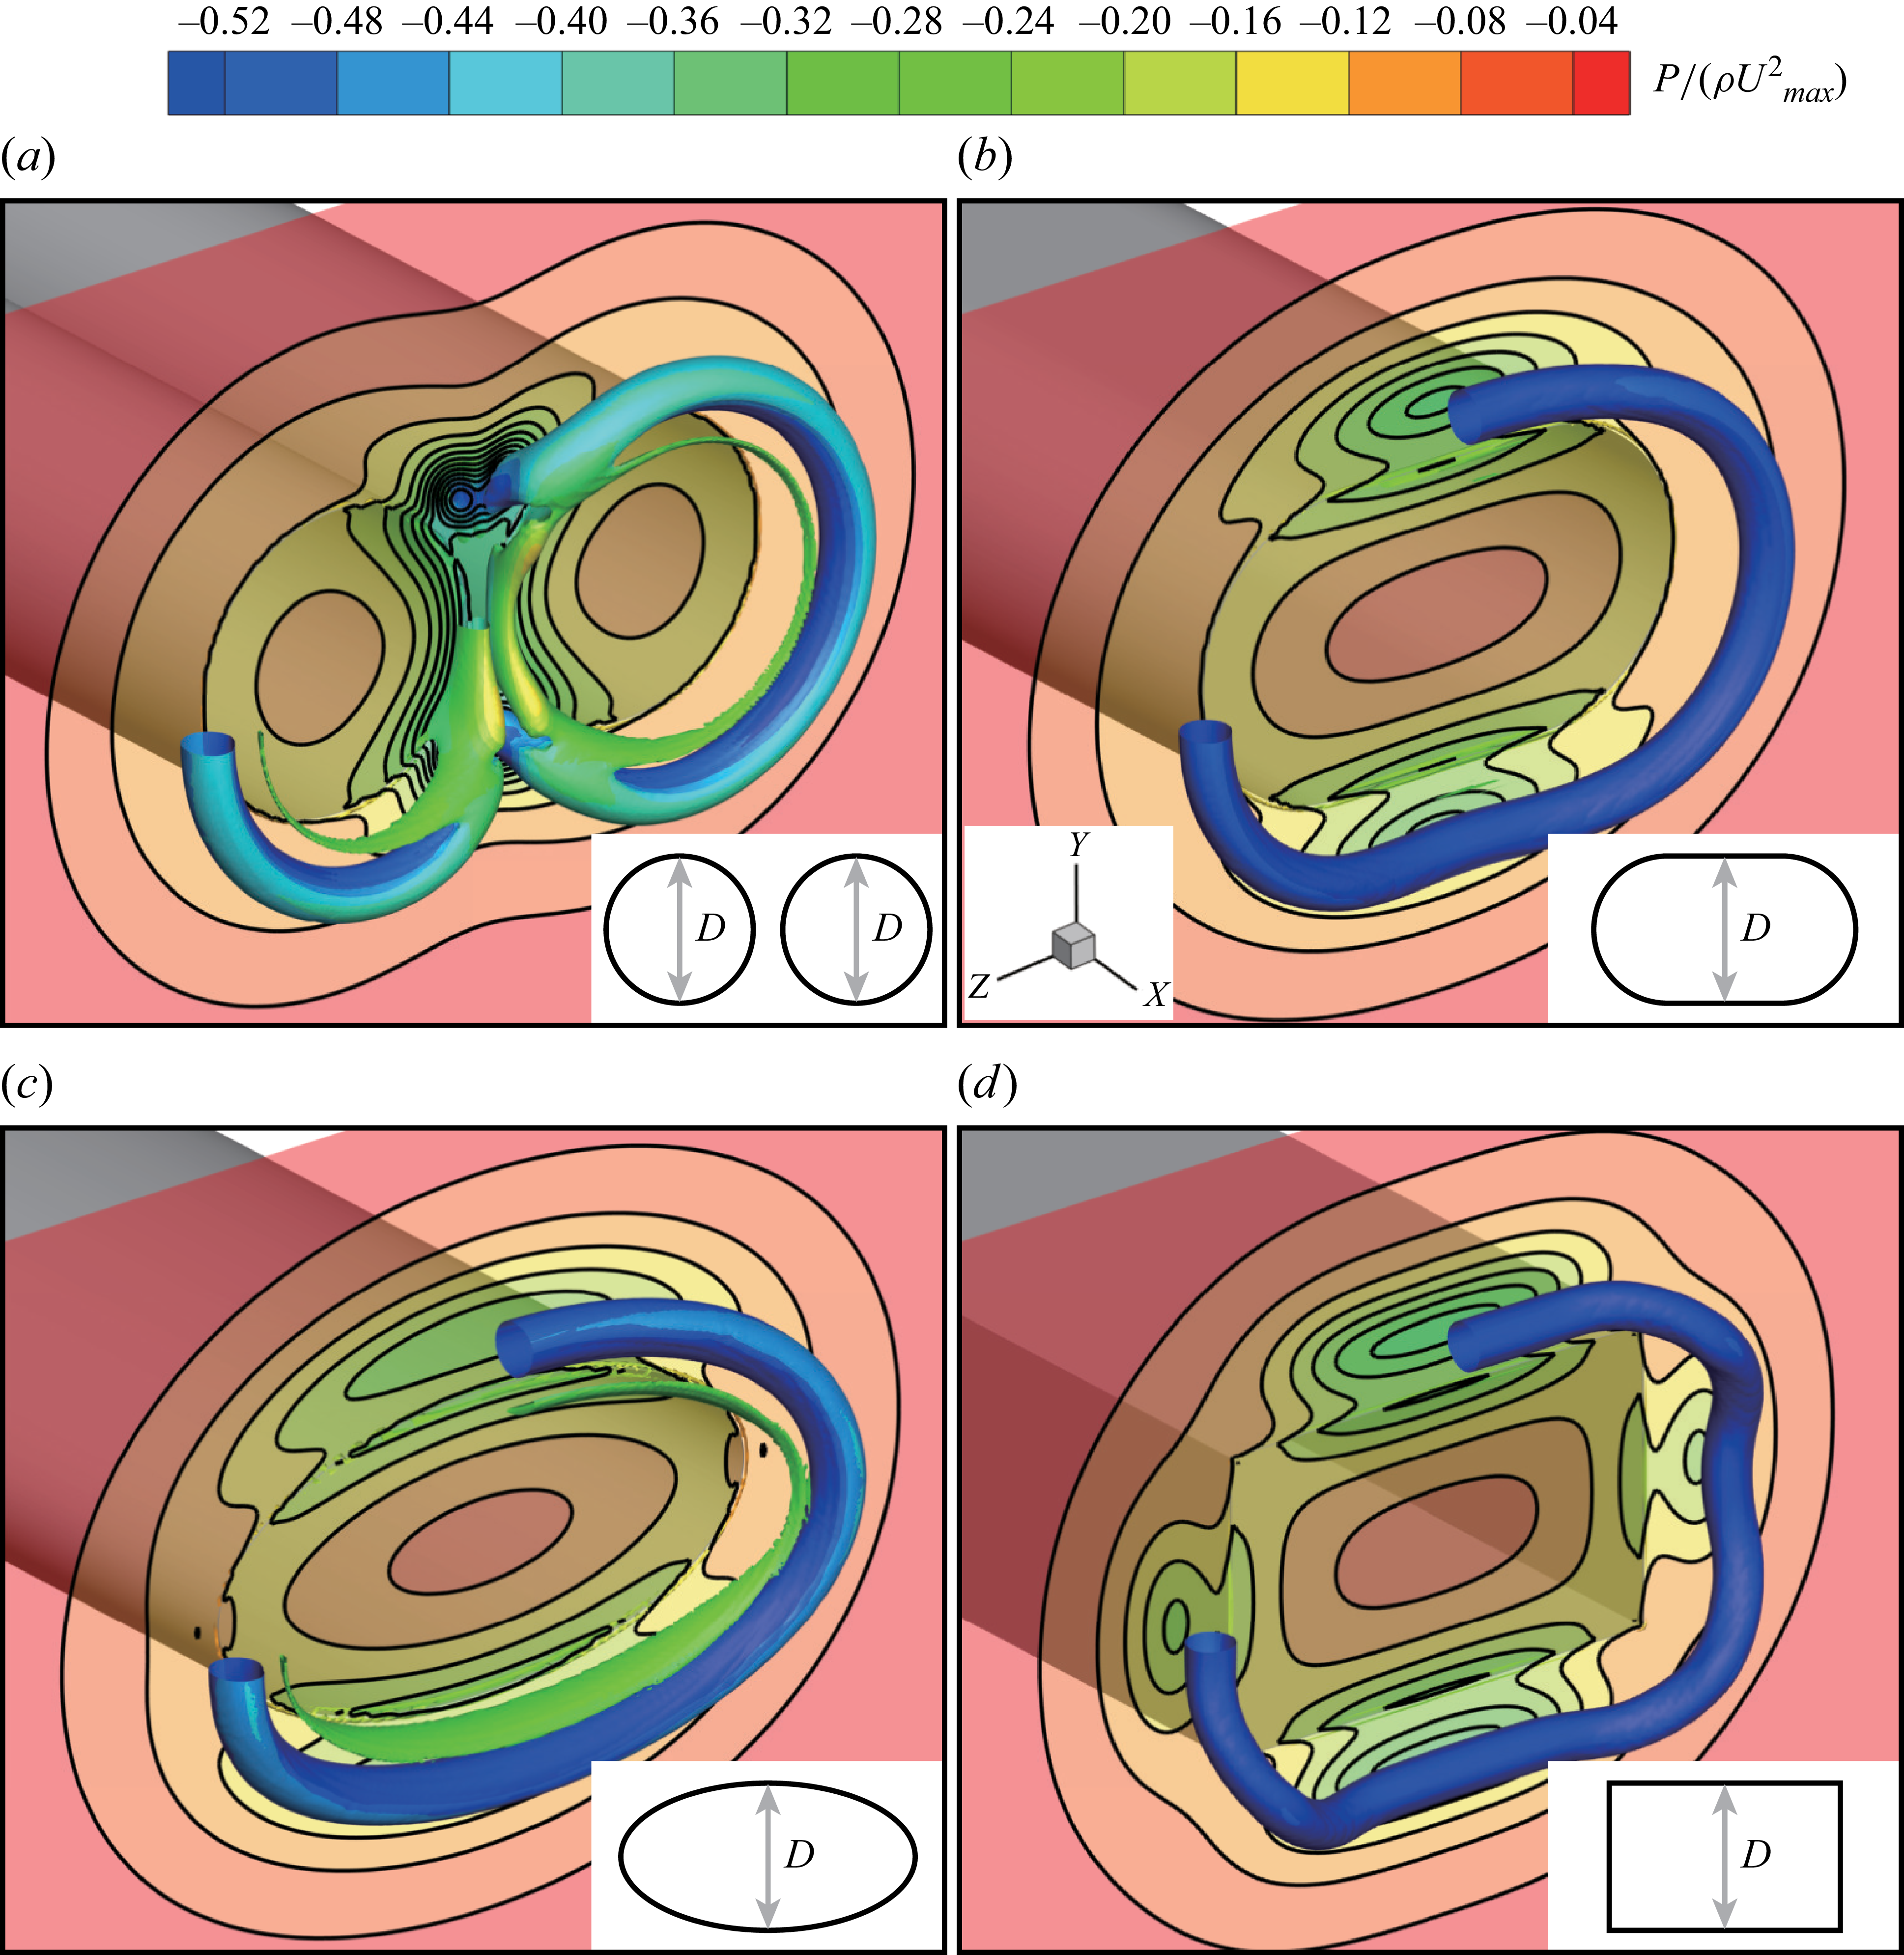
decreases further below 1.5, the scaling relationship breaks down due to the reconnection of the 1st LVR and 2nd LVR near the nozzle exits, and the influence mechanism of vortex ring interaction on thrust generation transitions from CEVR to CEVR-R. The two vortex rings merge into a single ring, whose geometry deviates from circular to elliptical (recall figure 6). To further elucidate the influence of CEVR-R with vortex ring reconnection, three nozzle configurations are considered for generating the starting jets. They are the slender orifice nozzle (Domenichini Reference Domenichini2011), elliptical orifice nozzle (O’Farrell & Dabiri Reference Farrell and Dabiri2014; Shi, Feng & Wang Reference Shi, Feng and Wang2019) and rectangular orifice nozzle (Zheng, Gao & Yu Reference Zheng, Gao and Yu2023). The cross-sectional areas of all three nozzle exits are set equal to twice that of a circular nozzle with diameter
 $D$
, thereby ensuring the same mass flow rate with the twin-starting jets under an identical velocity program. In the Cartesian coordinate system, the nozzle exits lie in the
 $Y{-}Z$
plane, with their widths along the
 $Y$
-axis smaller than and equal to
 $D$
(figure 14). The three-dimensional vortical structures coloured by gauge pressure, along with the corresponding pressure contours at the nozzle exit, are shown in figure 14. For twin-starting jets with reconnected vortex rings, the residual pair of vortical structures between the reconnecting vortex tubes induces low-pressure regions at the nozzle exits (figure 14
a). This can be regarded as the residual interaction of the 1st LVR and 2nd LVR, as the vortex pairing maintains strong mutual induction of velocity fields. With decreasing
 $S/D$
, the proximity of the two jets enhances their interaction, thereby enhancing the induced low-pressure effect. However, the reduced spacing simultaneously imposes spatial confinement, which limits the growth of the vortical structures. Consequently, a turning point appears at
 $S/D=1.5$
in the trend of
 $\overline {|\Delta F|}$
during the constant velocity stage, corresponding to the transition from CEVR to CEVR-R. The deviation of the vortex ring from circular after reconnection further weakens thrust generation. In such cases, parts of the vortex ring are unable to acquire sufficient induced velocity to move away from the nozzle exits, thereby inducing low-pressure regions at the nozzle exits for a longer duration (Domenichini Reference Domenichini2011). This can be clearly seen in similar vortex rings generated by the slender, elliptical and rectangular orifice nozzles, as shown from figure 14(b) to figure 14(d). For the slender and elliptical orifice nozzles, the upper and lower portions of the vortex ring, where the curvature is smaller, move away from the nozzle exit more slowly (Domenichini Reference Domenichini2011; O’Farrell & Dabiri Reference Farrell and Dabiri2014) and induce lower pressure at the nozzle exit. Similarly, the vortex ring generated by the rectangular orifice nozzle exhibits the same behaviour at the corresponding portions of its four sides.
Contours of gauge pressure on the three-dimensional vortical structures identified by the normalised
 $Q$
-criterion (iso-surface at
 $Q=0.02$
) and on the nozzle exit plane (
 $X/D=0$
) at
 $t^*=0.938$
: (a) twin-starting jets in case 11 (
 $S/D=1.1$
and
 $L/D=3$
); single starting jets with the same velocity program and mass flux as case 11 discharged from (b) slender, (c) elliptical and (d) rectangular orifice nozzles.

The values of
 $\Delta{\kern-1pt}F$
calculated by (3.8) for the total axial thrust
 $F_{\textit{axial}}$
and its three components are shown in figure 15 for these four configurations. From twin-starting jets to single starting jets generated by the non-circular nozzles, the magnitude of
 $\Delta{\kern-1pt}F$
for
 $F_{\textit{axial}}$
increases significantly during the acceleration and deceleration stages, but remains approximately unchanged during the constant velocity stage (figure 15
a). This originates from the contributions of
 ${F}_{L{\textit 1}\_P}$
and
 $F_{L1\_U}$
, while the variation in
 $\Delta{\kern-1pt}F$
for
 $F_{L2\_X}$
is nearly one order of magnitude smaller (figure 15
d). The magnitude increase of
 $\Delta{\kern-1pt}F$
during the acceleration and deceleration stages is entirely contributed by
 $\Delta{\kern-1pt}F$
for
 ${F}_{L{\textit 1}\_P}$
(figure 15
b). From the twin-starting jets with
 $S/D=1.1$
to the single starting jets generated by merging two nozzles into slender, elliptical and rectangular orifice nozzles, the effect of MIP increases to its maximum. During the constant velocity stage,
 $\Delta{\kern-1pt}F$
for
 $F_{\textit{axial}}$
behaves approximately the same as the nozzle geometry transitions. However, this results from the opposing contributions of
 $\Delta{\kern-1pt}F$
for
 ${F}_{L{\textit 1}\_P}$
and
 $F_{L1\_U}$
, as shown in figure 15(b) and 15(c). The magnitude of negative
 $\Delta{\kern-1pt}F$
for
 ${F}_{L{\textit 1}\_P}$
decreases by approximately half, while
 $\Delta{\kern-1pt}F$
for
 $F_{L1\_U}$
, which is nearly zero for twin-starting jets, becomes negative with a non-negligible magnitude. The latter may be attributed to the reduced wall perimeter from merging two circular nozzles into one nozzle under the same cross-sectional area. Therefore, the region available for boundary-layer development decreases, which in turn weakens the acceleration within the jet core (Krieg & Mohseni Reference Krieg and Mohseni2013; Schlueter-Kuck & Dabiri Reference Schlueter-Kuck and Dabiri2016). The reduction in the magnitude of negative
 $\Delta{\kern-1pt}F$
for
 ${F}_{L{\textit 1}\_P}$
can be attributed to the absence of the residual pair of vortical structures between the reconnecting vortex tubes in the single non-circular nozzles. The remaining negative
 $\Delta{\kern-1pt}F$
for
 ${F}_{L{\textit 1}\_P}$
only results from the vortex ring deviating from circular, which prevents some portions of it from moving away from the nozzle exit rapidly. This also reflects the influence of the 1st LVR and 2nd LVR after reconnection, i.e. CEVR-R.
Development of the thrust difference
 $\Delta{\kern-1pt}F$
, including (a) total axial thrust
 $F_{\textit{axial}}$
and its components: (b)
 ${F}_{L{\textit 1}\_P}$
, (c)
 $F_{L1\_U}$
and (d)
 $F_{L2\_X}$
, for twin-starting jets in case 11 (
 $S/D=1.1$
and
 $L/D=3$
) and for single starting jets with identical velocity program and mass flux discharged from slender, elliptical and rectangular orifice nozzles.

3.2.4. Propulsive characteristics of twin-starting jets
The force requirements for a starting jet can be categorised into two aspects. The first is to provide sufficient thrust to achieve motion (Krueger & Gharib Reference Krueger and Gharib2003). The second is to deliver the precise force for accurate position control and manoeuvrability (Athanassiadis Reference Athanassiadis2016). Undoubtedly, the thrust difference
 $\Delta{\kern-1pt}F$
induced by the interaction between twin-starting jets affects both aspects. This reduces the generation of average thrust and introduces additional fluctuations into the thrust development process. Two parameters are therefore defined to quantitatively evaluate these effects. First,
 $\Delta F(t)$
is time averaged to quantify the influence of interaction on the average thrust, i.e. the time-averaged thrust difference
 $\overline {\Delta F}$
 \begin{equation} \overline {\Delta F}=\dfrac {\int _0^t\Delta F(t)\, {\rm d}t}{t}. \end{equation}
Negative
 $\overline {\Delta F}$
indicates a reduction in the average thrust, and vice versa. Second, the fluctuations introduced by the interaction into the thrust development process are quantified as
 $F_\textit{fluc}$
 \begin{equation} F_\textit{fluc}=\sqrt {\dfrac {\int _0^t[\Delta F(t)-\overline {\Delta F}]^2\, {\rm d}t}{t}}. \end{equation}
Here,
 $\overline {\Delta F}$
is subtracted from
 $\Delta F(t)$
before calculating
 $F_\textit{fluc}$
to properly quantify fluctuations. For precise position control and manoeuvrability, a smooth thrust profile is required. However, during the acceleration and deceleration stages of single starting jets, transient overshoots and undershoots occur in the generated force due to the generation of pressure thrust component
 ${F}_{L{\textit 1}\_P}$
(Gao et al. Reference Gao, Wang, Yu and Chyu2020; Zhang, Wang & Wan Reference Zhang, Wang and Wan2020). The interaction between twin-starting jets further amplifies these unfavourable fluctuations, which are quantified by the parameter of
 $F_\textit{fluc}$
. Such amplified unsteady behaviour increases the demands on the control system of the vehicle, potentially complicating trajectory tracking and precise manoeuvring in underwater applications. The calculation of
 $F_\textit{fluc}$
and the generation of
 ${F}_{L{\textit 1}\_P}$
depend on the velocity program. In order to evaluate the fluctuations induced by the interaction independently of the velocity program,
 $F_\textit{fluc}$
is normalised by
 $F_{fluc\_P}$
, which is calculated from (3.23) using
 ${F}_{L{\textit 1}\_P}$
in place of
 $(\Delta F(t)-\overline {\Delta F})$
. The corresponding
 ${F}_{L{\textit 1}\_P}$
is generated by the single starting jet with the same velocity program.
Equations (3.22) and (3.23) are calculated over the entire duration of twin-starting jets, extending beyond jet termination until
 $\Delta F(t)$
becomes unnoticeable. The variations of
 $\overline {\Delta F}$
and
 $F_\textit{fluc}$
with
 $S/D$
at different
 $L/D$
are shown in figure 16, along with the fitted curves. It can be seen from figure 16(a) that the variations of
 $\overline {\Delta F}$
within
 $1.5\leqslant S/D \leqslant 4$
at each
 $L/D$
are close to
 $\overline {|\Delta F|}\sim (S/D)^{-5.91}$
obtained earlier in figure 12(b), and their magnitudes are also comparable. Meanwhile, as
 $S/D$
further decreases below 1.5, the negative
 $\overline {\Delta F}$
exhibits a turning point with the reconnection between the 1st LVR and 2nd LVR, corresponding to the transition from CEVR to CEVR-R. This indicates that the influence of interaction on the average thrust is primarily governed by CEVR and CEVR-R, while the contribution from MIP tends to cancel out between the acceleration and deceleration stages. This relationship is also consistent with the estimation by Athanassiadis (Reference Athanassiadis2016), i.e.
 $\overline {\Delta F}\sim (S/D)^{-6}$
. As for the influence of
 $L/D$
, it can be observed that, for
 $S/D\gt 1.5$
, the magnitude of
 $\overline {\Delta F}$
shows negligible dependence on
 $L/D$
. This is because the 1st LVR and 2nd LVR continue to grow as
 $L/D$
increases. Therefore,
 $\Delta{\kern-1pt}F$
induced by CEVR can maintain a comparable time-averaged value even as the jet duration is extended. However, this breaks down as
 $S/D$
decreases below 1.5, as the reconnection prematurely interrupts the growth of leading vortex rings. The magnitude of
 $\overline {\Delta F}$
decreases almost linearly with increasing
 $L/D$
, indicating that a larger
 $L/D$
cannot enhance the influence of CEVR-R. Instead, it only extends the jet duration, which ultimately reduces the time-averaged value of
 $\Delta{\kern-1pt}F$
, i.e.
 $\overline {\Delta F}$
.
Shifting attention to
 $F_\textit{fluc}$
, it can be seen from figure 16(b) that its variation with
 $S/D$
at each
 $L/D$
approximately follows a power-law scaling of
 $F_\textit{fluc}\sim (S/D)^{-2}$
. Specifically, the fitted exponents are
 $-1.90$
,
 $-1.89$
and
 $-1.90$
with increasing
 $L/D$
, respectively. This scaling relationship is consistent with the trend observed for
 $\overline {|\Delta F|}$
during the acceleration and deceleration stages, i.e.
 $\overline {|\Delta F|}\sim (S/D)^{-1.9}$
(recall figure 12
a). This suggests that, for the FAFD velocity program,
 $F_\textit{fluc}$
induced by the interaction is mainly governed by MIP. Since
 $F_\textit{fluc}$
is defined as the root mean square of
 $\Delta F(t)$
after subtracting
 $\overline {\Delta F}$
, its magnitude is inherently affected by the jet duration through the time-averaging process. However, once normalised by
 $F_{fluc\_P}$
, the variation of
 $F_\textit{fluc}$
with
 $S/D$
remains consistent across different
 $L/D$
, indicating independence from the jet duration.
(a) Time-averaged thrust difference
 $\overline {\Delta F}$
and (b) overall thrust fluctuation
 $F_\textit{fluc}$
in the twin-starting jets with different
 $S/D$
and
 $L/D$
, including fitted curves derived from numerical results using the nonlinear least squares curve fitting method.

With the inclusion of industry-standard metrics, the influence of twin-starting jet interactions on the specific impulse
 $I_\textit{sp}$
is shown in figure 17, where
 $I_\textit{sp}$
is consistently normalised by the maximum jet velocity
 $U_{\textit{max}}$
. The most fundamental definition of
 $I_\textit{sp}$
is adopted, which is the ratio of the total impulse generated to the total mass of fluid discharged by the jet, i.e.
 \begin{equation} I_\textit{sp}=\dfrac {\int _0^tF_{\textit{axial}}\, {\rm d}t}{\pi \rho D^3(L/D)/4}, \end{equation}
where different
 $L/D$
corresponds to different mass of discharged fluid. As
 $L/D$
increases, the corresponding
 $I_\textit{sp}$
rises from being below
 $U_{\textit{max}}$
to exceeding it. This can be attributed to the increase in the average jet velocity and the enhanced unsteady thrust brought by the vortex ring (Krueger & Gharib Reference Krueger and Gharib2003). With decreasing
 $S/D$
,
 $I_\textit{sp}$
continues to decrease following an approximate
 $(S/D)^{-6}$
relationship within the range of
 $1.5\leqslant S/D\leqslant 4$
at each
 $L/D$
. Similarly, a turning point appears at
 $S/D=1.5$
. This is consistent with the variations of
 $\overline {\Delta F}$
with
 $S/D$
. For the same
 $L/D$
with an equal mass of discharged fluid,
 $I_\textit{sp}$
depends solely on the total impulse, i.e. the numerator on the right-hand side of (3.24). The reduction in total impulse with decreasing
 $S/D$
directly corresponds to the time integral of
 $\overline {\Delta F}$
. Therefore, the scaling relationship is maintained over the same integration interval. In addition, the reduction in
 $I_\textit{sp}$
with decreasing
 $S/D$
indicates that the impulse generated per unit of expelled fluid becomes smaller for the twin-starting jets. From a propulsion perspective, this reduction implies a decrease in propulsive efficiency under identical input conditions (Krueger & Gharib Reference Krueger and Gharib2003,Reference Krueger and Gharib2005).
Specific impulse
 $I_\textit{SP}$
calculated for the single starting jets and twin-starting jets with different
 $S/D$
and
 $L/D$
, including fitted curves derived from numerical results using the nonlinear least squares curve fitting method.

In addition, the deviation of the pressure and axial velocity distributions within the nozzle exits from axisymmetry about their respective jet axes under interaction can be quantitatively evaluated by extending the concept of distortion (MacManus et al. Reference MacManus, Chiereghin, Prieto and Zachos2017; Tanguy et al. Reference Tanguy, MacManus, Garnier and Martin2018). Typical gauge pressure and axial velocity contours within nozzle exits are inserted in figure 18(b) and 18(c), respectively, where the geometric centre (also representing the jet axis) is marked with red stars. The contour lines deviate from concentric rings around the geometric centre. Combining the distributions of pressure and axial velocity, each nozzle exit is divided into six fan-shaped sectors with an angle of
 $60^{\circ }$
, as shown in figure 18(a). Accordingly, the
 $60^{\circ }$
sector distortion coefficient (Tanguy et al. Reference Tanguy, MacManus, Garnier and Martin2018) is defined as
 \begin{equation} DC60=\dfrac {\overline {P}-\min _{k=1,\ldots ,6} \overline {P}_{k}}{\overline {P}}, \end{equation}
where
 $P$
denotes either the total pressure, static pressure or dynamic pressure. Here,
 $\overline {P}$
is the area-averaged value over the entire nozzle exit, and
 $\overline {P}_{k}$
is the area-averaged value within the
 $k$
th sector. In order to avoid numerical singularities arising from negative gauge pressure, a uniform offset of
 $+10$
is applied, and the resulting value is treated as the static pressure in the calculation. This adjustment preserves the relative distribution, ensuring that
 $DC60$
remains strictly bounded between 0 and 1. The dynamic pressure is obtained from the axial velocity as
 $0.5\rho u^2$
.
Development of
 $60^\circ$
sector distortion coefficient
 $DC60$
for (a) total pressure, (b) static pressure and (c) dynamic pressure at the nozzle exits for cases 11–19 with
 $L/D=3$
; (d) variation of time-averaged
 $DC60$
for total pressure with
 $S/D$
at each
 $L/D$
.

The dynamic
 $DC60$
of total pressure is shown in figure 18(a), where its magnitude increases as
 $S/D$
decreases. Its two constituent components, i.e.
 $DC60$
of static pressure and
 $DC60$
of dynamic pressure, are shown in figure 18(b) and 18(c), respectively. Both of them exhibit non-negligible magnitudes under the interaction between the twin-starting jets. The value of
 $DC60$
of both total and static pressure exhibits stage-dependent variations, similar to the behaviour of the thrust difference, reflecting the dominant influence of either MIP or CEVR. Based on the
 $DC60$
value of the dynamic pressure, although the interaction has little effect on the magnitude of
 $F_{L1\_U}$
, its influence on the axial velocity distribution cannot be neglected. This indicates that the action centre of
 $F_{L1\_U}$
may deviate from the geometric centre of the nozzle exit. The time-averaged distortion coefficient
 $\overline {DC60}$
of total pressure is shown in figure 18(d) for the twin-starting jets with different
 $S/D$
, along with the fitted curves at each
 $L/D$
. In comparison, the influence of
 $L/D$
on
 $\overline {DC60}$
is weaker than that of
 $S/D$
. The variation of
 $\overline {DC60}$
with
 $S/D$
approximately follows the scaling relationship of
 $(S/D)^{-3}$
at each
 $L/D$
. This lies between the
 $(S/D)^{-2}$
dominated by MIP and the
 $(S/D)^{-6}$
dominated by CEVR, indicating that both interaction mechanisms contribute to the generation of
 $DC60$
.
3.2.5. Influence of acceleration/deceleration rates in velocity programs
From (3.16), the influence of MIP on propulsive characteristics is related to the acceleration and deceleration rates. Accordingly, in addition to the FAFD velocity program used in cases 1-30, three additional velocity programs SASD, SAFD and FASD with different acceleration and deceleration rates are considered at
 $L/D=3$
. Development of
 $\Delta{\kern-1pt}F$
for the twin-starting jets with
 $S/D=1.5$
and different velocity programs is shown in figure 19. The magnitudes of
 $\Delta{\kern-1pt}F$
during the acceleration (deceleration) stage decrease with increasing
 $T_aU_{\textit{max}}/D$
(
 $T_dU_{\textit{max}}/D$
), i.e. directly proportional to the acceleration (deceleration) rate. This follows the relationship described in (3.16). As
 $T_aU_{\textit{max}}/D$
and
 $T_dU_{\textit{max}}/D$
increase, the dominance of MIP over CEVR (CEVR-R) gradually diminishes during both the acceleration and deceleration stages. Before the end of acceleration stage in the SAFD velocity program,
 $\Delta{\kern-1pt}F$
changes from positive (dominated by MIP) to negative (dominated by CEVR or CEVR-R). As for the FASD velocity program, the magnitude of negative
 $\Delta{\kern-1pt}F$
does not show significant increase at the onset of the deceleration stage as in FAFD. During the constant velocity stage, the magnitude of negative
 $\Delta{\kern-1pt}F$
remains nearly unchanged with only a slight decrease as
 $T_aU_{\textit{max}}/D$
increases. A longer acceleration duration reduces the impulse and energy supplied to the leading vortex rings under the same
 $L/D$
(Rosenfeld et al. Reference Rosenfeld, Rambod and Gharib1998; Shusser et al. Reference Shusser, Rosenfeld, Dabiri and Gharib2006), resulting in weaker vortex rings and diminished interaction between them. After the termination of jet at
 $t^*\gt 3$
, the magnitude of negative
 $\Delta{\kern-1pt}F$
decreases with increasing
 $T_dU_{\textit{max}}/D$
. The longer deceleration duration also reduces the impulse and energy supplied to the leading vortex rings with the same
 $L/D$
. Furthermore, this can also be attributed to the formation of weaker stopping vortex rings at lower deceleration rates (Zhu et al. Reference Zhu, Zhang, Yu, Gao and Zhao2024b). Therefore, the contribution of the stopping vortex rings to
 $\Delta{\kern-1pt}F$
becomes less significant.
Development of thrust difference
 $\Delta{\kern-1pt}F$
for twin-starting jets with different velocity programs at
 $S/D=1.5$
and
 $L/D=3$
. Solid and dashed arrows indicate the end of acceleration stage and the beginning of deceleration stage, respectively, for each case.

The variations of
 $\overline {\Delta F}$
and
 $F_\textit{fluc}$
with
 $S/D$
are shown in figure 20 for different velocity programs. Adjusting the acceleration and deceleration rates in the velocity program can significantly affect the thrust fluctuation
 $F_\textit{fluc}$
normalised by
 $F_{fluc\_P}$
, but it has little effect on average thrust reduction, i.e.
 $\overline {\Delta F}$
. The magnitude of
 $\overline {\Delta F}$
decreases only slightly as the velocity program changes from FAFD with the highest acceleration and deceleration rates to SASD, SAFD and FASD with lower acceleration and deceleration rates (figure 20
a). For the same
 $L/D$
, the impulse and energy supplied by the starting jets to the leading vortex rings decrease with lower acceleration and deceleration rates, resulting in weaker leading vortex rings and interaction between them. The scaling relationships obtained using the nonlinear least squares curve fitting consistently follow
 $\overline {\Delta F}\sim (S/D)^{-5.91}$
for
 $1.5\leqslant S/D\leqslant 4$
. A turning point occurs at
 $S/D=1.5$
, beyond which the increase in the magnitude of
 $\overline {\Delta F}$
slows with decreasing
 $S/D$
, corresponding to the transition from CEVR to CEVR-R. This indicates that
 $\overline {\Delta F}$
remains dominated by CEVR and CEVR-R. For FAFD or SASD with identical acceleration and deceleration durations, the acceleration and deceleration rates are equal. Consequently,
 $\Delta{\kern-1pt}F$
contributions from the acceleration and deceleration stages under MIP nearly cancel each other out due to their equal magnitude and opposite sign over the same duration, yielding no significant net effect on
 $\overline {\Delta F}$
. This is confirmed by quantitative calculation of the time integrations using (3.22). The difference between their magnitudes, after approximately excluding the effect of CEVR, is less than
 $3\,\%$
. Even for SAFD or FASD, where the acceleration and deceleration durations are not identical,
 $U_{\textit{max}}$
remains the same at the end of acceleration and at the beginning of deceleration. The acceleration and deceleration rate (proportional to the magnitude of the induced
 $\Delta{\kern-1pt}F$
) is inversely proportional to the duration. Therefore, the product of the duration and the corresponding magnitude of
 $\Delta{\kern-1pt}F$
induced by MIP during the acceleration stage should be comparable to that during the deceleration stage. Therefore,
 $\Delta{\kern-1pt}F$
induced by MIP does not yield a net contribution to
 $\overline {\Delta F}$
. This also explains why
 $\overline {\Delta F}\sim (S/D)^{-5.91}$
obtained in the present work is consistent with the
 $\overline {\Delta F}\sim (S/D)^{-6}$
obtained by Athanassiadis (Reference Athanassiadis2016) and Athanassiadis & Hart (Reference Athanassiadis and Hart2016).
(a) Time-averaged thrust difference
 $\overline {\Delta F}$
and (b) overall thrust fluctuation
 $F_\textit{fluc}$
in the twin-starting jets with different
 $S/D$
under different velocity programs at
 $L/D=3$
.

The value of
 $F_\textit{fluc}$
normalised by
 $F_{fluc\_P}$
exhibits greater variation among different velocity programs (figure 20
b). As the acceleration and deceleration rates decrease, the magnitude of
 $F_\textit{fluc}$
normalised by
 $F_{fluc\_P}$
increases, and the scaling relationship between
 $F_\textit{fluc}$
and
 $S/D$
deviates from that of FAFD, with
 $F_\textit{fluc}\sim (S/D)^{-1.89}$
, approaching approximately
 $F_\textit{fluc}\sim (S/D)^{-2.65}$
for the other three velocity programs. This indicates that
 $F_\textit{fluc}$
is primarily dominated by MIP, while the influence of CEVR gradually emerges as MIP weakens with the adjustment of the velocity program. As for the increase in the magnitude of
 $F_\textit{fluc}$
normalised by
 $F_{fluc\_P}$
, it mainly results from the reduction in the magnitude of
 $F_{fluc\_P}$
. Reducing the acceleration and deceleration rates decreases the magnitude of
 $F_\textit{fluc}$
generated by the interaction between twin-starting jets dominated by MIP. However, this effect is less pronounced than the influence of the velocity program adjustment on the generation of pressure thrust, which can be effectively mitigated by reducing the acceleration and deceleration rates in the velocity program (Gao et al. Reference Gao, Wang, Yu and Chyu2020; Zhang et al. Reference Zhang, Wang and Wan2020).
3.3. Additional lateral forces
3.3.1. Generation mechanism of the lateral force
(a) Comparison for the development processes of axial thrust
 $F_{\textit{axial}}$
and lateral force
 $F_{\textit{lateral}}$
in case 13; (b) development of
 $F_{\textit{lateral}}$
in cases 11-19 with different
 $S/D$
at
 $L/D=3$
, along with schematics illustrating the sign definition of
 $F_{\textit{lateral}}$
.

Based on the discussion of forces generated by the twin-starting jets, the force exerted by fluid on the nozzle outer wall is identified (2.5). The analysis reveals that this force has both an axial component (the second term on the right-hand side of (2.7)) and a lateral component (perpendicular to the axial direction, as expressed in (2.8)). Based on the numerical results, the component
 $F_{L2\_Y}$
in (2.8) can be neglected for the twin-starting jets. Therefore, the lateral force
 $F_{\textit{lateral}}$
generated by the twin-starting jets can be calculated using the simplified (2.9), where the direction is along the
 $Z$
-axis. Due to the flow symmetry about the
 $X{-}Y$
plane,
 $F_{\textit{lateral}}$
acting on the two nozzle outer walls are equal in magnitude but opposite in direction. As shown in figure 21, the sign of
 $F_{\textit{lateral}}$
is defined based on
 $F_{L2\_Z}$
acting on the nozzle outer wall of the first starting jet. With this definition, the positive
 $F_{\textit{lateral}}$
indicates that the two nozzles are being pushed away from
 $Z=0$
along the
 $Z$
-axis, while the negative
 $F_{\textit{lateral}}$
represents pulling them toward
 $Z=0$
.
The developments of
 $F_{\textit{axial}}$
and
 $F_{\textit{lateral}}$
are compared in figure 21(a) for case 13 with
 $S/D=1.5$
. During the acceleration and deceleration stages,
 $F_{\textit{lateral}}$
can reach magnitudes of the same order as
 $F_{\textit{axial}}$
, with the maximum magnitude exceeding
 $15\,\%$
of it. For twin-starting jets with different
 $S/D$
at
 $L/D=3$
, the development of
 $F_{\textit{lateral}}$
is shown in figure 21(b). Similar to the influence of interaction on the generation of
 $F_{\textit{axial}}$
(recall figure 10),
 $F_{\textit{lateral}}$
shows one order of magnitude difference between the acceleration (deceleration) stage and the constant velocity stage. The positive
 $F_{\textit{lateral}}$
is generated during the acceleration stage, with its maximum magnitude reaching
 $60\, \%$
of
 $\rho \pi\! D^2U_{\textit{max}}^2/4$
at
 $S/D=1.1$
. Subsequently, after entering the constant velocity stage,
 $F_{\textit{lateral}}$
reverses its sign, and its magnitude decreases by approximately one order of magnitude. This transition can be associated with the change in the dominant interaction mechanism, i.e. from MIP to CEVR. Entering the deceleration stage, the negative
 $F_{\textit{lateral}}$
increases by one order of magnitude, even slightly exceeding that observed during the acceleration stage. This might result from the persistent influence of CEVR, despite the stage being dominated by MIP. After the termination of starting jets,
 $F_{\textit{lateral}}$
changes to a positive value with small magnitude. The magnitude of
 $F_{\textit{lateral}}$
increases with decreasing
 $S/D$
. This indicates that the generation of
 $F_{\textit{lateral}}$
is enhanced as the two starting jets become closer to each other.
The value of
 $F_{\textit{lateral}}$
arises from the asymmetric pressure distribution on the nozzle outer wall. Based on (2.5) and (2.9), its generation is determined by the
 $Z$
-components of the static pressure
 $P$
and shear stress
 $\tau$
acting on the nozzle outer wall, which are compared in figure 22(a). The contribution of
 $\tau$
is negligible, while the development of averaged
 $Z$
-component of
 $P$
aligns with the evolution of
 $F_{\textit{lateral}}$
shown in figure 21. The pressure fields on the nozzle outer wall are shown in figure 22(c) at four instants (highlighted in figure 22
a). In order to show the cylindrical nozzle outer wall in a planar view, an azimuthal coordinate
 $\theta$
is introduced in the cylindrical coordinates, as shown in figure 22(b). The positions
 $(D/2, S/2)$
and
 $(D/2, -S/2)$
are defined as
 $\theta =0$
for the first and second starting jets, respectively. As for the axial position, the
 $X$
-axis of the Cartesian coordinate system
 $(X,Y,Z)$
is directly used.
(a) Comparison for the averaged
 $Z$
-components of pressure
 $P$
and shear stress
 $\tau$
on the nozzle outer wall in case 13 (
 $L/D=3$
,
 $S/D=1.5$
); (b) definition of the azimuthal coordinate
 $\theta$
representing positions on the nozzle outer walls; and (c) pressure field on the nozzle outer wall at four instants in (a).

The pressure field under MIP generates a positive
 $F_{\textit{lateral}}$
during the acceleration stage. The side close to
 $Z=0$
(
 $\theta =1.5\pi$
) of the nozzle outer wall experiences higher pressure compared with the side away from
 $Z=0$
(
 $\theta =0.5\pi$
), as shown in figure 22(ci). This pressure difference between two sides results in the positive
 $F_{\textit{lateral}}$
, pointing away from
 $Z=0$
. As for the constant velocity stage, the interaction between two leading vortex rings, i.e. CEVR or CEVR-R, induces a negative
 $F_{\textit{lateral}}$
. When the side away from
 $Z=0$
(
 $\theta =0.5\pi$
) of nozzle outer wall has nearly recovered to the ambient pressure, the side close to
 $Z=0$
(
 $\theta =1.5\pi$
) still experiences negative gauge pressure (figure 22
cii). This pressure distribution pattern persists during the deceleration stage, but with an increased pressure difference magnitude under MIP, as shown in figure 22(ciii). After the twin-starting jets terminate, the pressure distribution resembles that of the acceleration stage, as shown in figure 22(civ), which results in a positive
 $F_{\textit{lateral}}$
. Nevertheless, the interaction between two leading vortex rings that produces the negative
 $F_{\textit{lateral}}$
remains effective. This indicates the presence of an additional mechanism contributing to the generation of positive
 $F_{\textit{lateral}}$
. Combining figure 22(civ) with figure 11(biv), it is evident that this mechanism arises from the two stopping vortex rings, which exhibit asymmetry relative to their respective jet axes.
Similar to that of thrust difference
 $\Delta{\kern-1pt}F$
shown in figure 12, the reduction in the magnitudes of
 $F_{\textit{lateral}}$
induced by MIP and CEVR (CEVR-R) with increasing
 $S/D$
is to be quantitatively analysed. The time-averaged magnitudes of
 $F_{\textit{lateral}}$
, denoted as
 $\overline {|F|}$
, during the acceleration (deceleration) stage and the constant velocity stage are shown in figure 23 as a function of
 $S/D$
. Here,
 $\overline {|F|}$
is calculated by replacing
 $\Delta F(t)$
on the right-hand side of (3.9) with
 $F_{\textit{lateral}}(t)$
. The magnitudes of
 $\overline {|F|}$
in the acceleration and deceleration stages are comparable and approximately one order of magnitude larger than those in the constant velocity stage. Moreover, the influence of
 $L/D$
on
 $\overline {|F|}$
is also negligible in the range of
 $1.5\leqslant S/D\leqslant 4$
. These characteristics are consistent with the behaviour of
 $\overline {|\Delta F|}$
observed across these three stages (recall figure 12). However, the scaling relationships for the acceleration (deceleration) stage and the constant velocity stage transition from
 $\overline {|\Delta F|}\sim (S/D)^{-1.9}$
and
 $\overline {|\Delta F|}\sim (S/D)^{-5.91}$
to
 $\overline {|F|}\sim (S/D)^{-0.64}$
and
 $\overline {|F|}\sim (S/D)^{-2.77}$
, respectively. This can be attributed to the fact that
 $F_{\textit{axial}}$
and
 $F_{\textit{lateral}}$
originate from different regions, i.e. the nozzle exits and the nozzle outer walls, respectively. It should be noted that these scaling relationships are obtained from the results corresponding to
 $1.5\leqslant S/D\leqslant 4$
. For
 $S/D \lt 1.5$
, the growth of
 $\overline {|F|}$
with decreasing
 $S/D$
slows down in both the acceleration and deceleration stages and the constant velocity stage. Large discrepancies also occur between cases with different
 $L/D$
. During the constant velocity stage, this can be associated with the transition from CEVR to CEVR-R. As for
 $\overline {|F|}$
dominated by MIP during the acceleration and deceleration stages, the reduced nozzle spacing introduces interference from the adjacent wall, which weakens the pressure field induced by the acceleration and deceleration of starting jets.
Time-averaged magnitudes of lateral force
 $\overline {|F|}$
as a function of
 $S/D$
for different
 $L/D$
with the FAFD velocity program, calculated during (a) the acceleration or deceleration stages dominated by MIP and (b) the constant velocity stage dominated by CEVR or CEVR-R.

3.3.2. Deployment of a vertical wall to eliminate lateral force
The generation of lateral forces perpendicular to the jet direction could adversely affect the precise position control and manoeuvrability of underwater vehicles. As discussed above, this arises from the asymmetric pressure distribution on the nozzle outer walls. To mitigate this effect, an additional vertical wall is introduced at the nozzle exit plane, forming what is termed as the orifice configuration (Rosenfeld et al. Reference Rosenfeld, Rambod and Gharib1998; Zhu et al. Reference Zhu, Zhang, Yu, Gao and Zhao2024b). Similar to figure 2(b), the control volumes used for analysing the forces generated by the single starting jet and twin-starting jets with the additional vertical wall are schematically shown in figure 24. The control volume boundaries in the current view are divided into 6 segments for the single starting jet (from B1 to B6) and 8 segments for the twin-starting jets (from B1 to B8). The forces acting on segment B1 in figure 24(a), and on segments B1 and B3 in figure 24(b), can be calculated from the velocity and pressure profiles at the nozzle exits. The calculation follows the same approach as in (2.4), and the resulting force is denoted as
 $F_\textit{exit}$
. Here,
 $F_\textit{exit}$
is aligned with the jet direction (
 $X$
-axis) and represents the thrust required for propulsion when it takes a positive value. According to the two terms on the right-hand side of (2.4),
 $F_\textit{exit}$
can be decomposed into pressure component
 $F_{exit\_P}$
and momentum flux component
 $F_{exit\_U}$
(Krueger & Gharib Reference Krueger and Gharib2003; Gao et al. Reference Gao, Wang, Yu and Chyu2020). For the additional vertical wall (segments B2 and B6 in figure 24(a), and segments B2, B4 and B8 in figure 24
b), the force generated by the pressure and shear stress can be calculated similarly by (2.5), denoted as
 $F_{w\textit{all}}$
. The far-field boundaries of control volumes, i.e. the segments B3, B4 and B5 in figure 24(a), as well as segments B5, B6 and B7 in figure 24(b), are exposed only to the ambient static pressure. To account for their influence, only the difference between the actual pressure and the ambient pressure, i.e. the gauge pressure, is used in the calculation of
 $F_\textit{exit}$
and
 $F_{w\textit{all}}$
.
Schematics of the control volumes used to calculate the forces generated by (a) the single starting jet and (b) the twin-starting jets in the
 $X{-}Z$
plane of Cartesian coordinate system
 $(X,Y,Z)$
after the addition of a vertical wall.

Cases 11-20 with the FAFD velocity program at
 $L/D=3$
are employed to investigate the modifications induced by the transition from nozzle to orifice configuration. When calculating
 $F_{w\textit{all}}$
for the orifice configuration, only the normal pressure component is considered, as the shear stress is sufficiently weak to be neglected. Since the additional vertical wall is perpendicular to the jet direction,
 $F_{w\textit{all}}$
is aligned with the jet axis and directly contributes to the thrust. The transition from nozzle to orifice configuration completely eliminates the lateral forces induced by twin-starting jet interactions. Consequently, the axial thrust
 $F_{\textit{axial}}$
for propulsion can be expressed as
 \begin{equation} F_{\textit{axial}}=F_{w\textit{all}}+F_\textit{exit}. \end{equation}
However, the additional vertical wall amplifies the influence of interaction on the generation of
 $F_{\textit{axial}}$
. The development of thrust difference
 $\Delta{\kern-1pt}F$
calculated by (3.8) is shown in figure 25(a) for cases 11-19 in the orifice configuration. Similar development patterns are observed: the magnitudes of
 $\Delta{\kern-1pt}F$
during the acceleration and deceleration stages are comparable but opposite in sign, while the constant velocity stage exhibits a negative
 $\Delta{\kern-1pt}F$
with a smaller magnitude. However, the peak magnitude of
 $\Delta{\kern-1pt}F$
exceeds
 $480\,\%$
of
 $\rho \pi\! D^2U_{\textit{max}}^2/4$
in the orifice configuration, nearly fourfold that in the nozzle configuration. Furthermore, the magnitude of
 $\Delta{\kern-1pt}F$
increases with
 $S/D$
, which is contrary to the trend observed in the nozzle configuration. The above two differences primarily result from the axial force acting on the additional vertical wall, i.e.
 $F_{w\textit{all}}$
. The development of
 $\Delta{\kern-1pt}F$
calculated for the two components of
 $F_{\textit{axial}}$
, i.e.
 $F_{w\textit{all}}$
and
 $F_\textit{exit}$
, is shown in figure 25(b) and 25(c), respectively. The higher magnitude of
 $\Delta{\kern-1pt}F$
for
 $F_{\textit{axial}}$
originates from the additional
 $F_{w\textit{all}}$
, with
 $\Delta{\kern-1pt}F$
for
 $F_{w\textit{all}}$
exceeding
 $480\,\%$
of
 $\rho \pi\! D^2U_{\textit{max}}^2/4$
at
 $S/D=4$
. In addition, the magnitude of
 $\Delta{\kern-1pt}F$
for
 $F_{w\textit{all}}$
increases with
 $S/D$
. The generation of
 $\Delta{\kern-1pt}F$
for
 $F_{w\textit{all}}$
can also be attributed to MIP during both the acceleration and deceleration stages. The acceleration (deceleration) of starting jet induces the positive (negative) gauge pressure on the vertical wall region corresponding to another jet. As
 $S/D$
increases, MIP affects a larger region of the vertical wall, thereby amplifying the magnitude of
 $\Delta{\kern-1pt}F$
for
 $F_{w\textit{all}}$
.
Development of the thrust difference
 $\Delta{\kern-1pt}F$
for cases 11-19 with
 $L/D=3$
in the orifice configuration: (a) total axial thrust
 $F_{\textit{axial}}$
; as well as its components, (b)
 $F_{w\textit{all}}$
, (c)
 $F_\textit{exit}$
and (d)
 $F_{exit\_P}$
.

As shown in figure 25(c), the development of
 $\Delta{\kern-1pt}F$
for
 $F_\textit{exit}$
follows the same trend as that observed for
 $F_{\textit{axial}}$
in the nozzle configuration (recall figure 10). However, the magnitudes of
 $\Delta{\kern-1pt}F$
for
 $F_\textit{exit}$
during the acceleration and deceleration stages reach approximately
 $180\,\%$
of
 $\rho \pi\! D^2U_{\textit{max}}^2/4$
at
 $S/D=1.1$
, nearly 1.5 times the corresponding values observed for
 $F_{\textit{axial}}$
in the nozzle configuration. During the constant velocity stage and after jet termination, the magnitudes of
 $\Delta{\kern-1pt}F$
for
 $F_\textit{exit}$
remain comparable to those for
 $F_{\textit{axial}}$
in the nozzle configuration. This indicates that the transition from nozzle to orifice configuration does not significantly alter the role of CEVR (CEVR-R). In addition, the interaction between the twin-starting jets also primarily influences the development of
 $F_\textit{exit}$
through its effect on
 $F_{exit\_P}$
. A comparison between figure 25(c) and 25(d) reveals nearly identical development patterns of
 $\Delta{\kern-1pt}F$
for
 $F_\textit{exit}$
and
 $F_{exit\_P}$
.
The transition from nozzle to orifice configuration affects both the average thrust reduction, represented by the negative
 $\overline {\Delta F}$
, and the overall thrust fluctuation
 $F_\textit{fluc}$
. Here,
 $\overline {\Delta F}$
calculated from
 $\Delta F(t)$
for
 $F_{\textit{axial}}$
is shown in figure 26(a). The configuration change amplifies the magnitude of
 $\overline {\Delta F}$
, and the difference becomes more pronounced as
 $S/D$
increases. This primarily arises from the increasing contribution of
 $\Delta{\kern-1pt}F$
for
 $F_{w\textit{all}}$
with
 $S/D$
. When
 $F_{w\textit{all}}$
is excluded,
 $\overline {\Delta F}$
for
 $F_\textit{exit}$
in the orifice configuration is closer to that for
 $F_{\textit{axial}}$
in the nozzle configuration, as shown by the blue and black dots in figure 26(a). However, the scaling relationship of
 $\overline {\Delta F}$
with respect to
 $S/D$
shifts from
 $(S/D)^{-5.91}$
to
 $(S/D)^{-4.15}$
in the range of
 $1.5\leqslant S/D\leqslant 4$
following the configuration transition. With the transition from CEVR to CEVR-R under the effect of vortex ring reconnection, a turning point also occurs at
 $S/D=1.5$
, beyond which the scaling relationship no longer holds for
 $S/D\lt 1.5$
. The formation of both leading and stopping vortex rings is also altered by the configuration transition (Gharib et al. Reference Gharib, Rambod and Shariff1998; Rosenfeld et al. Reference Rosenfeld, Rambod and Gharib1998; Zhu et al. Reference Zhu, Zhang, Yu, Gao and Zhao2024b), which potentially modifies CEVR and the corresponding scaling relationships. Similarly,
 $F_\textit{fluc}$
for
 $F_{\textit{axial}}$
also experiences an increase with the configuration transition, reaching a peak value about
 $180\,\%$
of the corresponding
 $F_{fluc\_P}$
obtained from the single starting jet with the same
 $L/D=3$
. In contrast to the nozzle configuration, where the magnitude of
 $F_\textit{fluc}$
decreases with increasing
 $S/D$
, the orifice configuration exhibits an increasing trend of
 $F_\textit{fluc}$
with
 $S/D$
. This also arises from the additional
 $F_{w\textit{all}}$
generated under MIP. After excluding
 $F_{w\textit{all}}$
,
 $F_\textit{fluc}$
calculated for the remaining
 $F_\textit{exit}$
becomes consistent with that in the nozzle configuration, and both satisfy about
 $F_\textit{fluc}\sim (S/D)^{-2}$
. This confirms that the induced pressure field model established in § 3.2.2 remains valid for the orifice configuration. However, the magnitude of
 $F_\textit{fluc}$
for
 $F_\textit{exit}$
in the orifice configuration exceeds that for
 $F_{\textit{axial}}$
in the nozzle configuration. This can be attributed to the enhanced pressure field induced by the acceleration and deceleration stages with the configuration transition.
(a) Time-averaged thrust difference
 $\overline {\Delta F}$
and (b) overall thrust fluctuation
 $F_\textit{fluc}$
calculated for cases 11-19 with different
 $S/D$
at
 $L/D=3$
for
 $F_{\textit{axial}}$
in the nozzle configuration, as well as
 $F_{\textit{axial}}$
and
 $F_\textit{exit}$
in the orifice configuration.

4. Summary
The interactions between two identical and parallel starting jets (dubbed as twin-starting jets) with simultaneous initiations and their influence on propulsive characteristics have been investigated numerically with different dimensionless distances
 $S/D$
and stroke ratios
 $L/D$
. The effects of the interaction on the development of wake vortical structures and on the generation of forces have been examined in detail.
In contrast to the axisymmetric vortical structures of single starting jets, the vortical structures in twin-starting jets are symmetric about two orthogonal planes. The two leading vortex rings deform due to mutual interaction when
 $S/D\gt 1.5$
and undergo reconnection at
 $S/D\leqslant 1.5$
. The portions of the two leading vortex rings that are close to each other are decelerated under mutually induced velocities. As a consequence, both the vorticity distribution within the vortex cores and their spatial positions are altered. By examining planes at different azimuthal positions of the leading vortex ring, it is found that the interaction primarily affects the adjacent halves of two vortex rings, while leaving the distal halves largely undisturbed. The interaction of wake vortical structures alters the pressure field near the nozzle exits, which ultimately affects the propulsive characteristics of jets.
The interaction between twin-starting jets affects the development of axial thrust, mainly through altering the generation of pressure thrust. The underlying mechanisms can be attributed to two primary factors. First, the coupling effect of vortex rings (CEVR at
 $S/D\gt 1.5$
) and its residual form under vortex ring reconnection (CEVR-R at
 $S/D\lt 1.5$
) induce significantly lower pressure at the nozzle exits for a longer duration. Second, the MIP also contributes. The acceleration (deceleration) of one starting jet superimposes a positive (negative) gauge pressure field at the nozzle exit of another jet. For any given velocity program, the influence of MIP during the acceleration stage on average thrust generation is largely offset by its effect during the deceleration stage. An induced pressure field model has been established to describe the influence of MIP, which can predict its scaling relationship with
 $S/D$
.
The influence of
 $L/D$
may be negligible, whereas
 $S/D$
plays a critical role. Two parameters are defined to quantify the influence of interaction on the propulsive characteristics, i.e. the time-averaged thrust difference
 $\overline {\Delta F}$
and the overall thrust fluctuation
 $F_\textit{fluc}$
. The interaction induces a negative
 $\overline {\Delta F}$
, which means that the generation of average thrust is weakened. The scaling relationship between
 $\overline {\Delta F}$
and
 $S/D$
can be considered as
 $\overline {\Delta F}\sim (S/D)^{-6}$
and is mainly dominated by CEVR at
 $1.5\leqslant S/D\leqslant 4$
. As
 $S/D$
further decreases from 1.5, the transition from CEVR to CEVR-R produces a turning point in the trend of
 $\overline {\Delta F}$
. Regarding the scaling relationship between
 $F_\textit{fluc}$
and
 $S/D$
, it approximately follows
 $F_\textit{fluc}\sim (S/D)^{-2}$
, indicating that this parameter is dominated by MIP. The influence of velocity programs with different acceleration and deceleration rates but the same
 $L/D$
and maximum velocity on
 $\overline {\Delta F}$
and
 $F_\textit{fluc}$
has also been examined. The adjustment of the velocity program has almost no effect on
 $\overline {\Delta F}$
. In contrast, reducing the acceleration and deceleration rates decreases the magnitude of
 $F_\textit{fluc}$
, although this reduction is less significant than their influence on the generation of pressure thrust.
Compared with the negligible force exerted on the nozzle outer wall of a single starting jet, the interaction between twin-starting jets generates significant forces on the nozzle outer walls. This appears as an additional lateral force aligned with the line connecting the centres of the two nozzle exits, peaking at approximately
 $60\,\%$
of
 $\rho \pi\! D^2U_{\textit{max}}^2/4$
and exceeding
 $15\,\%$
of the axial thrust. The lateral forces acting on the two nozzle outer walls are equal in magnitude but opposite in direction, which originates from the asymmetric pressure distributions on the nozzle outer walls. A vertical wall is introduced within the nozzle exit plane, converting the original nozzle configuration into an orifice configuration. This effectively eliminates the lateral forces but exerts a more pronounced influence on the axial thrust. The maximum magnitude of thrust difference exceeds
 $480\,\%$
of
 $\rho \pi\! D^2U_{\textit{max}}^2/4$
, nearly fourfold that in the nozzle configuration. The higher magnitude arises from the forces acting on the additional vertical wall. This is also reflected in the indicators of propulsive characteristics. Although the magnitude of
 $\overline {\Delta F}$
does not change significantly, its variation with increasing
 $S/D$
no longer exhibits a monotonic decrease towards zero. The configuration modification also induces greater axial thrust fluctuations. The maximum magnitude of
 $F_\textit{fluc}$
exceeds
 $180\, \%$
of the corresponding
 $F_{fluc\_P}$
of the single starting jet with the same
 $L/D=3$
, which is nearly threefold that in the nozzle configuration. By considering only the thrust generated at the nozzle exits, the results obtained for the two indicators of propulsive characteristics are close to those from the original nozzle configuration.
Supplementary movies
Supplementary movies are available at https://doi.org/10.1017/jfm.2025.11056.
Funding
We thank the National Natural Science Foundation of China (124B2044) for financial support.
Declaration of interests
The authors report no conflict of interest.