


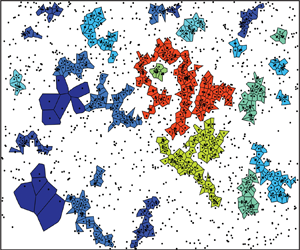





1. Introduction
Evaporating sprays are encountered in several industrial sectors, including fuel combustion in internal-combustion engines, and gas turbines, process industries, spray drying, exhaust gas after-treatment, cooling towers and seawater desalination. In all these applications, understanding the transport and evaporation of the spray droplets is crucial for the system design, development and for achieving optimal performance. It is well known that the dispersion of the spray droplets in the turbulent gas medium strongly influences the overall spray evaporation process. In this context, unsteady spray dispersion due to droplet clustering is important since it leads to large spatiotemporal fluctuations of droplet concentration in the spray (Heinlein & Fritsching Reference Heinlein and Fritsching2006). The mechanism of droplet clustering in sprays is intimately related to the preferential particle segregation phenomenon identified in particle-laden turbulent flow, which many researchers have widely investigated for the past few decades (Balachandar & Eaton Reference Balachandar and Eaton2010; Brandt & Coletti Reference Brandt and Coletti2022). The dispersed particles preferentially accumulate in the high strain rate and low vorticity regions of the flow as a consequence of their interaction with the turbulent eddies of the carrier phase (Fessler, Kulick & Eaton Reference Fessler, Kulick and Eaton1994; Ferrante & Elghobashi Reference Ferrante and Elghobashi2003). The particle–turbulence interaction is dictated by several parameters, the key ones being the particle Stokes number,  $St$ (ratio of particle relaxation time to turbulence time scale), Reynolds number of the fluid flow and particle-to-fluid mass/volume loading ratio and density ratio (Sumbekova et al. Reference Sumbekova, Cartellier, Aliseda and Bourgoin2017). It has been well established that for dense particles, local accumulation of particles is intense for
 $St \sim 1$ when evaluated based on the Kolmogorov scale (Balachandar & Eaton Reference Balachandar and Eaton2010). However, such a phenomenon is not restricted to small scales of turbulence; rather, it extends to large scales when heavier particles are considered and can occur even when
 $St \gg 1$ (Bec et al. Reference Bec, Biferale, Cencini, Lanotte, Musacchio and Toschi2007; Yoshimoto & Goto Reference Yoshimoto and Goto2007; Goto & Vassilicos Reference Goto and Vassilicos2008; Ireland, Bragg & Collins Reference Ireland, Bragg and Collins2016). In any case, clustering refers to the scenario when the preferential particle accumulation effect is strong such that very dense and almost empty regions dynamically evolve in the flow, and the clusters are the entities which retain high concentration of particles over a time scale comparable to some time scale of the turbulent carrier flow (Monchaux, Bourgoin & Cartellier Reference Monchaux, Bourgoin and Cartellier2012). In this paper, we intend to investigate the evaporation of such groups of particles or droplet clusters in an evaporating spray.
Significant research works have been devoted towards understanding particle clustering in various canonical turbulent flows, e.g. channel flows, jets, turbulence chambers (Wood, Hwang & Eaton Reference Wood, Hwang and Eaton2005; Hwang & Eaton Reference Hwang and Eaton2006; Salazar et al. Reference Salazar, De Jong, Cao, Woodward, Meng and Collins2008; Tanaka & Eaton Reference Tanaka and Eaton2010; Petersen, Baker & Coletti Reference Petersen, Baker and Coletti2019; Wang et al. Reference Wang, Fong, Coletti, Capecelatro and Richter2019, to name a few). However, though practically relevant, sprays are relatively much less investigated (Heinlein & Fritsching Reference Heinlein and Fritsching2006; Manish & Sahu Reference Manish and Sahu2018, Reference Manish and Sahu2019; Rostami, Li & Kheirkhah Reference Rostami, Li and Kheirkhah2023; Wu et al. Reference Wu, Zhang, Zhang and Roberts2023). Considering that the droplet size distribution in a spray is typically polydisperse, the droplets of different sizes interact with the eddies across the turbulence spectrum (ranging from the large eddies to the Kolmogorov scale). Accordingly, the response of a size class of droplets may also vary significantly depending on the eddy size. Thus, the tendency of the same droplets to form clusters is widely different when they interact with large-, intermediate- or small-scale eddies. Hence, the simultaneous clustering of droplets of different sizes is still poorly understood. Here, we distinguish droplet clustering in sprays from that in spray-laden flows, which gained considerable attention in the past (Aliseda et al. Reference Aliseda, Cartellier, Hainaux and Lasheras2002; Obligado et al. Reference Obligado, Teitelbaum, Cartellier, Mininni and Bourgoin2014; Sumbekova et al. Reference Sumbekova, Cartellier, Aliseda and Bourgoin2017; Kumar, Mathur & Chakravarthy Reference Kumar, Mathur and Chakravarthy2021; Mora et al. Reference Mora, Obligado, Aliseda and Cartellier2021). While the effect due to droplet size polydispersity is realized in both cases, the sprays possess some unique features that bring further complexity to the study of the mechanism of particle–turbulence interaction. For instance, the air entrained into the spray by the injected droplets is turbulent, which in turn disperses the same droplets. Hence, the particle and the carrier phases are always coupled, especially close to the injector. Obviously, a more complex scenario is anticipated when the droplets tend to vaporize since their response to the fluid flow now varies along their trajectory.
The experimental studies on evaporative sprays are rather limited. The previous works mostly focused on the measurement of spray droplet characteristics (e.g. Chen, Stårner & Masri Reference Chen, Stårner and Masri2006) and vapour concentration (e.g. Cochet et al. Reference Cochet, Bazile, Ferret and Cazin2009) in model experiments. Few studies considered the role of air turbulence (Nijdam, Stårner & Langrish Reference Nijdam, Stårner and Langrish2004) and droplet loading (Volkov, Kuznetsov & Strizhak Reference Volkov, Kuznetsov and Strizhak2016) on spray evaporation. No doubt, such studies extended our insight into the structure of the evaporating spray, the gross evaporation rate and vapour–air mixing and provided a database for the validation of numerical simulations of evaporating sprays. However, investigation on the clustering of evaporating droplets of polydisperse size distribution is rare, and not much attention has been paid to the study of the collective evaporation of droplet clusters. The reduction in the interdroplet spacing between droplets in a cluster may impact the rate at which droplets evaporate within a cloud (Reveillon & Demoulin Reference Reveillon and Demoulin2007). This is substantiated by the earlier research works on a stream of monosized droplets, where a droplet is accompanied by two neighbouring droplets (Castanet et al. Reference Castanet, Maqua, Orain, Grisch and Lemoine2007) and/or two- or three-dimensional droplet arrays (Imaoka & Sirignano Reference Imaoka and Sirignano2005a,Reference Imaoka and Sirignanob; Sirignano Reference Sirignano2014). The above-mentioned studies illustrated a decrease in droplet evaporation rate due to the concurrent evaporation of adjacent droplets as the local vapour concentration approaches the saturation level (corresponding to the ambient temperature) that reduces the vapour concentration gradient around the droplet. While such regular spacing among droplets is not expected in a spray, experiments in a dense plume of droplets by De Rivas & Villermaux (Reference De Rivas and Villermaux2016) and Villermaux et al. (Reference Villermaux, Moutte, Amielh and Meunier2017) illustrated that the droplets, when nested in a pack of other droplets, do not evaporate, especially when the stretching is low. According to the  $d^{2}$-law modelling for an isolated droplet (which refers to very large interdroplet spacing relative to the droplet size), the vaporization rate is diffusion controlled and dictated by the vapour concentration gradient around the droplet (Spalding Reference Spalding1951). Accordingly, the vaporization rate of droplets in a cluster is lower than that for an isolated droplet due to high local concentration of droplets or smaller droplet spacing. In such a case, a departure from the
 $d^{2}$-law is inevitable (De Rivas & Villermaux Reference De Rivas and Villermaux2016). The simultaneous measurement of local droplet number density and vapour mass fraction in an acetone spray by Sahu, Hardalupas & Taylor (Reference Sahu, Hardalupas and Taylor2018a) provides further evidence of this effect, as they found considerable variation in local vapour concentration even if the number density of droplets does not change, which was attributed to variation in droplet spacing due to clustering. Significant contributions from the numerical studies on simulations of evaporating droplets in isotropic turbulent flows and spray jets have been reported, especially in the recent past, which specifically focused on preferential segregation of droplets (e.g. Dalla Barba & Picano Reference Dalla Barba and Picano2018; Weiss, Meyer & Jenny Reference Weiss, Meyer and Jenny2018; Ciottoli et al. Reference Ciottoli, Battista, Malpica Galassi, Dalla Barba and Picano2021; Wang, Dalla Barba & Picano Reference Wang, Dalla Barba and Picano2021; Angelilli et al. Reference Angelilli, Pérez, Im, Ciottoli and Valorani2022). However, accurate modelling of evaporation of simultaneously vaporizing neighbouring droplets (as in droplet clusters) is still challenging (Jenny, Roekaerts & Beishuizen Reference Jenny, Roekaerts and Beishuizen2012). In this regard, detailed experimental characterization of evaporating droplet clusters is needed for rigorous validation of the spray simulation results. However, the vaporization of droplet clusters in sprays is still not thoroughly understood, and the extent of reduction in droplet evaporation rate in clusters is not yet quantified.
The above discussion emphasizes the importance of quantifying the droplet grouping effect on the collective evaporation of the droplet clusters in a spray. Such a scenario can strongly impact the system's performance in practical applications. For example, in the combustion of liquid fuel sprays in various applications, the evaporation of the injected spray droplets must precede the preparation of the fuel vapour–air mixture that burns to release energy. The clustering of droplets can potentially influence the heat release rate, the overall structure of the spray flame and the mechanisms of pollutant formation. In this context, we cite the model proposed by Chiu et al. (Chiu & Liu Reference Chiu and Liu1977; Chiu, Kim & Croke Reference Chiu, Kim and Croke1982; Kim & Chiu Reference Kim and Chiu1983), who defined the non-dimensional Group number ( $G$) for a droplet cloud. This number refers to the ratio of droplet gasification rate and oxidizer diffusion rate into the cloud and characterizes the droplet cloud combustion behaviour (Reveillon & Vervisch Reference Reveillon and Vervisch2005). Depending on the magnitude of the Group number, distinct combustion modes are identified depending on
 $G \ll 1$ (which refers to isolated droplet combustion in a sparse cloud of droplets where the convectional
 $d^{2}$-law modelling is applicable) and
 $G \gg 1$ (which refers to external group combustion in a dense droplet cloud which does not allow diffusion of heat into the cloud, and in such a case
 $d^{2}$-law is questionable). In between these limiting conditions, a transition via intermediate modes occurs. For
 $G < 1$, the internal group mode prevails, which refers to individual droplets burning around a droplet core surrounded by a flame, while the external group mode occurs for
 $G > 1$ so that the flame encompasses the entire droplet cloud with no instances of individual droplet burning. For
 $G > 10^{2}$, the vaporization of the droplets in the core region of the droplet cloud is completely prevented, which is known as the external sheath combustion mode. Considering that
 $G$ essentially depends on the geometric characteristics in a droplet cloud, viz. cloud size, interdroplet spacing and droplet size, the different modes described above can be envisaged for a purely evaporating spray as well. Accordingly, the measurement of
 $G$ can elucidate the group mode of evaporation of the droplet clusters. Nevertheless, there are some challenges. While in the model proposed by Chiu and coworkers, a quiescent cloud of monosized droplets has been assumed, extending the concept to a practical spray is not straightforward, and only a few works have been reported in this direction. Chen & Gomez (Reference Chen and Gomez1997) evaluated the Group number in a laminar spray flame based on the measurement of droplet size and spacing using the phase Doppler particle analyser (PDPA) technique. The cloud radius was replaced by the radial coordinate of the measurement location in the spray. Potdar & Kumar (Reference Potdar and Kumar2022) measured
 $G$ in lifted spray flames based on the average droplet spacing, number density and size using different imaging techniques. However, Akamatsu et al. (Reference Akamatsu, Miutani, Katsuki, Tsushima and Cho1996) insisted on evaluating
 $G$ values for individual droplet clusters instead of the global spray, which was corroborated by the short-exposure flame images that demonstrated preferential flame propagation through fragmented flamelets. The above authors characterized the droplet clusters by the application of the PDPA technique. However, since PDPA is a single particle counter technique, the evaluation of the Group number is not straightforward and may lead to large uncertainty. This is because the droplet clusters extend spatially, and instantaneous spatial measurement of the clusters is not possible using the above technique (Sahu, Manish & Hardalupas Reference Sahu, Manish and Hardalupas2018b). Additionally, the length scale of clusters need not be the same in all directions as a cluster may be preferentially oriented in some direction other than the velocity of the droplets (Manish & Sahu Reference Manish and Sahu2018). Thus, the application of the whole field measurement techniques is advantageous as the spatial distribution of the droplets can be visualized, and accordingly, the droplet clusters can be characterized via statistical analysis of the images. Among the different approaches for cluster characterization (see Monchaux et al. (Reference Monchaux, Bourgoin and Cartellier2012) for a review), the Voronoi analysis is particularly useful due to its potential to identify not only the topology of the droplet clusters but also the ability for geometrical characterization of the clusters and the local droplet number density. Manish & Sahu (Reference Manish and Sahu2021) demonstrated the application of Voronoi analysis to particle image velocimetry (PIV) images of a burning kerosene spray generated from a pressure swirl atomizer. The droplet clusters were identified, which thereby facilitated the evaluation of the Group number of the individual droplet clusters. Pandurangan & Sahu (Reference Pandurangan and Sahu2022) characterized the clusters of evaporating acetone droplets by calculating Voronoi tessellations in PIV images. However, they did not measure the Group number. A similar approach was adopted in Balasubramaniyan, Pandurangan & Sahu (Reference Balasubramaniyan, Pandurangan and Sahu2023) to investigate the difference in the evolution of the Group number in an acetone spray under non-reacting and reacting conditions. It was identified that in spray combustion, the presence of the reaction zone completely modifies the droplet spatial distribution and clustering, and additional effects, such as buoyancy, introduce further complexity. Up to the authors’ knowledge, experimental investigation on the evolution of the Group number for droplet clusters in a strongly evaporating spray has not been reported so far.
1.1. Scope of the present paper
In this paper, we experimentally characterize the Group number for droplet clusters in an acetone spray using different laser diagnostic techniques. The spray was generated using an air-assist injector operating under atmospheric conditions. The experiments were carried out far downstream of the injector exit since the interest here is to study the evaporation of the clusters formed due to the interaction of droplets with the turbulent air entrained into the spray. The interferometric laser imaging for droplet sizing (ILIDS) technique was used to measure the size and velocity of the individual droplets. The cluster length scale and interdroplet spacing within individual clusters were obtained by Voronoi analysis of the Mie scattering images of the spray droplets acquired by application of the PIV technique. This facilitated the evaluation of the Group number,  $G$, of droplet clouds corresponding to the clusters of droplets. In addition,
 $G$ could also be measured for the sparse droplet clouds in ‘voids’ that refer to the dilute regions of the spray where the droplet number density is much lower than the average. Apart from the intuitive scepticism on the possibility of droplet group evaporation far downstream of the injector (where droplet number density is low), some important questions emerge on the collective evaporation of droplet clouds in the spray, as mentioned in the following. Some of the past studies illustrated that the cluster length scale is not unique, rather ranges from small- to large-scale turbulent eddies of the airflow (Obligado et al. Reference Obligado, Teitelbaum, Cartellier, Mininni and Bourgoin2014; Sumbekova et al. Reference Sumbekova, Cartellier, Aliseda and Bourgoin2017; Manish & Sahu Reference Manish and Sahu2018). Consequently, a key concern arises if such a multiscale clustering process can lead to multimode evaporation of the droplet clusters (simultaneous occurrence of the different group evaporation modes as described earlier in a spray). Can we always assume that
 $G \ll 1$ in voids, in other words, should isolated droplet evaporation mode always prevail in such cases since the droplets are sparsely distributed? Is
 $G$ unique at a given location in the spray, and if not, then how does the distribution of
 $G$ evolve spatially, especially downstream of the injector? Do small- and large-scale droplet clusters vaporize in a similar way, or how does the
 $G$ value of a cluster vary with its size? Finally, can we correlate the
 $G$ value of a cluster to the evaporation rate of the droplets therein? We attempt to address the above questions in this work with an objective of throwing some light on the physics of the group evaporation of droplet clouds in sprays.
The paper is structured as follows. Section 2 provides a description of the experimental set-up and the laser diagnostic tools and image analysis employed in the current study. Section 3 presents and discusses the experimental results, including the characterization of the droplet clusters in the evaporating spray, followed by the measurement of the Group number for the droplet clouds. An attempt is made to correlate the Group number with the droplet evaporation rate in the clusters. Section 4 summarizes the work and highlights the key findings.
2. Methodology
2.1. Experimental set-up
A commercially available air-assist atomizer (internal mixing type, 1/4 J series from Spraying Systems Co) was used to generate the acetone spray. Such twin-fluid atomizer atomizers are commonly used in industrial burners and aero engines (Lefebvre & McDonell Reference Lefebvre and McDonell2017). The experimental arrangement is depicted in figure 1(a), which shows that the injector is housed in a spray test rig. The injector receives the atomizing liquid (acetone ( ${\rm C}_3{\rm H}_6{\rm O}$) in the present case) from one end at an injection pressure of 2 bar and air from the other end, where the injection pressure was maintained at 3 bar. The mixture of the two fluids is ejected through an orifice (1 mm diameter) provided in the mixing chamber or fluid cap. Acetone naturally evaporates owing to its high vapour pressure under the current ambient conditions (1 bar and 298 K). Since no liquid preheating was needed to achieve spray evaporation, acetone was selected as the working fluid. The volumetric flow rates of both fluids were regulated using respective rotameters. In all the experiments, the volume flow rates of air and acetone were maintained at 15 lpm and
 $25\ {\rm ml}\ \min ^{-1}$, respectively. The atomizer was traversed along the axial (
 $Z$) and radial (
 $R$) directions, and the droplet measurements were obtained at different radial and axial measurement stations in the spray using two optical techniques viz. PIV and ILIDS. Both techniques utilized the same key instruments (laser, optics, camera, lens, synchronizing device) but had different optical arrangements, as shown in figure 1(b) and explained below.
(a) Schematic of the experimental set-up and (b) optical arrangement for application of the PIV and ILIDS techniques for spray measurement (top view is shown).

2.2. Diagnostics
2.2.1. Particle image velocimetry
For PIV experiments (see figure 1b), a laser sheet (height, 5 cm; beam waist,  $\sim$1 mm) was generated using a Nd:YAG double-pulse laser (Quantel: EverGreen with
 $145\ {\rm mJ}\ {\rm pulse}^{-1}$ and 532 nm wavelength). The scattered light from the droplets was captured using a charge-coupled device (CCD) camera (PCO Pixelfly: 14-bit,
 $1040 \times 1392\ {\rm pixels}^{2}$). The camera was equipped with a collecting lens (Sigma Macro, 150 mm,
 $f/2.8$) and the viewing area was approximately
 $1.2 \times 1.6\ {\rm cm}^{2}$. The viewing area is chosen such that the corresponding spatial resolution allows imaging the individual spray droplets, which is essential for the calculation of Voronoi cells around the centre of droplets and subsequent identification of droplet clusters. The spatial resolution was
 $12\ \mathrm {\mu }{\rm m}\ {\rm pixel}^{-1}$, and the corresponding magnification was 0.52. A data acquisition (DAQ) system was used to synchronize the camera and laser, and it was controlled using the LABVIEW software. For each experiment, a series of 1000 double-frame images was captured, which was found to ensure statistical convergence of all measured parameters. The spatial location of the droplets was identified from the first frame of each image pair, and subsequently, the droplet clusters were identified using Voronoi analysis (this will be explained later). The spray velocity was measured using both frames of the image pair. The images were processed using in-house MATLAB codes. The PIV measurements were obtained at different axial positions in the spray (at
 $Z = 30$ cm, 45 cm and 60 cm downstream of the injector exit) and radial positions starting from the injector axis up to the edge of the spray.
2.2.2. Interferometric laser imaging for droplet sizing
The ILIDS technique was used to measure the size and velocity of individual droplets. It is a planar defocusing technique where each droplet is imaged as an interferogram when illuminated by a coherent laser source. The formation of the interferogram or fringe pattern is due to the interference of reflected and first-order refracted light from a droplet on a defocus plane, and the number of fringes is proportional to the droplet size (Hardalupas et al. Reference Hardalupas, Sahu, Taylor and Zarogoulidis2010; Tropea Reference Tropea2011). In the present experiments, the orientation of the ILIDS imaging unit (CCD camera and lens) with respect to the laser sheet corresponded to a forward scattering angle,  $\theta = 70^{\circ }$ (see figure 1b), which ensures that the interference intensity is the maximum. The camera viewing area was approximately
 $1.0 \times 1.4\ {\rm cm}^2$. Since the camera axis is not perpendicular to the laser sheet, the image is not evenly focused. Thus, the size of the droplet fringe patterns varies across an image, which may lead to higher uncertainty in droplet sizing during image processing. Thus, a Scheimpflug mount was used to tilt the camera relative to the collecting lens so that the degree of defocusing was uniform across an image, and a nearly uniform fringe pattern length was ensured. A pair of cylindrical lenses was incorporated between the camera and lens to optically compress the interferograms in the vertical direction. This way, the droplet fringe pattern is rectangular, and this approach enhances the limit of measurable droplet number density (by minimizing overlapping) and leads to a high signal-to-noise ratio (Maeda, Kawaguchi & Hishida Reference Maeda, Kawaguchi and Hishida2000). A rectangular aperture was mounted on the lens to control the light collection angle. Similar to PIV, ILIDS image pairs were captured using the double-pulse laser with an adequate time interval between the two frames such that the same droplet fringe pattern could be tracked in both images. Thus, the droplet velocity is obtained from the measurement of the displacement vector of a droplet. This is in contrast to PIV, where the measured spray velocity refers to the average velocity of droplets of different sizes that appear in an interrogation window. The ILIDS measurements were acquired at the spatial locations identical to the PIV measurements. The ILIDS images were processed using dedicated in-house image processing software based on MATLAB. For further details on the current optical set-up and image processing algorithm of the ILIDS technique, and the comparison of droplet velocity measurement with PIV technique, the readers are referred to Manish & Sahu (Reference Manish and Sahu2019) and Manish (Reference Manish2019).
2.3. Evaluation of Group evaporation number of droplet clusters
As mentioned earlier, the non-dimensional Group number characterizes the collective gasification behaviour of a cloud of droplets such that a higher value of  $G$ refers to a lower evaporation rate of droplets in the cloud. According to the model proposed by Chiu and coworkers (Chiu & Liu Reference Chiu and Liu1977; Chiu et al. Reference Chiu, Kim and Croke1982; Kim & Chiu Reference Kim and Chiu1983), for a spherical cloud containing monosized droplets,
 $G$ can be expressed as
 \begin{equation} G = 1.5(1+0.276Re^{0.5}Sc^{0.33}) n_T^{2/3} Le D/{l_d}, \end{equation}
where  $Re$ is the droplet Reynolds number,
 $Re (=V_{d}D/\nu$, where
 $V_d$ and
 $D$ are velocity and size of droplets in the cloud, respectively, and
 $\nu$ is the kinematic viscosity of air), while
 $Sc (=\nu /D_{m})$ and
 $Le (=\alpha /D_{m})$ are the gas Schmidt and Lewis numbers (where
 $\alpha$ and
 $D_{m}$ are the thermal diffusivity and mass diffusivity of fuel vapour in air, respectively). As per (2.1), the magnitude of
 $G$ essentially depends on the droplet diameter (
 $D$), number of droplets (
 $n_T$) and average interdroplet spacing (
 $l_d$). It should be noted that while the above expression for
 $G$ is derived for a single cloud containing droplets of the same size, its application to practical sprays is not straightforward. It is because of the following concerns. First, a spray is characterized by broad distribution of droplet size. Also, the interseparation distance is not unique. Next, an important question arises: Should the Group number be defined for the entire spray (considering all droplets)? Considering that preferential accumulation of droplets leads to high local droplet concentration resulting in the formation of clusters (Sumbekova et al. Reference Sumbekova, Cartellier, Aliseda and Bourgoin2017; Manish & Sahu Reference Manish and Sahu2021; Pandurangan & Sahu Reference Pandurangan and Sahu2022), and the evaporation rate of all droplets in the spray is not the same since a droplet within a cluster experiences different boundary conditions compared with an isolated droplet, thus, defining
 $G$ for the whole spray may not be logical. This means that one needs to evaluate
 $G$ for individual clusters of droplets. This, in turn, necessitates the identification of the droplet clusters in the spray. Since the clusters are dynamic quantities and evolve with time, it is essential to characterize instantaneous droplet clusters. In this context, we use the Voronoi analysis, which has the unique ability for instantaneous measurement of droplet clusters (in contrast to most of the other methods that only provide a statistical description). A Voronoi cell refers to an area or ensemble of points around a node or a droplet centre such that all the points are closer to that node than any other. A Voronoi cell area depends on the separation distance among neighbouring droplets such that a smaller Voronoi area indicates higher local droplet concentration. Accordingly, determining the Voronoi areas in a spray image can facilitate the detection of droplet clusters, and the Group number can thus be evaluated for individual clusters (Monchaux, Bourgoin & Cartellier Reference Monchaux, Bourgoin and Cartellier2010).
In the current work, the droplet clusters are identified by application of Voronoi analysis of the first image of the PIV image pairs (though the results are found to be the same if the second image is used). Accordingly, the Group number is evaluated for individual droplet clusters identified in the PIV images. For the current injector operating flow conditions, the droplet Reynolds number,  $Re$ (
 $=V_d D/\nu$, where
 $\nu$ is the kinematic viscosity of air) is small (
 $Re \sim O(0.1)$, when based on the average droplet size and slip velocity) and for the mixture of acetone vapour and air,
 $Sc \approx 1$ and
 $Le \approx 1$ (Sahu et al. Reference Sahu, Hardalupas and Taylor2018a; Balasubramaniyan et al. Reference Balasubramaniyan, Pandurangan and Sahu2023). Hence (2.1) simplifies to
 \begin{equation} G = 1.5 n_T^{2/3}{D}/{l_d}. \end{equation}
Equation (2.2) is only applicable when the relative velocity between droplet and the surrounding gas flow is negligible, as in the present case (this will be discussed later in detail). Such simplification of the Group number expression has been documented in several past works (e.g. Akamatsu et al. Reference Akamatsu, Miutani, Katsuki, Tsushima and Cho1996; Chen & Gomez Reference Chen and Gomez1997; Sornek & Dobashi Reference Sornek and Dobashi2000; Sahu et al. Reference Sahu, Hardalupas and Taylor2018a). Nevertheless, the above studies did not measure  $G$ for instantaneous droplet clusters based on spatial measurement of droplets, as reported in our current work. We note that the current experimental techniques are restricted to two-dimensional imaging of the spray droplets such that a cross-sectional view of the droplet clusters is always obtained. On the other hand, droplet clusters are three-dimensional entities. Hence, the measurement of absolute number count (
 $n_{T}$) in a cluster is not possible. Nevertheless, it is possible to relate
 $n_{T}$ with the cluster size and interdroplet spacing, which are measurable. However, in most of the earlier studies, a cluster was assumed to be spherical such that the circle equivalent diameter was measured based on the projected area of the cluster in an image, and this is not valid, especially for large-scale clusters, which typically evolve along some direction. In the current study, we assume that a cluster has a spheroid shape (defined by a major axis,
 $L_{c,maj}$ and minor axis,
 $L_{c,min}$), and the droplets within the cluster are uniformly distributed. Thus, the volume of the spheroid can be approximated as
 $n_T \times {\rm \pi}{l^{3}_{d}}/6$. So, for a spheroidal cloud,
 \begin{equation} n_T = L_{c, maj}{L^{2}_{c, min}}/{l^{3}_{d}}. \end{equation}
Thus, (2.2) can be expressed as
 \begin{equation} G = 1.5 {L^{2/3}_{c, maj}}{L^{4/3}_{c, min}}{D}/{l^{3}_{d}}. \end{equation}
To calculate the Group number as per the above equation, for each droplet cluster in the spray, the characteristic length scales, average interdroplet distance and droplet size need to be known. The droplet clusters are characterized by the calculation of Voronoi tessellations around each droplet in a PIV image, while the ILIDS technique provides the characteristic droplet size as discussed below. The flow chart for the identification of droplet clusters and the calculation of  $G$ is presented in figure 2, and the algorithm is discussed below. We note here that, in principle, the Group number can be calculated according to (2.1) for locations closer to the injector exit. Nevertheless, this requires measurement of Reynolds number of droplets in addition to the cluster properties to account for the convective effect. However, the limitations of the laser diagnostic tools to probe into denser spray zones pose challenges for such measurements. The main concern is the identification of individual droplets in the PIV image, which is essential for the application of Voronoi analysis to identify droplet clusters. Because the droplet number density is high and multiple scattering is significant at such locations, achieving the necessary spatial resolution to avoid imaging multiple droplets in a single pixel is difficult. Additionally, to obtain the droplet Reynolds number, it is necessary to measure the gas velocity around the droplets as well. However, two-phase measurement in dense regions is very challenging, and the existing techniques have limited capability to achieve this (Sahu et al. Reference Sahu, Manish and Hardalupas2018b). It is also worth mentioning here that in the near-nozzle locations, the droplet momentum is high since the initial injection momentum is retained. In such a scenario, the likelihood of droplets forming clusters due to interaction with surrounding turbulent flow is reduced.
Flow chart to calculate the Group number for a single cluster identified in the acetone spray.

2.3.1. Algorithm
A raw PIV image (8-bit greyscale) is shown in figure 2(a). The greyscale image is binarized to identify the position of the droplets. The binary image containing the centres of the identified droplets is shown in figure 2(b). In the next step, the Voronoi cells are drawn around the droplet centroids to identify the droplet clusters. The algorithm for processing the PIV images to identify and characterize the droplet clusters using Voronoi analysis can be found in Manish & Sahu (Reference Manish and Sahu2018). In the first step, the individual Voronoi cell areas ( $A$) are calculated. This is followed by the comparison of the probability density function (p.d.f.) of the normalized Voronoi area,
 ${A/\bar {A}}$ obtained with that for the distribution of droplets according to the random Poisson process (RPP), as shown in figure 2(c). Depending on the area of a Voronoi cell, if it is smaller than the first intersection point or larger than the second intersection point, it is classified as cluster and void cells, respectively. The groups of those cluster cells, which share a common vertex with the adjacent cells, are identified as individual clusters. Individual voids are also detected using the same logic. The identified clusters and voids are marked using red and grey colours, respectively, as shown in figure 2(d). The area (
 $A_c$) and length scale (
 $L_c$) of all the individual clusters and voids are calculated. A close-up view of a droplet cluster is depicted in figure 2(e) as an example. An equivalent ellipse is defined with the same area,
 $A_c$, and perimeter,
 $P_c$ of the droplet cluster as shown in figure 2(f). Accordingly, the major and minor axes of the ellipse are calculated, which, respectively, correspond to
 $L_{c,maj}$ and
 $L_{c,min}$ of the spheroidal droplet cloud defined in (2.4). Since the ratio
 $L_{c,maj}$/
 $L_{c,min}$ is found to be always larger than unity (in the range 2–15), this corroborates the earlier assumption to consider the droplet clusters as spheroids (see (2.3)) instead of spheres, and thus defining circle equivalent diameter of a cluster is not meaningful. In fact, the latter approach (i.e.
 $L_c \sim \sqrt {A_c}$) significantly underestimates the length scale of droplet clusters (Manish & Sahu Reference Manish and Sahu2018).
The average interdroplet spacing ( $l_d$) within a cluster is calculated by using the Delaunay triangulation method (figure 2h). The Delaunay triangles correspond to the Voronoi cells in the sense that the circumcentres of the former are the vertices of the latter. In this approach, the ‘actual’ neighbouring droplets around a test droplet can be identified, which are connected to the test droplet by lines. These lines refer to the edges of the triangles formed by considering the test droplet as one of the vertices. Figure 2(h) depicts the edges for all droplets within the droplet cluster shown in figure 2(e). The interdroplet spacing was calculated as the average of all the edge lengths.
As mentioned earlier, the droplet size distribution is measured by processing the ILIDS images, where each droplet is captured as an interferogram. A sample ILIDS image and an enlarged view of an interferogram are shown in figure 2(i). The droplet diameter is measured by counting the number of fringes in the interferogram pattern. For each experiment, in total, 1500 images are captured and processed. The arithmetic mean diameter (AMD) of all droplets in an image ensemble is obtained. The droplet size within a cluster, which is used for the evaluation of the Group number (see (2.4)), is approximated as the AMD of all droplets. We note that Boddapati, Manish & Sahu (Reference Boddapati, Manish and Sahu2020) found that the size distribution of the droplets corresponding to the droplet clusters is not the same as the overall size distribution considering all droplets (in clusters, voids or otherwise). However, the difference in the characteristic droplet size is insignificant and would not be detrimental to the estimation of the Group number. Also, it is found that the use of any other characteristic droplet size (for instance, Sauter mean diameter (SMD) instead of using AMD), does not modify the Group number significantly. For instance, at  $Z = 30$ cm, the average
 $G$ increases from 0.6 to 1.1 if SMD is used in the place of AMD, however, the group mode can still be considered as the internal vaporization mode.
Following the above procedure, the Group number was calculated for all droplet clusters identified in an image ensemble. Considering that the Voronoi analysis can also characterize the voids (or the region where the droplet concentration is much lower than the average concentration), the Group number was evaluated for individual voids as well. The method used for calculating the Group number for voids is the same as that for droplet clusters and, therefore, not repeated here. Note that from here onward, the term ‘droplet cloud’ refers to groups of droplets in either clusters or voids.
3. Results and discussion
In this section, we first present the results on the acetone spray characteristics and droplet Stokes number, followed by the characterization of the droplet clusters. Finally, the results on the Group number of droplet clusters are presented and discussed.
3.1. Spray characteristics and droplet response to air turbulence
3.1.1. Droplet size distribution
Figure 3 presents the histograms of the measured droplet size distribution at different axial and radial locations within the spray. The AMD and SMD of the droplet size distribution are evaluated for all the locations, and the corresponding statistical uncertainty (with 95 % confidence interval) is found to be approximately  $\pm$2 % and
 $\pm$7 %, respectively. Both the characteristic sizes are shown in all the plots in the above-mentioned figure. It is observed that for locations farther downstream of the injector exit, the droplet size distribution is narrower and shifts towards smaller droplet sizes, and accordingly, both AMD and SMD are smaller. As anticipated, this is due to the evaporation of the acetone droplets. Due to the high vapour pressure of acetone, the droplets vaporize as they are transported farther downstream. Also, notice that, at a given axial location, the characteristic droplet sizes are lower radially away from the injector axis. This may be explained by considering the reduction of the droplet number density in the radial direction in the current solid cone spray. Accordingly, towards the spray edge, the local airflow field is expected to be further below the saturated vapour condition. Thus, the droplet evaporation rate is higher, and the characteristic droplet size is lower in the radial direction. It is found that the characteristic droplet size was found to be always smaller than the Kolmogorov length scale,
 $\eta$ for all measurement locations (
 ${\rm SMD}/\eta < 1$). Hence, the finite size effects due to droplets such as the wake effect can be considered negligible. The method to estimate the Kolmogorov scales will be discussed in the next section.
Droplet size distribution at different radial measurement stations in the acetone spray for the axial locations at (a)  $Z = 30$ cm, (b)
 $Z = 45$ cm, (c)
 $Z = 60$ cm.

It is worth mentioning here that we theoretically evaluated the transport distance travelled by an acetone droplet injected at the axial location at  $Z =30$ cm, using
 $d^{2}$-law (Spalding Reference Spalding1951). It is assumed that the initial droplet size is the same as the characteristic droplet size (either AMD or SMD) at the above location, while the initial velocity of the droplet is equal to the mean droplet velocity measured at the same location. The vapour mass fraction around the droplet was assumed to be 10 % of the corresponding saturation condition corresponding to the room temperature (Sahu et al. Reference Sahu, Hardalupas and Taylor2018a). Interestingly, it is found that as per the above model, the droplet vaporizes completely within a distance of approximately 15 cm (this means before reaching the
 $Z = 45$ cm location in the spray). Incorporating the convection correction (due to the relative velocity between the droplet and airflow) resulted in a negligible difference in the obtained result. The above observation is in contrast to the experimental observation that the characteristic droplet size reduces only by approximately 30 % from
 $Z = 30$ to 60 cm. These results signify the reduction in the evaporation rate of the spray droplets (in comparison with the vaporization of the droplets under isolated conditions), and our effort is to understand the role of group evaporation of droplet clusters in this regard.
3.1.2. Droplet Stokes number
The formation of particle clusters in particle-laden turbulent flows is largely dictated by the particle response to the carrier flow turbulence. In the present case, in order to assess the response of the spray droplets to the turbulent airflow entrained into the spray, it is important to evaluate the droplet Stokes number ( $St$), which is defined as
 $St = \tau _d/\tau _f$. Here, the droplet response time,
 $\tau _d=\rho _l{D^2}/18\mu$, where
 ${\rho }_l$ and
 $\mu$ are the liquid density and gas viscosity,
 $D$ is the droplet size. Since the droplet size distribution is polydisperse in the current spray (figure 3), we evaluate
 $St$ by considering both characteristic droplet diameters (AMD and SMD) as representative droplet sizes. The characteristic time scale (
 $\tau _f$) of the turbulent gas flow surrounding the droplets was evaluated as some characteristic length scale of the turbulent eddies and the root mean square (r.m.s.) of fluctuations of the gas velocity,
 $u_{gr}$. In this work, the Stokes number,
 $St$ is calculated based on the smallest eddy, i.e. the Kolmogorov time scale, as well as the large eddy time scale (denoted as
 $St_\eta$ and
 $St_L$, respectively). Depending on the magnitude of
 $St$ relative to unity, the droplets can be treated as either flow tracers (when
 $St \ll 1$) or non-responsive particles (
 $St \gg 1$). The large eddy time scale was estimated as the ratio of the spray half-width,
 $R_{1/2}$, (which is identified as the location where the droplet velocity (obtained from PIV) is half of the centreline velocity) and
 $u_{gr}$ (which was obtained from the velocity of the tracer droplets (
 $D < 15\ \mathrm {\mu }{\rm m}$) in the ILIDS technique that is assumed to follow gas flow faithfully). Since, for the tracer droplets,
 $St_L < 0.01$, this justifies the above assumption as it indicates that the droplets act as flow tracers for the large-scale turbulent eddies. This is further corroborated by the fact that the droplet Reynolds number is small (
 $Re \sim 0.1$, as mentioned earlier). In fact, such results are very much expected since the measurement location is far downstream of the injector exit (
 $Z/d_o > 300$, where
 $d_o$ is the injector orifice size) such that the droplet–gas slip velocity is small, and the droplet dynamics is mostly controlled by the entrained air turbulence (Sahu, Hardalupas & Taylor Reference Sahu, Hardalupas and Taylor2014). The Kolmogorov scales were obtained by estimating the turbulence dissipation rate from
 $R_{1/2}$ and
 $u_{gr}$. Such an approach for the estimation of Stokes number has been reported in many research works in the past where only the dispersed phase is measured (e.g. Prevost et al. (Reference Prevost, Boree, Nuglisch and Charnay1996), Ferrand, Bazile & Boree (Reference Ferrand, Bazile and Boree2001), Sahu et al. (Reference Sahu, Hardalupas and Taylor2018a), Manish & Sahu (Reference Manish and Sahu2018), Manish & Sahu (Reference Manish and Sahu2019) and Pandurangan & Sahu (Reference Pandurangan and Sahu2022), to name a few). We note here that direct measurement of gas velocity in the presence of droplets is difficult since the phase-discrimination is often challenging due to the cross-talk between the two phases (Sahu et al. Reference Sahu, Hardalupas and Taylor2018a). Such challenges are escalated when the local droplet number density is high (e.g. due to clustering). In dilute spray-laden flows (where droplets are loaded in the airflow, e.g. in wind tunnels), the air velocity can be independently measured without adding particles, and the Stokes number can be accordingly obtained. However, in contrast, such an approach cannot be adopted in a spray, where the entrained airflow field is always coupled to the injected spray momentum, so that it is not possible to measure the air flow in the absence of the spray droplets. Hence, in the current work, the small droplets are selected as flow tracers.
The radial variation of droplet Stokes number at different axial locations (based on local AMD and SMD) are shown in figures 4(a) and 4(b), respectively. This way, one can elucidate on the influence of size polydispersity on droplet response to the air turbulence. It is observed that both  $St_\eta$ and
 $St_L$ decrease along the radial direction. It can be attributed to two factors. First, there is a decrease in droplet size in the radial direction, as discussed earlier. Second, near to spray edge, the gas phase velocity decreases, which in turn increases the airflow time scale. As the spray loses momentum downstream of the injector, the time scale of turbulent eddies is larger; hence, the droplet Stokes number is smaller from
 $Z = 30$ to 60 cm. Since SMD is always higher than AMD at all measurement locations, the droplet Stokes number based on SMD is also higher. Interestingly,
 $St_\eta \sim O(1)$ for all locations indicates (open symbols in figure 4) the partial response of the droplets to the smallest eddies of turbulence. In such a case, the clustering behaviour of the droplets is sensitive to the magnitude of
 $St_\eta$. For instance, close to the spray centre (
 $R = 0$ mm) and at
 $Z = 30$ cm,
 $St_\eta \sim 0.2$ and 0.8 when based on AMD and SMD, respectively. Thus, the droplet centrifuging effect is expected to be higher for the larger droplets, which show poorer response to the viscous eddies. Hence, preferential segregation of the droplets according to their size is expected. On the other hand,
 $St_L$ is always approximately 0.1 or smaller, which implies mostly good droplet response to the large-scale eddies of the turbulent airflow. In such a case, the choice of AMD or SMD is not crucial to calculate
 $St_L$ and thus to understand the droplet behaviour.
Radial variation of droplet Stokes number based on (a) AMD and (b) SMD at different axial locations in the acetone spray.

We further add here that in the current experiments the ratio of terminal velocity of particles,  $v_t (=\tau _{d}g$, where
 $\tau _d$ is the particle relaxation time and
 $g$ is the acceleration due to gravity) to the Kolmogorov velocity scale (
 $u_{\eta }$) is found to be very small (
 $v_t/u_{\eta } \sim 0.01\unicode{x2013}0.04$), which indicates that the role of gravity on droplet dynamics is negligible. Hence, the influence of droplet clustering on particle settling (Aliseda et al. Reference Aliseda, Cartellier, Hainaux and Lasheras2002) may be considered insignificant.
3.2. Characterization of droplet clusters and voids and Group number distribution
As discussed earlier, the evaluation of the Group number of droplet clusters demands characterization of the cluster geometry and the interdroplet spacing among the droplets. Figure 5 presents some key droplet cluster characteristics at different axial measurement stations along the spray axis at  $Z = 30$ cm, 45 cm and 60 cm. Figures 5(a) and 5(b) compare the p.d.f.s of the normalized cluster length scale based on the major and minor axes (
 $L_{c,maj}$ and
 $L_{c,min}$) of the droplet clusters, respectively (refer to § 2.3). For a given measurement station, the cluster length scales are normalized by both spray half-width,
 $R_{1/2}$ (that refers to the length scale of large-scale eddies) and the Kolmogorov length scale,
 $\eta$ corresponding to that location. Notice that for all the locations, the cluster length scale,
 $L_{c,maj}$ is broadly distributed and varies over two orders (
 $L_{c,maj} \sim 0.01\unicode{x2013}1 R_{1/2}$ or
 $5\unicode{x2013}200 \eta$). On the other hand, although
 $L_{c,min}$ is also nearly spread over two orders (
 $L_{c,min} \sim 0.001\unicode{x2013}0.1 R_{1/2}$ or
 $1\unicode{x2013}50\eta$), the corresponding range is narrower. Thus, the dominant length scale of the clusters is governed by eddies across the turbulent spectrum, while the small eddies dictate the subservient length scale. The above results highlight that the droplet clustering in the spray is a multiscale phenomenon, which is corroborated by the wide range of droplet Stokes numbers realized at all the measurement locations in the present experiments (see figure 4). This means that clustering is not restricted to droplets with
 $St_\eta$ close to unity, and preferential accumulation of droplets takes place at different gas flow turbulent scales simultaneously. Such a multiscale clustering process has also been identified in particle-laden homogeneous and isotropic turbulent flows (Obligado et al. Reference Obligado, Teitelbaum, Cartellier, Mininni and Bourgoin2014; Sumbekova et al. Reference Sumbekova, Cartellier, Aliseda and Bourgoin2017) as well as in sprays (Lian, Charalampous & Hardalupas Reference Lian, Charalampous and Hardalupas2013; Manish & Sahu Reference Manish and Sahu2018; Pandurangan & Sahu Reference Pandurangan and Sahu2022). Nevertheless, in all the p.d.f.s in figure 5, a peak is observed for cluster scale
 $L_{c,maj}$ around 20
 $\eta$, which indicates a characteristic cluster size at each downstream location. Also, a decay region follows the peak. Interestingly, the p.d.f.s of
 $L_{c,maj}$ for different axial locations have a common slope (
 ${\sim }-7/2$) (figure 5a). Similar results are observed for
 $L_{c,min}$ in figure 5(b); however, the corresponding slope is higher (
 ${\sim }-11/2$), implying that the probability of larger
 $L_{c,min}$ (that scales with large eddies of turbulence) is low. In figure 5, the p.d.f.s of cluster length scales collapse for different axial measurement locations in the spray where the local turbulent Reynolds number,
 $Re_{L} (=u_{gr}R_{1/2}/\nu$, where
 $u_{gr}$ is the gas r.m.s. velocity) changes in the axial direction (
 $Re_L$ decreases from 2800 to 2100 for
 $Z = 30$ to 60 cm). Similar results have been identified in our earlier study on water sprays from the air-assist injector for different liquid-to-air mass loading ratios (Manish & Sahu Reference Manish and Sahu2018). In addition, the p.d.f.s were also found to overlap for different radial locations at the same axial position in the spray. These results suggest self-similarity in the droplet cluster evolution process in the spray as the decay region in the plot of normalized cluster area (
 $A_c/\bar {A}_{c}$) is independent of the local airflow Reynolds number. Though not presented here, the power-law shape of p.d.f.s is also identified for the void length scale. Such behaviour is correlated to the self-similarity of coherent eddies, which satisfy the resonance between particles and eddies (Goto & Vassilicos Reference Goto and Vassilicos2006). We further note that the characteristic length scale of droplet clusters and voids corresponding to the peaks in the p.d.f.s (see figure 6a) is approximately 5 to 10 times smaller than the measurement window size, and much larger than the Kolmogorov scale (
 $\sim$20
 $\eta$) which is important to retrieve the average clustering properties (Mora et al. Reference Mora, Aliseda, Cartellier and Obligado2023). Although the large-scale droplet clusters are comparable to the spray half-width,
 $R_{1/2}$ (which is always larger than the size of the measurement window in the current experiments), the probability of such clusters is much lower. However, it can be noticed in the p.d.f. for the voids (figure 6a) that a sudden change occurs in the decay region for the large-scale voids with
 $L_{maj} \sim R_{1/2}$. This suggests that large voids are not completely resolved in the present case.
The p.d.f. of normalized droplet cluster length scales (a)  $L_{c, maj}$, and (b)
 $L_{c, min}$ and (c) normalized interdroplet spacing,
 $l_d$ within clusters for different axial measurement locations along the spray axis.

Comparison of p.d.f.s of (a) normalized cluster length scale, (b) normalized interdroplet spacing, and (c) Group evaporation number for clusters and voids in the spray at  $Z = 30$ cm from the injector exit.

The p.d.f.s shown in figures 5(a) and 5(b) indicate that the probability of smaller-size clusters (which scale with the Kolmogorov length scale) is higher. However, the large-size clusters (which scale with the large-scale eddies of turbulence) carry significant droplet mass and hence are also important as they can influence the overall spray evaporation rate. The above figures show that the p.d.f.s of the normalized cluster length scale for different axial locations are similar (the peak and the decay zone do not vary much). However, farther downstream of the injector, the maximum cluster size is observed to be smaller, and the probability of small clusters (left-hand side of the peak in the p.d.f.s) reduces. It can be explained by considering the significant reduction in both  $St_\eta$ and
 $St_L$ in the axial direction (figure 4). As
 $St_L$ is very small (approximately 0.01) for far-downstream locations, the droplets act as perfect flow tracers to the large eddies. Accordingly, their tendency for preferential accumulation reduces, and the length scale of the large clusters is smaller. Similarly,
 $St_\eta$ reduces significantly from
 $Z = 30$ to 60 cm, so that the probability of small-scale clusters is lower.
Figure 5(c) shows the results pertaining to the average interdroplet spacing ( $l_d$) between droplets within droplet clusters (which varies inversely with local droplet concentration) and strongly influences the
 $G$-number calculation (2.4). The p.d.f.s of the normalized interdroplet spacing (
 $l_d/{\rm AMD}$) for different axial locations are compared in figure 5(c), which shows that similar to the cluster size, the average droplet spacing in clusters is also widely distributed, especially for the location farther downstream of the spray. While at
 $Z = 30$ cm,
 $l_d/{\rm AMD}$ is approximately 2–20, it varies over a wider range of approximately 10–100 for
 $Z = 45$ and 60 cm. This implies that the local droplet concentration in clusters also varies accordingly. For all the cases, a peak in each p.d.f. is evident, which represents a characteristic droplet spacing. The peak shifts to the right in the axial direction, indicating that the local droplet number density is lower as the spray is wider downstream of the injector. It is worth mentioning here that although in some studies, a negligible effect due to the presence of neighbouring droplets on the droplet evaporation rate has been identified for
 $l_d > 8D$ or beyond (Imaoka & Sirignano Reference Imaoka and Sirignano2005b; Deprédurand, Castanet & Lemoine Reference Deprédurand, Castanet and Lemoine2010), those works considered a regular arrangement of droplets (e.g. droplet streams or arrays). In contrast, for droplets within clusters in a spray, the droplet evaporation rate would be affected even if
 $l_d$ is large since the vaporization rate of droplets depends on the local vapour saturation level, which, in turn, is governed by the local droplet concentration in the same cloud.
Now we compare the geometric characteristics of clusters and voids and also the corresponding Group number distributions. Figure 6 presents the results for the axial measurement location at  $Z = 30$ cm as an example. The p.d.f.s of the normalized length scales of clusters and voids (based on the major axis) are shown in figure 6(a). Notice that, similar to droplet clusters, the void size also varies over a wide range. Considering that the peaks in the p.d.f.s nearly overlap, this means that the small-scale clusters and voids are of similar size and scale with the Kolmogorov length scale of air turbulence. However, the probability of large-scale voids is higher compared with large-scale clusters. This means that the average size of the voids is larger compared with the clusters. Interestingly, the slope in the decay region is smaller for the voids. In figure 6(b), the p.d.f.s of interdroplet spacing for droplets in clusters, voids and overall spray are compared, which shows that droplet separation distance is much larger in voids due to lower droplet number count. Nevertheless, the group evaporation of droplets may still be important in voids, as discussed below. The p.d.f.s of Group number
 $G$ are presented in figure 6(c). It is interesting to notice that for both cases,
 $G$ is distributed over a wide range. However, while the range of
 $G$ is approximately 0.1–2 for voids, a much wider distribution is observed for clusters (for which
 $G$ varies in the range 0.1–30). For clusters, the results indicate the simultaneous occurrence of individual droplet evaporation and internal and external modes of droplet cloud evaporation in the acetone spray. On the other hand, in the case of voids, the individual droplet vaporization mode (
 $G \ll 1$) dominates, although it is interesting to notice that
 $G \sim 1$ for some voids. This highlights that collective evaporation of droplets can occur even in the dilute regions of the spray. Nevertheless, the number density of droplets in voids is much lower than that in clusters. Thus, the contribution of those droplets to the overall spray evaporation rate may not be crucial. Finally, the results in this section suggest that the collective vaporization mode of the droplet groups depends on the size of the clusters/voids, which itself varies across the spectrum of air turbulence. In other words, the multiscale clustering of droplets leads to multimode evaporation of the droplet clusters in the acetone spray. In the next section, we focus on the evolution of the Group number for the droplet groups in the clusters and voids (which are termed as droplet clouds here onwards) in the evaporating spray.
3.3. Evolution of Group number of droplet clouds in the evaporating spray
The p.d.f.s of Group number for droplet clusters and voids are compared in figures 7(a) and 7(b), respectively, for the three axial measurement locations. The subscripts ‘c’ and ‘v’ under  $G$ refer to Group numbers for droplet clusters and voids, respectively. For droplet clusters, the trends of the p.d.f.s of
 $G_c$ for the downstream locations,
 $Z = 45$ and 60 cm, are similar to that at
 $Z = 30$ cm (figure 7a). Thus, the Group number for clusters is not unique but varies over a range, implying multimode vaporization of the droplet clouds. Nevertheless, for locations farther downstream of the injector, the p.d.f. of
 $G_c$ (especially the higher range of
 $G_c$) shifts towards the left. Accordingly, the average of
 $G_c$ (represented as dashed lines) reduces in the axial direction. As the droplets are transported downstream of the injector, the spray is wider, and the characteristic size of the clusters/voids increases. However, the interdroplet spacing is larger (see figure 5c), or in other words, the droplet number density is smaller. As a result, the cloud evaporation mode tends to shift towards isolated droplet evaporation mode. Figure 7(b) shows that at
 $Z = 30$ cm,
 $G_v$ varies over a wide range (as discussed earlier). However, farther downstream, not only that the distribution of the Group number is narrower, but also
 $G_v$ is very small (<0.1). Accordingly, the mean of
 $G_v$ reduces significantly from
 $Z = 30$ to 60 cm, indicating that the droplets in voids mostly evaporate individually. This is again attributed to the reduction in local droplet number density at the spray downstream locations.
Comparison of p.d.f.s of Group number at different axial locations downstream of the injector for (a) clusters and (b) voids. The dashed lines represent the mean Group number,  $\bar {G}$.

3.3.1. Group number for small- and large-scale droplet clusters
Considering that, at all the measurement locations, multiscale clustering of droplets leads to the simultaneous occurrence of different evaporation modes of droplet clusters, hence the mean Group number,  $\bar {G}_c$, is inadequate to describe the group vaporization characteristics of all droplet clusters in the spray. For instance, at
 $Z = 30$ cm,
 $\bar {G}_c \sim 1$, which implies the internal mode of vaporization of droplet clouds (that refers to group evaporation of droplets at the core region of a cloud surrounded by evaporating individual droplets). However, the p.d.f. of
 $G_c$ for the above case indicates that
 $G_c$ can be as high as 10, which refers to the external mode of group evaporation. In this context, it is important to understand which cluster sizes correspond to high values of
 $G_c$. In other words, how the Group number for clusters varies according to their size. Since the droplet concentration or interdroplet spacing within a cluster dictates the collective vaporization behaviour of all droplets in a cloud, we first present the scatter plot on a log–log scale between normalized droplet spacing (
 $l_d/{\rm AMD}$) and cluster area (
 $A_c/\bar {A}_c$) for the axial measurement locations in figure 8(a). Some interesting trends for droplet spacing can be identified based on the size of a droplet cluster,
 $A_c$ relative to the average cluster size (
 $\bar {A}_c$). For cluster size,
 $A_c < \bar {A}_c$, the droplet spacing is larger for larger clusters (hence, droplet number density varies inversely with cluster size). This suggests power-law scaling of normalized droplet spacing with cluster size such that
 $l_d/{\rm AMD} \sim ({A_c/\bar {A}_c})^{m}$. However, for
 $A_c > \bar {A}_c$, the droplet spacing (or number density) is almost independent of the size of a cluster. Thus, in such cases, the number of droplets in a cluster increases proportionately with the cluster size. The above trend is similar for all axial locations, although the data points shift upward (along the
 $y$-axis) from
 $Z = 30$ to 60 cm, which is in agreement with the shifting of the p.d.f. of
 $l_d/{\rm AMD}$ as shown in figure 5(c). The above observations allow us to classify the droplet clusters into small and large categories, and accordingly, the group evaporation effects can be examined separately. Figure 8(a) also depicts the range of scales for normalized cluster length such that the cluster area can be correlated to the length scale of turbulent eddies. Hence, the droplet clusters with normalized area
 $A_c/\bar {A}_c < 1$ are considered as small clusters (which scale with Kolmogorov length,
 $\eta$), while the clusters for which
 $A_c/\bar {A}_c > 1$ are treated as large clusters (which are typically larger than approximately
 $20\eta$ and found to scale with large-scale turbulent eddies characterized by half-spray width,
 $R_{1/2}$). Figure 8(b) shows the p.d.f. of
 $A_c/\bar {A}_c$, which indicates that the probability of small clusters is always higher. However, even if the probability of occurrence of large clusters is low, the number of droplets contained in such clusters increases proportionally to the cluster size, as discussed above. Hence, the large clusters may play an important role in the overall spray evaporation rate. This will be further discussed in the next section. Now we present the scatter plot of Group number,
 $G_c$ and normalized cluster area in figure 8(c), which presents the results for all axial locations in the spray. Interestingly, distinct trends are identified for small and large clusters. For small clusters (
 $A_c/\bar {A}_c < 1$), as such, no specific correlation can be identified, i.e. for a given cluster size,
 $G_c$ varies over a wide range (from approximately 0.002 to 10). However, for the large clusters (
 $A_c/\bar {A}_c > 1$), the Group number is higher as the cluster size increases. This can be explained by considering that the droplet spacing does not vary with cluster size (figure 8a). Thus, as per (2.4), the Group number varies proportionately with the size of the droplet clusters.
(a) Scatter plot of normalized droplet spacing versus normalized cluster area. (b) The p.d.f. of normalized cluster area. (c) Group number versus normalized cluster area, for different axial locations downstream of the injector exit.

Though the Group number is high for many small clusters, their contribution to the overall spray evaporation rate may not be crucial. The significance of the evaporation rate of a cluster can be understood if we consider the percentage of droplet mass contained in a cluster compared with the total liquid mass of all droplets at a measurement station. In this context, we introduce a new parameter, viz. relative droplet cluster mass ( $\zeta$), which is defined as the ratio of the mass or volume of droplets present in a cluster to the mass or volume of all droplets within a measurement window at any instant of time. The parameter
 $\zeta$ can be expressed in terms of the number of identified droplets as discussed in the following. Here, the volume of droplets in a cluster is equal to the number of droplets in the cluster,
 $n_c$ times the volume mean diameter (VMD) of the droplets. Similarly, the volume of all droplets in the measurement window at an instant is the product of the total number of identified droplets,
 $n$ in an image and the VMD of all the droplets. Under the assumption that the droplet size distribution within a cluster is the same as that corresponding to the whole measurement window, the corresponding VMD are also the same. Thus,
 $\zeta$ can be defined as the ratio of
 $n_c$ and
 $n$ as per
 \begin{equation} \zeta = \frac{n_c}{n}. \end{equation}
The correlation between the instantaneous relative cluster mass,  $\zeta$ and the normalized cluster area is presented in figure 9 for different axial locations in the spray. The plots demonstrate an almost linear relationship, especially for large clusters (
 $A_{c} > \bar {A}_c$). Thus, as the cluster area is larger, the liquid mass contained within the cluster increases. We note that this is a consequence of the fact that the droplet spacing is independent of the cluster size (figure 8a), such that the number of droplets in clusters is proportional to the cluster area. It can be observed that for the downstream locations, the relative cluster mass increases. This can be attributed to the generation of larger clusters downstream of the spray, where the size of the turbulent eddies also increases. Accordingly, the number of droplets in the clusters is higher. Notice that the relative cluster mass,
 $\zeta$ in small clusters (
 $A_{c} < \bar {A}_c$) is always much smaller (<0.1). This is further highlighted in the plot for the cumulative density function (CDF) of
 $\zeta$ (figure 9), which indicates the percentage of liquid mass in the clusters below a given cluster relative to that in all clusters. Notice that for all small clusters (
 $A_{c}/\bar {A}_c <$ 1), the CDF is approximately 30 % at all locations. The CDF corresponding to
 $A_c/\bar {A}_c = 1$ increases (from 25 % to 35 %) downstream of the injector (from
 $Z = 30$ to 60 cm), which is due to the larger cluster size as explained above. The above results demonstrate that in spite of the high Group number for some of the small-scale clusters, their contribution towards overall spray evaporation is small since they carry a small fraction of liquid mass. On the other hand, even if the number of large-scale clusters is much less (compared with the small clusters), they carry a significant fraction of liquid mass. Hence, even if the
 $G$ number of those clusters is small, the reduced rate of droplet vaporization in the clusters would directly influence the global spray evaporation rate.
Scatter plot of normalized cluster area versus relative droplet concentration at three different axial locations (a)  $Z = 30$ cm, (b)
 $Z = 45$ cm and (c)
 $Z = 60$ cm. The CDF for each case is also shown.

3.3.2. Characteristic Group number for small- and large-scale droplet clusters
Now we calculate the characteristic Group number of droplet clusters, which refers to the mass-weighted average of the Group number,  $G_c$ of individual clusters and is expressed as
 \begin{equation} \bar{G}_{wt} = \frac{\sum{G_c}{n_c}}{\sum{n_c}}. \end{equation}
Here, the weighted average Group number,  $\bar {G}_{wt}$ is obtained for both small- and large-scale droplet clusters separately. Similar to the earlier analysis, it is assumed that the characteristic droplet size within clusters and that corresponding to all droplets in a measurement window is the same. Hence, instead of the liquid mass, the number count of droplets appears in (3.2). Figures 10(a) and 10(b) present the radial evaluation of
 $\bar {G}_{wt}$ at different axial measurement locations for small- and large-scale droplet clusters, respectively. It can be observed that the weighted average Group number for large-scale clusters is approximately 2 to 5 times higher than that for the small-scale clusters at the same measurement location. Of particular interest is the observation at
 $Z = 30$ cm, where
 $\bar {G}_{wt}$ for small-scale clusters is less than unity, while for large-scale clusters, it exceeds unity. This suggests the occurrence of distinct modes of evaporation for the small- and large-scale clusters. While the droplets in the small clusters (
 $L_{c,maj} \sim O(\eta )$) primarily undergo either internal mode or isolated mode of evaporation, the large-scale clusters (
 $L_{c,maj} \sim O(R_{1/2})$) experience the external mode evaporation. Notice that in the radial direction,
 $\bar {G}_{wt}$ is smaller for small clusters. On the other hand, it either increases or remains nearly constant for the large clusters. While the above trend is identified for
 $Z = 30$ and 60 cm locations, far downstream of the injector
 $\bar {G}_{wt}$ is always smaller towards the spray boundary. As one moves downstream of the injector, the evaporation mode in the large-scale clusters undergoes a transition to the internal mode, which is primarily attributed to decrease in the droplet size due to evaporation and increase in interdroplet spacing.
Radial evolution of weighted average Group number,  $\bar {G}_{wt}$, at different axial locations in the acetone spray for (a) small-scale droplet clusters and (b) large-scale droplet clusters. The error bars indicate uncertainty with 95 % confidence interval.

3.4. Discussion
The measurement of the Group number of droplet clusters elucidates on the mode of vaporization of droplets within the cloud as demonstrated in the results presented so far. However, any knowledge of the correlation between  $G$ and the actual evaporation rate of droplets within a cloud is crucial to account for the group vaporization effect in modelling droplet evaporation rate in spray simulations. Unfortunately, direct measurement of the evaporation rate of individual droplets in a practical spray is not straightforward due to limitations in the experimental techniques to track a droplet in time over a sufficient distance. This is especially challenging for droplets in a cluster due to high local number density. In this context, as such, model development also has not been matured essentially due to droplet size polydispersity and non-unique interdroplet spacing in a spray. However, considerable modelling efforts have been put in the past for simplified configurations such as droplet arrays where the droplets are regularly spaced (Sirignano Reference Sirignano2010, Reference Sirignano2014). Following the model proposed by Imaoka & Sirignano (Reference Imaoka and Sirignano2005b) for a three-dimensional droplet array, we define a parameter
 $\eta _v$ which is the ratio of the evaporation rate of a droplet (
 $\dot {m}$) within an array to the rate of evaporation (
 $\dot {m}_{iso}$) of the same droplet when it vaporizes in an isolated manner under the same ambient pressure and temperature conditions. As per
 \begin{equation} {\eta}_v = \frac{\dot{m}}{\dot{m}_{iso}} = 1 - \frac{1}{1+0.725671{\xi}^{0.971716}}, \end{equation}
where the parameter  $\xi$ is defined in terms of interdroplet spacing (
 $l_d/D$) and the number of droplets in the array (
 $n_T$), as
 \begin{equation} \xi = \frac{2{l_d}/D}{{n^{0.72}_T}}. \end{equation}
Here,  $n_T$ is evaluated as per (2.3). In the present case, the parameter
 $\eta _v$ can be evaluated for individual droplet clusters (and voids), which are assumed as three-dimensional arrays in which the droplet size and droplet spacing are the same throughout the entity. This approach allows us to correlate
 $\eta _v$ and
 $G$ as shown in figure 11, which presents the results for the axial location at
 $Z = 30$ cm. For both clusters and voids,
 $\eta _v$ is close to unity for very small values of
 $G$ (
 $\sim$0.01), indicating an isolated mode of droplet evaporation. While
 $\eta _v$ is approximately 0.9 for
 $G = 0.1$, it is interesting to notice that
 $\eta _v$ reduces significantly for
 $G > 0.1$. In fact, for
 $G = 1$,
 $\eta _v$ is approximately 0.1 (which refers to a 90 % reduction in the droplet evaporation rate). This means that the droplet evaporation rate decreases considerably even for internal mode of group evaporation in the droplet clouds. For
 $G \sim 10$, which refers to the external mode of droplet evaporation,
 $\eta _v$ is approximately 0.001, which means a significant decrease in the droplet vaporization rate within a cloud when compared with the case when the neighbouring droplets are far away. The magnitude of
 $\eta _v$ for different limits of
 $G$ values, as discussed above, is identified for all measurement locations in the spray for both clusters and voids. Nevertheless, the fraction of clusters/voids below
 $G = 0.1$ is higher in the axial downstream or radial direction at an axial location such that the average
 $\eta _v$ is higher. This is further discussed in figure 12. However, it is worth noting here that as shown in figure 11(b), even in the voids or dilute regions in the spray, it may be important to account for droplet cloud vaporization effect in the modelling of droplet transport even in the voids or dilute regions of the spay as the current results demonstrate strong reduction in the vaporization rate of droplets (
 $\eta _v$ can be as low as 0.1).
Correlation between  $\eta _v$ and
 $G$ for (a) droplet clusters and (b) voids for the axial location at
 $Z = 30$ cm downstream of the injector exit.

Radial evolution of weighted average evaporation rate,  $\eta _v$ at different axial locations in the acetone spray for (a) small-scale droplet clusters and (b) large-scale droplet clusters. The maximum uncertainty among all the cases is used as the error bars, which is calculated with 95 % confidence interval.

The radial variation of the mass-weighted average of  $\eta _v$, i.e.
 $\bar {\eta }_v$ (which is obtained similarly to (3.2)), is presented in figures 12(a) and 12(b) for small- and large-scale droplet clusters, respectively. The values of
 $\bar {\eta }_v$ are indicative of the gross evaporation rate of droplets in clouds in comparison with an isolated droplet. It can be noticed that for both cases,
 $\bar {\eta }_v$ consistently increases towards unity for locations farther downstream of the injector exit. Also, a slight increase in
 $\bar {\eta }_v$ towards the spray boundary is observed. Compared with small clusters,
 $\bar {\eta }_v$ is smaller for large-scale clusters.
4. Conclusions
The group evaporation of droplet clouds in an evaporating acetone spray was experimentally investigated in this work. The spray was injected under ambient atmospheric conditions using an air-assist atomizer. The main objective is to measure the Group number ( $G$) of the droplet clouds that characterizes the vaporization mode of the clouds and signifies the extent of the collective mode of vaporization of the droplets contained therein. The measurement of
 $G$ demands characterization of the length scale of individual droplet clusters as well as droplet size and spacing. This was achieved by the application of the Voronoi analysis to the instantaneous PIV images. This approach has the unique ability to provide area, length scale and interdroplet spacing, not only for droplet clusters but also for voids, which refer to the dilute region in the spray that manifests as a consequence of the droplet clustering process. The ILIDS technique was used to measure the size and velocity of the individual droplets. The droplet measurements were obtained using both PIV and ILIDS techniques at different axial and radial locations in the spray. The experimental data were analysed with the aim of obtaining a comprehensive understanding of the evolution of the Group number of small- and large-scale clusters in the evaporating spray. A theoretical model was invoked to correlate
 $G$ with the droplet evaporation rate of individual clusters, and some interesting observations were identified. The major conclusions from this work are listed below.
(i) The characteristic droplet sizes (AMD and SMD) exhibit a decreasing trend in both radial and axial downstream directions in the evaporating spray. However, the axial reduction in droplet size is much smaller than that predicted by the
 $d^2$-law, which highlights the role of group evaporation of droplet clouds in reducing the droplet evaporation rate. The droplet Stokes number was evaluated based on ($St_\eta$ and $St_L$), which decreased both axially and radially in the spray. Since $St_\eta \sim O(1)$, this indicates the partial response of the droplets to the smallest eddies of turbulence, and in such cases, the clustering is sensitive to the droplet size. On the other hand, $St_L$ is approximately 0.1 or smaller, which implies that the droplet response to the large-scale turbulent eddies is good and almost independent of droplet size.
(ii) The p.d.f. of the cluster length scale demonstrated that clustering of the evaporating droplets occurs across the air turbulence spectrum. The size of the droplet clusters ranges from a few times the Kolmogorov scale up to the length scale of the large-scale eddies (represented by the spray half-width). Such multiscale clustering was found to lead to multimode group evaporation of the droplet clusters (which is characterized by a wide range of
$G$ (0.001 to 10) observed for all measurement locations). This refers to the coexistence of all group vaporization modes for the droplet clusters in the spray. Similar results were observed for droplets in the voids measured at the same location. However, the probability of large-size voids is higher compared with the clusters of the same size, and also, the interdroplet spacing is an order of magnitude higher in the voids. As a result, the p.d.f. of $G$ is narrower for voids and the corresponding peak shifts towards the isolated droplet evaporation mode. For measurement locations farther downstream of the injector, the p.d.f. of $G$ was found to be narrower (the probability of $G > 1$ was smaller) for both droplet clusters and voids, although this effect was significant for the latter. This is again due to an increase in cluster/void size and a reduction in droplet spacing within clusters/voids.(iii) The trend of interdroplet spacing versus cluster area allowed the classification of the droplet clusters into small-scale clusters (which scale with Kolmogorov length,
$\eta$ and are typically below 20$\eta$) and large-scale clusters (which are typically larger than 20$\eta$ and scale with large-scale turbulent eddies). While the normalized droplet spacing shows a power law scaling with the normalized area for small-scale clusters, it is almost invariant with the size of the large-scale clusters. Although the number probability of small-scale clusters is higher, and the corresponding Group number varies over a wide range, they contribute to approximately 30 % of the total liquid mass contained in the clusters. Accordingly, the mass-weighted average $G$ value is always low ($\leq $0.5). On the other hand, in spite of the lower probability of occurrence of large-scale clusters, they carry significant liquid mass. Moreover, in such cases, $G$ increases with cluster area, and the mass-weighted $G$ is approximately 2 to 5 times that of the small-scale clusters. Hence, a simple arithmetic average of $G$ values for all clusters could be misleading, as it provides very low $G$, and it is important to account for group effects in large-scale clusters for the prediction of the overall spray evaporation rate.(iv) The normalized droplet evaporation rate within a droplet cloud (relative to the isolated droplet evaporation scenario),
$\eta _v$ is calculated following a correlation proposed by Imaoka & Sirignano (Reference Imaoka and Sirignano2005b). It was assumed that the droplets within a cloud behave similarly to those in a three-dimensional droplet array. The results highlighted that for $G > 0.1$, $\eta _v$ reduces significantly, which means that even a moderately low value of $G$ (internal group mode) refers to the strong influence of the neighbouring droplets on the vaporization rate of a droplet in a cloud. In fact, $\eta _v \sim 0.1$ for $G = 1$ (which means a 90 % lower evaporation rate compared with an isolated droplet). For external mode ($G \sim 10$), $\eta _v \sim 0.01$, which suggests that the evaporation tends to cease, although occurrences of such clusters are rare. Interestingly, it is found that the reduction in droplet evaporation rate due to group evaporation is possible even in voids, which are considered as dilute regions in the spray.


Funding
This research received no specific grant from any funding agency, commercial or not-for-profit sectors.
Declaration of interests
The authors report no conflict of interest.


 Open access

