In periods of labor unrest and non-compliance, the withdrawal of workers’ services poses a clear threat to firms’ profitability. This was particularly evident in Norway during the interwar years, a time marked by intense labor disputes. Compared to its neighbors, Norway’s strike volume was considerably higher: 20 percent more than Sweden, 70 percent more than the United Kingdom, and—allowing wider comparisons—over 400 percent more than the United States and France.Footnote 1 As, for instance, Rosenberg (Reference Rosenberg1976) noted, the anticipation of such disruptions often drives a search for labor-saving machines.Footnote 2 This scenario prompts the question: Did the interwar strikes in Norway spur labor-saving innovations?
It is crucial to address this question for understanding the interplay between technological advancements and labor unrest. High levels of industrial action, like those in interwar Norway, offer insights into how such conditions might influence firms’ technology investment decisions more generally. Strikes are known to disrupt production and affect returns on capital investments (Card and Olson Reference Card and Olson1995; Franzosi Reference Franzosi1995; Dinardo and Hallock Reference Dinardo and Hallock2002). However, the nature and extent of their impact remain underexplored. Historical studies suggest two main mechanisms through which strikes might influence capital investment: what we denote the “cooling” mechanism and its counterpart, that we denote the “flexibility” mechanism.
The “cooling” mechanism proposes that employers adopt machinery to lessen worker militancy, thus reducing reliance on a potentially contentious workforce. Rosenberg (Reference Rosenberg1976) and Smiles (Reference Smiles1861) have highlighted how industrial conflict in nineteenth-century England led to such technological changes, specifically in conflict-prone industries.
Conversely, the “flexibility” mechanism suggests that firms might favor labor-intensive methods to maintain cost flexibility during strikes. With rising machinery costs, employers may opt to keep technologies that allow easy adjustment of labor costs during work stoppages. While less discussed, Smiles (Reference Smiles1861) and subsequent studies (Moene Reference Moene1983; Stone Reference Stone1974) illustrate the burdens of capital investments in volatile and strike-prone environments.
To empirically examine these mechanisms, we analyze a new dataset of strikes from the Norwegian trade union confederation, covering the years 1908 to 1939 (Rasmussen et al. Reference Rasmussen, Kjelsrud, Gjerløw, Kotsadam and Moene2025). This era, notable for its decentralized bargaining structure, high conflict volume, and technological shifts, provides a fertile ground for investigation.
Using these data, we regress machinery use against previous-year strike frequencies at the manufacturing-sector level. In these main specifications, where we employ sector and year fixed effects, we find a significant negative relationship between strikes and use of machinery, suggesting that labor disputes may lead firms to avoid investing in machinery and instead retain flexibility.
Our result is supported by historical examples from the period. For example, Jensås (Reference Jensås1972) notes that the firm A.S. Trondhjems Nagle & Spigerfabrik chose not to invest in new machines during the 1920s due, among other things, to the risk of lockouts and strikes (p. 30). After calm years in the 1930s, however, they decided to invest in new machines (p. 39).
Observe though, that strikes are not random events, so we cannot definitively claim a causal relationship behind our results. Yet several factors lead us to believe there is one. First, placebo regressions suggest that the relationship is unlikely to be reversed. Sensitivity tests also show that unobserved confounders with even half the influence of our main strike variable have minimal impact on our results, and neither is our result dependent on specific sectors or geographic regions. Second, and most importantly, we exploit that strikes were illegal during wage agreement periods and use the number of expiring wage agreements within sectors as an instrument for conflicts. This instrumental variable (IV) approach also identifies a negative relationship between strikes and firms’ capital intensity. Third, we find larger negative point estimates of broader industry- and national-level strikes that can be seen as more exogenous than firm-level strikes.
Our research enhances the understanding of industrial conflict’s effects on technological choice, contributing to economic history by examining consequences beyond incidence and duration. It therefore aligns with studies like the work of Dinardo and Hallock (Reference Dinardo and Hallock2002) on the stock market’s response to strikes, emphasizing the broader implications of labor unrest on economic dynamics. We expand further on how our study helps us understand technological investment decisions more broadly and more specifically in the context of the Norwegian inter-war period in the conclusion.
In the following sections, we delve into the historical context and outline our theoretical framework in the second section, describe our data collection and empirical strategy in the third and fourth sections, present our findings and discuss their implications in the fifth and sixth sections. We provide concluding remarks in the seventh section.
HISTORICAL CONTEXT: CONFLICTS AND NEW TECHNOLOGIES
The period in Norwegian history that we are examining was marked by the largest and most encompassing industrial conflicts in Norwegian history and considerable opportunities for innovation (Bergh et al. Reference Bergh, Hanisch, Lange and Øystein Pharo1983; Sandvik Reference Sandvik2022; Maurseth Reference Maurseth1977). In this regard, it resembles the early nineteenth-century English textile industry.
Labor-Saving Innovations in the English Textile Industry
In his 1976 book, Nathan Rosenberg, a renowned historian of technology, explored the factors driving technological change beyond shifts in relative factor prices (Rosenberg Reference Rosenberg1976, ch. 6). A key factor he identified was the perception among employers that worker non-compliance posed a serious threat to profitability. Rosenberg noted that, in nineteenth-century England, many scholars and social reformers posited that strikes often led to labor-saving innovations.
Smiles (Reference Smiles1861) highlighted several instances of this in his book, Workmen’s Earnings, Strikes, and Savings, particularly in the English textile industry. He documented cases where conflicts directly spurred innovation, such as the strike by spinners in Preston around 1830, which reportedly inspired the invention of Roberts’s self-acting mule (Smiles Reference Smiles1861, p. 134). Before this invention, Smiles explains, a small number of spinners could halt an entire factory’s operations. The self-acting mule, however, replaced these workers by allowing yarn to be mass-produced without the need for highly skilled operators.
Karl Marx, perhaps the most famous observer of the time, argued that “machines were […] the weapon employed by the capitalist to quell the revolt of specialized labor” (Marx 1847, p. 155). Smiles (Reference Smiles1861) provides similar examples, illustrating how employers aimed to dismantle worker associations—sometimes leading to capital outlays that might not have been necessary otherwise. Subsequent studies, such as those by Hobsbawm (Reference Hobsbawm1964), Bruland (Reference Bruland1982), and particularly the vivid account by Thompson (Reference Thompson1966) of how industrial conflicts in nineteenth-century Britain prompted technological labor-saving changes, especially within the textile industry.
Despite the compelling nature of these narratives, a core question persists: How widely applicable are these examples in explaining the impact of strike fears on technological choices during other periods of labor unrest, particularly in the twentieth century, compared to our competing mechanism?
New Technologies and Labor Market Institutions in Conflictual Norway
From the start of the twentieth century, Norway witnessed rapid technological advancements. The expansion of hydropower significantly increased electricity availability across the country. Energy-intensive industries, such as metal and fertilizer production, were the primary users. Other sectors also transitioned from labor-intensive methods or cumbersome steam engines to more efficient machines powered by electric motors or internal combustion engines. This shift toward electricity-based mechanization had wide-ranging effects, influencing factories, sawmills, and mining operations. Most importantly, it fostered the widespread emergence of smaller firms aimed at producing goods directly for the consumer market, such as those in the carpentry industry (Venneslan Reference Venneslan2002; Bergh et al. Reference Bergh, Hanisch, Lange and Øystein Pharo1983; Leknes and Modalsli Reference Leknes and Modalsli2020; Sandvik Reference Sandvik2022; Stugu Reference Stugu2018).
These technological changes emerged alongside major transformations in labor market institutions. Between 1905 and 1915, the two main labor organizations and the state established the foundational practices of collective bargaining and wage settlements (Olstad Reference Olstad and Bergh2010; Alsos, Nergaard, and Trygstad Reference Alsos, Nergaard and Trygstad2019). These changes involved controversial institutions, including mediation and arbitration forced on both parties by the state through The Mediation Act of 1915 (Alsos, Seip, and Nygaard Reference Alsos, Seip and Nygaard2016; Olstad Reference Olstad and Bergh2010).
Dahl (Reference Dahl1971) describes the decade of 1921 to 1931 as a period of particularly fierce wage negotiations within the Norwegian business community, beginning with the grand strike (Storstreiken) of 1921 and culminating in the grand lockout (Storlockouten) of 1931 (Sejersted Reference Sejersted2011, ch. 4; Bals Reference Bals2021). The metal workers’ strike (Jernstreiken) during the economic downturn of 1923–24 was particularly dramatic, involving 60,000 workers who protested after employers announced a 5 percent wage cut due to the crisis. The strike was declared illegal and, in response, transport and paper workers initiated a sympathy strike. A subsequent proposal for a 5 percent wage increase would have nearly restored wages to their original level, but the workers initially rejected it. Ultimately, they accepted the proposal due to pressure from the community and union leaders.
Many other labor conflicts during this period also involved illegal tactics, which were either brought before the labor court or suppressed by the newly formed State Police (“Statspolitiet”) of 1931. The State Police became most infamous for its role against striking workers during the Menstad conflict, where police forces and military units clashed with laborers. This era also presented huge challenges for the labor movement, as high unemployment created a pool of potential strikebreakers willing to work during stoppages. These conditions heightened tensions between union members and local or state police, and in some cases even mobilized soldiers.
The harsh penal codes introduced in 1928 shifted the burden of proof onto unions, requiring them to demonstrate that they had taken all possible measures to avoid a strike (Alsos, Seip, and Nygaard Reference Alsos, Seip and Nygaard2016, chs. 8–11). These laws also imposed heavy fines or prison sentences for actions that exposed strikebreakers to potential harm. Socialist parties responded in turn by appointing jurors by social class (e.g., communist municipality assemblies only appointing workers).
During this time of labor-capital conflict, a parallel potential for mechanization existed across many sectors. However, strikes and lockouts made investments in technological advancements uncertain for both established and emerging industries. In some years, nearly all 140,000 members of Arbeidernes Faglige Landsforbund (AFL) were engaged in conflicts.Footnote 3 Consequently, the threat of strikes likely influenced investment decisions across most firms.
As in the British textile industry, investing in new technology could reduce firms’ reliance on potentially strike-prone workers. Yet, no employer could hope for new machines that would eliminate all potential strikers. Firms investing heavily in new technologies would therefore become especially vulnerable to high wage demands, backed by strike threats, from the remaining workers. These potential costs must have weighed heavily on the investment decisions. In addition, capital-intensive technology incurs high fixed costs even during strikes, whereas labor-intensive technology offers more variable labor costs, which firms can adjust during work stoppages.
Cost flexibility is advantageous in labor disputes. Despite this, high mechanization can remain profitable if it shortens strike lengths—a plausible scenario.
The Logic of Strike Length
A strike’s expected duration is likely to decrease when the costs of continued conflict remain high. The profitability of mechanization increases the opportunity costs of work stoppages, pressuring owners and authorities to resolve strikes.
This ties into the “joint cost hypothesis,” proposing that higher joint costs for firms and employees lead to shorter work stoppages (Card Reference Card1990, p. 410). Historically, conflicts last longer during downturns than growth periods. For instance, Harrison and Stewart (Reference Harrison and Stewart1989) estimated a 14 percent increase in strike duration during downturns using Canadian data, and Kennan (Reference Kennan1985) found that strike durations in U.S. manufacturing are countercyclical, tending to last longer during economic downturns.
The hypothesis broadly suggests that strikes are shorter when profits are high. Consequently, highly productive firms may face shorter work stoppages due to new technologies. However, investing in specialized technology to influence strike length depends on whether strikes are localized or widespread.
Locally, mechanization may reduce reliance on specialized workers with substantial strike power. As Braverman notes, “machinery offers management the opportunity to achieve mechanically what it previously attempted through organizational and disciplinary means” (Braverman Reference Braverman1974, p. 195). Enhanced mechanization per worker may strengthen management’s control and maintain production during disputes, potentially shortening strike durations. In contrast, industry-wide or national strikes may not be as effectively shortened by uncoordinated technological decisions by individual firms. A stylized example can clarify these basic trade-offs.
The Basic Trade-offs as a Discrete Choice
Generally, two alternatives can illustrate our general case:
a labor-intensive technology with low capital cost, many workers, and potentially lasting strikes if they occur;
a capital-intensive technology with high capital costs, fewer workers, and potentially shorter strikes if they occur.
There are two related interpretations of the choice between the two alternatives: one where (i) retains the status quo technology and (ii) represents investments in the new electricity-based technologies, and another where both (i) and (ii) represent two different technologies feasible for a new plant or an extension of old ones.
As we shall see, profit-maximizing companies can choose one over the other depending on the circumstances. The focus on a discrete choice in this section is a simplification. In Online Appendix B, we let the company’s investment decision be a choice from all feasible technologies, including options with intermediate capital intensities.
If more firms chose alternative (i) in times when strikes become more likely, the flexibility mechanism is strongest. If more firms chose alternative (ii) in such times, the cooling mechanism is strongest. What does theory suggest? To answer, we introduce some simple notation.
In our generic example, the labor-intensive technology in alternative (i) applies a fixed number of workers b per produced unit and has (for simplicity) no fixed cost. The capital-intensive technology, in alternative (ii), applies a lower number of workers a per produced unit, but requires a fixed amount of capital investments k. Clearly, (b – a) > 0 represents the labor saving technical change by introducing the capital-intensive technology.
After the choice between (i) and (ii) is made and the new equipment is installed, the labor productivity is constant and fixed by the technology chosen. The value of the capital investment is then a sunk cost. Without any loss of generality, the future is, for simplicity, condensed into one production period in this illustration.
Now, with an expected output price equal to p and (for now) a common wage rate equal to w, the expected gross profits with full capacity utilization are π A = p – wa and π B = p – wb. To have an interesting case, we assert that modernization is profitable in the absence of strikes. Hence, the value of the labor saved by introducing the capital-intensive technology is higher than its capital costs, or formally, that

So if the firm could be certain that there would be no strikes or other work stoppages, the net profits of the capital-intensive technology are higher than those of the labor-intensive technology, that is, π A – k > π B .
A strike can affect the profits differently in the two cases. With a period length equal to 1, the length of the strike (1 – τ j ) is likely to depend on the technology j = A, B, where

since more machines per worker and thus a higher quasi-rent per period make strikes shorter and less effective.
During the work stoppage, capacity utilization is zero in both cases. With a common strike probability equal to s, the expected capacity utilization is

Clearly, the no-strike benchmark case has s = 0 and thus h j = 1.
The expected net profits per capacity unit can then be written v A = h A π A – k and v B = h B π B . Notice that a marginal increase in the cooling (a marginal increase in τ A ), which the capital-intensive technology contributes with, is s(p – wa). This is the value of cooling when the strike probability s is given from outside.
EXOGENOUS STRIKE PROBABILITIES
A given strike probability s can capture situations where the onset of a strike is unrelated to the specific conditions in the firm. One example from the period under consideration is industry-level strikes over the recognition of the union contract. How does the profit-maximizing choice of technology depend on an exogenous probability of a strike?
Facing a given risk of strike, firms tend to prefer the labor-intensive technology more the higher the risk of industrial action. Exogenous strikes can therefore make a strong case for the flexibility mechanism, even though the cooling effect moderates a clear dominance.
The reason is simple. To see the likely preference for flexibility, recall that fixed costs must be covered irrespective of whether there is a work stoppage or not. The firm does not, however, have to pay the wage costs during the strike. This leans in the direction of making the labor-intensive technology relatively more profitable than the capital-intensive technology.
Formally, let first h A = h B = h implying that there is no cooling effect. Dividing the expected profits of the two alternatives by the common value of h, the inequality that indicates that the B-technology is most profitable can be written as π B > π A – k/h. This inequality is more likely to hold the lower the capacity utilization h is expected to be. When a strike becomes more likely, the expected capacity utilization goes down, which in turn works as if the fixed cost of the capital-intensive technology becomes higher per produced unit. Hence, the flexibility mechanism makes the labor-intensive technology relatively more profitable.
To see how the cooling effect modifies this clear implication, recall that with cooling, we have τ A > τ B , and therefore h B < h A . The inequality that indicates that the labor-intensive technology is most profitable now becomes π B > (h A /h B )π A – k/h B . Again, the expected capacity utilization in both cases declines the more likely the strike is. Yet, the decline is largest with the labor-intensive B-technology since the expected strike length is higher. Accordingly, the capital cost per produced unit is, as before, enhanced by the reduction in h B , but it is somewhat modified by the fact that the gross profit in the capital-intensive technology is also relatively enhanced. The weight (h A /h B ) goes up since the value of h B declines more than the value of h A .Footnote 4
In sum, with exogenous strikes, the trade-off is only between cost flexibility and labor productivity. The capital-intensive technology has the highest labor productivity but the lowest cost flexibility. Since cost flexibility becomes more valuable the more likely a strike is, labor-intensive technologies may be most profitable under strike-prone circumstances. The most labor-intensive technology protects profits somewhat against the burden of high fixed costs during work stoppages, but it has the disadvantage that a strike can last for a longer period.
Strikes as Local Hold-ups
In this case, the strike is dependent on specific conditions in the firm related to local wage demands. One example is the winner-takes-it-all strikes that dominated in the interwar period, where either the employer concedes and accepts the union’s wage demand, or the workers concede and accept the going wage without change (see Card and Olson (Reference Card and Olson1995) for a discussion of such strikes in the United States during the 1880s). The profit-maximizing choice of technology then depends on how union militancy affects the wage demands and the endogenous strike probability.
Facing a potentially militant union at the local level, firms have stronger incentives to invest in capital-intensive technology—but only if the strike duration is sufficiently sensitive to higher productivity. The value of reducing worker militancy is higher. Endogenous strikes can therefore make a case for the cooling mechanism, even though the flexibility effect moderates a clear dominance.
The reason for this is related to how some components of profitability can be impossible for union members to observe. The asymmetry in information motivates union locals to use strikes to extract higher wages from more profitable employers (see Kennan Reference Kennan1986). The choice of technology affects both strikes and wages. As we shall see, the value of the cooling effect can become higher than in the case of exogenous strikes.
To illustrate this, we use a highly stylized version of the so-called hold-up problem, considering a case where the firm first makes its choice of technology and the union next comes with a strategic wage demand w A and w B (in the two cases), backed by a threat of strike (the hold-up) if not accepted.Footnote 5 As noted, the two sides have a common belief that the strike is expected to last (1 − τ j ) of the production period. If the strike is carried out, it is expected to end with a compromise wage equal to the initial wage level w. The purpose of the strike threat, however, is to motivate the employer to concede to a wage above w. Hence, we have the-winner-takes-it-all structure.
The asymmetric uncertainty about business prospects is simply incorporated by fluctuations in the output price between a high price, p H , with probability z, and a low price, p L , with probability (1 − z). The average price is still p, and hence p = zp H + (1 − z)p L . In our simplified description, we assume that the firm knows which price applies at a specific time, while the union does not.
Utilizing the Godfather principle (“he gave me an offer I could not refuse”), the union exploits the possibility that prospects are good (the price is p H ). Hence, the union demands the highest wage that the firm would yield to if prospects turn out to be good. If prospects turn out to be bad, however, the strike is initiated.
The union’s best wage demand with a capital-intensive technology is thus the highest level w A that the company would concede to when the price is p H . This wage demand is implicitly defined by the constraint

The strike thus threatens to reduce the firm’s revenues by (1 − τ A )[p H /a − w] per worker.
When prospects are good, the company accepts this as a wage rise, and we get

which is obtained by solving Equation (4) with equality.
This wage is too high to be accepted by the firm when prospects are bad. Yet, when the union has committed itself by mobilizing its members, the strike occurs. In other words, the strike happens in bad states when it does not pay for the firm to yield. At the wage given by Equation (5), the union extracts the entire gain of not having the strike carried out.
Similarly, the best wage demand by the union with the labor-intensive technology is

The probability of a strike equals the probability that the price is low, (1 − z).
Utilizing all this (and some patience with the formalismFootnote 6 ) the expressions for the expected profits v A and v B simplify to

First, we notice that the value of a marginal increase in the cooling (a marginal increase τ A ) now becomes (p − wa) as compared to s(p − wa) in the case with exogenous strikes. To see the magnitudes, let s = .1, that is, a 10 percent chance of a strike in the case with exogenous strikes. If this is so, the value of cooling in the case with endogenous strikes is ten times as high.
The preference for the capital-intensive technology over the labor-intensive alternative, v A > v B , is equivalent to the following inequality

As long as (τ A − τ B ) is of the magnitude ten times more worth for the firm in this case compared to the case with exogenous strikes, the incentives to invest in the capital-intensive technology can be strong. The reason why cooling now becomes so much more valuable is that a shorter duration of strikes both dampens wages and increases the effective utilization of the capital-intensive technology. With exogenous strikes, only the second effect applies. Still, the vulnerability for high fixed costs persists, modifying the clear case for the capital-intensive technology.
In sum, with endogenous strikes, the trade-off is not only between cost flexibility and labor productivity, but also wage determination enters the picture. The local hold-up case reduces expected profits of both technologies, but most likely less so for the capital-intensive than for the labor-intensive technology, as long as the expected strike length is sufficiently sensitive to profitability. Surprisingly, perhaps, the case for the capital-intensive technology becomes stronger as the accompanying shortening of strike duration mitigates worker militancy, which can be decisive in this case.
In Online Appendix B, we discuss the general case of continuous technological choices. Among other things, we show that when the strike length is sufficiently sensitive to higher profitability, the profit-maximizing capital intensity is lower with exogenous strikes than with local strikes with hold-ups. Yet, even though the flexibility mechanism is most pronounced with exogenous strikes, it may apply in both types.
Implications
The principal outcome of our discussion is that the potential for strikes can lead to substantial deviations from the classical model of capital intensity determination, which is typically guided by the relative costs of labor and capital (Haavelmo Reference Haavelmo1960). Specifically, we may observe a deviation toward a more capital-intensive direction (through increased machine investments) if the cooling of militancy mechanism prevails, and toward a more labor-intensive direction (through reduced machinery investments) if the cost flexibility mechanism is dominant.
As indicated, the scenario denoted as exogenous strikes aligns best when strikes and strike threats are decided not at the level of the individual firm, but rather at industry, branch, or national levels. In such cases, efforts to cool down worker militancy at the firm level are likely to have little or no effect. Accordingly, we should expect that the cost flexibility effect predominates when strike activities are initiated at levels higher than the firm. Conversely, the cooling of militancy effect is likely to be more pronounced when strike activities are initiated at the firm level.
Nevertheless, the flexibility mechanism retains significance in scenarios involving both exogenous strikes and local hold-ups. Drawing also on the continuous choice of technology (discussed in Online Appendix B), the profit-maximizing capital intensity is lower with exogenous strikes than with local hold-ups when strike length is highly sensitive to profitability. However, when this sensitivity is low, the flexibility option may also prove most profitable for firms facing local hold-ups.
How can we study the implications of the theoretical model empirically? Recall that our theoretical model predicts that strike threats or the expectations of strikes (not a strike itself) should shift employers’ investments. How to best incorporate the likelihood of future strikes? Studies of strikes have demonstrated that previous strikes in regions or sectors are good predictors of future strikes (Conell and Cohn Reference Conell and Cohn1995). If recent strikes at either the firm or sector level can be used as a reliable predictor of future strikes, we can investigate which mechanism dominates by exploring how past strikes affect the present use of technology.
The options under consideration are: (i) a labor-intensive technology with low capital costs and numerous workers, and (ii) a capital-intensive technology with high capital costs and fewer workers.
In a setting where the flexibility strategy prevails, the impact is likely to be more pronounced during broad sector-wide strikes compared to firm-level strikes. This is so since it is more difficult to mitigate worker militancy at the firm level when the strike threat operates independently of individual firms’ decisions. Consequently, individual employers have stronger incentives to mitigate the costs associated with work stoppages during such broad conflicts. We test this model implication by classifying each industrial conflict as either “broad” or “firm-level.” Aligning with the theoretical prediction, our analysis reveals a significantly stronger cost flexibility effect for broad strikes compared to firm-level strikes.
In the next section, we describe our novel dataset on industrial conflict, compiled specifically to test which mechanism most significantly influences investment in new technology. We then present our empirical setup, which investigates how past strikes affect the choice of production technologies.
A DATA-SET ON STRIKES AND TECHNOLOGIES
We have compiled a dataset on industrial conflicts and production technologies from the interwar period in Norway (Rasmussen et al. Reference Rasmussen, Kjelsrud, Gjerløw, Kotsadam and Moene2025). This historical setting provides a pertinent backdrop for testing the hypotheses outlined previously, as the period, as stated, was characterized by an unprecedented number of industrial conflicts at both the firm and sector levels (Alsos, Nergaard, and Trygstad Reference Alsos, Nergaard and Trygstad2019; Arctander Reference Arctander1923; Hibbs Reference Hibbs1978), while simultaneously witnessing substantial technological advancements (Venneslan Reference Venneslan2002; Bergh et al. Reference Bergh, Hanisch, Lange and Øystein Pharo1983; Sandvik Reference Sandvik2022).
The data are extracted from digitized annual reports for the years 1908 to 1939 from the Norwegian trade union confederation, Arbeidernes Faglige Landsforbund (AFL).Footnote 7
Most strikes during this time period were at the firm or the sector level, with national strikes being relatively rare but impactful (Bals Reference Bals2021; Elvander Reference Elvander2002). This specificity allows us to meaningfully link strikes and lockouts to particular firms and sectors and to examine whether the frequency of these conflicts influenced firms to adopt either mechanized, capital-intensive production methods (the cooling effect) or more labor-intensive, less mechanized approaches (the flexibility effect).
The AFL reports, constituting the core of our dataset, provide detailed records on strikes and lockouts involving AFL members, including firm names, the number of workers in conflict, and the number of lost working days. Based on firm names, we manually link this data to sectors in the Manufacturing Statistics by Statistics Norway, which provides yearly estimates on production, the number of workers, and so on for approximately 70 manufacturing sectors. Importantly for our analysis, it also provides the fire insurance value of buildings and machines (excluding inventories). We use this to construct our main proxy for the use of machinery and mechanization as the insurance value over the workforce size in each manufacturing sector.
In addition to unions, the Norwegian employer association (“Norsk Arbeidsgiverforening,” NAF) was, of course, an important player during this period, as we also discuss in Online Appendix Section C. In addition to formal employer organizations, there were centrally organized strikebreaker organizations, such as Society Aid (“Norges Samfundshjelp”), formed in 1920 with the stated aim of mitigating and breaking the effectiveness of the strike weapon (Kunkeler Reference Kunkeler2024). Unfortunately, we do not have data on the local organization of the N.A.F. nor the strike-breaker organizations (Agøy Reference Agøy1997).
Before 1915, agreements between AFL and NAF tended to contain general provisions on the duty of industrial peace during the period of the wage agreement. The 1915 Labour Disputes Act (“Arbeidstvistloven”) outlawed the use of industrial actions to resolve legal disputes and mandated industrial peace during the validity period of a collective agreement (Alsos, Seip, and Nygaard Reference Alsos, Seip and Nygaard2016). In our main study period (inter-war period), large fines were implemented for union leaders and members who could not prove that they hadn’t worked to stop an illegal strike. This means that we can exploit the expiration of wage agreements as an instrument for strikes (see the next subsections and Online Appendix Section C).
Industrial Conflicts
We obtain raw data on industrial conflicts from the annual reports of the main Norwegian trade union confederation, AFL. The dataset is restricted to conflicts that were reported to the AFL. All member organizations of the AFL were required to contribute to a centralized strike fund. To benefit from this fund during a conflict, they needed to obtain the AFL’s approval before initiating a strike. The member unions, therefore, had strong incentives to do just that (see also Gjerløw and Rasmussen Reference Gjerløw and Rasmussen2022). Furthermore, unions even submitted information on strikes that were not eligible for AFL support (Arctander Reference Arctander1923). Given that nearly all unions were AFL members at the start of our data in 1908, that the federation was present in all economic sectors (Bjørnhaug and Halvorsen Reference Bjørnhaug and Halvorsen2009; Olstad Reference Olstad2009), and that it provides the longest-running consistent data source on conflicts, we argue that this data source is suitable for our purpose (see Online Appendix Section A for validation and a longer discussion about alternative data sources).
The AFL reports provide information on all forms of strikes and lockouts, including the names of the firms involved, the number of workers who took part, the number of working days lost, the reason for the conflict (e.g., wage demands, demand for collective bargaining), and the outcome (e.g., wages and hours before and after the strike).
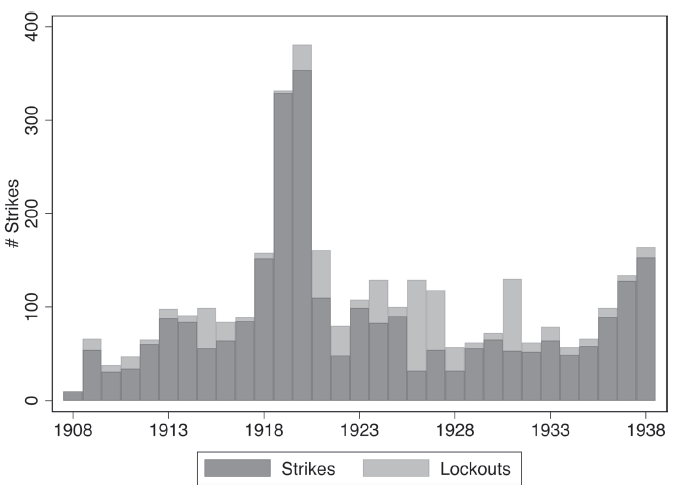
We manually digitized the AFL reports for the years 1908 to 1939 (the series ends due to the German invasion on 9 of April 1940). In Figure 1, we display the number of industrial conflicts by year in our data, separated by strikes and lockouts.
NUMBER OF INDUSTRIAL CONFLICTS PER YEAR
Notes: The figure shows the number of industrial conflicts workers per year. The dark shaded bars display strikes, while the light shaded bars display lockouts.
Source: Produced by the authors.

Figure 1 Long description
The bar graph compares the number of industrial conflicts per year, with dark bars representing strikes and light bars representing lockouts. The x-axis spans from 1908 to 1938, while the y-axis indicates the number of strikes, ranging from 0 to 400. The graph shows a significant peak in industrial conflicts around 1918, with both strikes and lockouts reaching their highest levels. Other notable periods of increased conflicts include the early 1920s and the mid-1930s. The data suggests fluctuations in industrial unrest over the years, with varying levels of strikes and lockouts. All values are approximated.
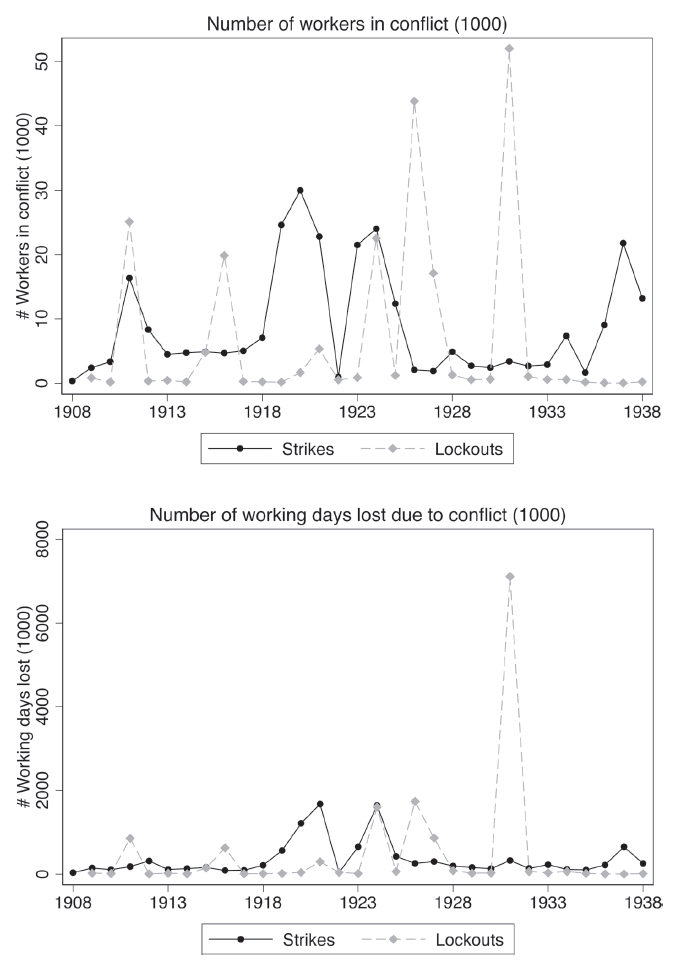
Our dataset provides information on 1,976 firm-level industrial conflicts between 1908 and 1939, encompassing 1,359 strikes, 174 sympathy strikes, and 443 lockouts (Rasmussen et al. Reference Rasmussen, Kjelsrud, Gjerløw, Kotsadam and Moene2025). The top panel of Figure 2 shows the number of workers involved in conflict by year. The bottom panel shows the number of working days lost per year. See Online Appendix E for the geographical distribution of the strikes in our sample.
NUMBER OF WORKERS IN CONFLICT AND NUMBER OF WORKING DAYS LOST
Notes: The top figure displays the number of workers (in 1,000s) involved in industrial conflicts per year, while the bottom figure displays the number of working days lost (in 1,000s) per year due to conflicts.
Source: Produced by the authors.

Figure 2 Long description
The image contains two line graphs. The top graph shows the number of workers in conflict, measured in thousands, from 1908 to 1938. The x-axis represents the years, and the y-axis represents the number of workers in conflict. The data is divided into two categories: strikes and lockouts, represented by solid and dashed lines, respectively. The bottom graph shows the number of working days lost due to conflict, also measured in thousands, over the same period. The x-axis represents the years, and the y-axis represents the number of working days lost. Similar to the top graph, the data is divided into strikes and lockouts. The graphs illustrate fluctuations in industrial conflicts and their impact on labor over time.
Manufacturing and Production Technologies
Our main data on manufacturing and production technologies comes from the Manufacturing Statistics, compiled by Statistics Norway from 1927 and onward. This data is perceived as being of high quality and as a pioneering effort in the measurement of manufacturing output (Klovland Reference Klovland1997).
The statistics were published as annual reports, with detailed information on the aggregate level of activity in 75 manufacturing industries, including production, the number of firms, the use of inputs, the number of workers, and the number of hours worked. The reports were restricted to firms with at least 12,000 hours worked per year, equivalent to five full-time workers. This implies that we generally do not observe very small firms.Footnote 8 To more easily link the data with the industrial conflict dataset, we collapse sectors that are closely related and difficult to distinguish. Overall, we end up with 60 manufacturing sectors, grouped into 12 broad sectors (see Online Appendix G for a full listing). We make use of the reports for the years 1927 to 1938 (which we manually digitize).
The Manufacturing Statistics include yearly estimates of the fire insurance value of buildings and machines for each manufacturing sector.Footnote 9 We use this as our main proxy for the use of machinery and mechanization. In Online Appendix Figure A11, we plot the aggregate ratio of machines over workers for our main estimation period (the solid line), as well as disaggregate numbers by 12 broad manufacturing sectors (the dashed lines). The capital intensity of firms, as measured in this way, fell in most sectors over our study period.
As an alternative data source, we also make use of the Industrial Statistics, which were based on data collected by the National Insurance Institution (Rikstrygdeverket) under the Industrial Accidents Insurance Act of 1897. Statistics Norway took charge of the data production in 1921, and from 1922 and onward, the report is available on an annual basis, with the exception of the years 1931 to 1933. We make use of the reports from 1923 to 1930.Footnote 10 The coverage of the statistics had no limits on firms’ number of employees but was instead limited to firms and establishments using motive power in their production. Thus, the Industrial Statistics have a much broader coverage of small firms than the Manufacturing Statistics. It also covers a broader set of industries (for instance, bakeries, dairy production, and butchers), 133 in total. For comparability and for the purpose of linking the data to the industrial conflict dataset, we collapse the data to 69 sectors (of which 60 overlap with the Manufacturing Statistics). See Online Appendix G for a detailed list.
The Industrial Statistics have no information on the value of machines and buildings, but they do report the use of motor power in horsepower for each industry, which we use as an alternative outcome in the robustness section. In Online Appendix Table A8, we show that this measure is strongly correlated with our measure of machine use from the Manufacturing Statistics. This holds both within manufacturing sectors across years and across manufacturing sectors within years.
Merging Data
We manually link the two datasets on manufacturing to the dataset on industrial conflict. The reports by AFL have no information on which sectors the firms in conflict were operating in. However, for most disputes, the reports include the name of the firm or the branch. We make use of this to match the datasets.
To give an example, when the listed firm name is Killingdal Mining, we allocate the conflict to the sector “mining.” When the firm’s name is Arendal shoe factory, we allocate the conflict to the sector “production of shoes.” Not all firm names provide hints of sectors in this way, however. For these firms, we search for information online and allocate firms to sectors based on the information we find, provided that we can do so with reasonable confidence.
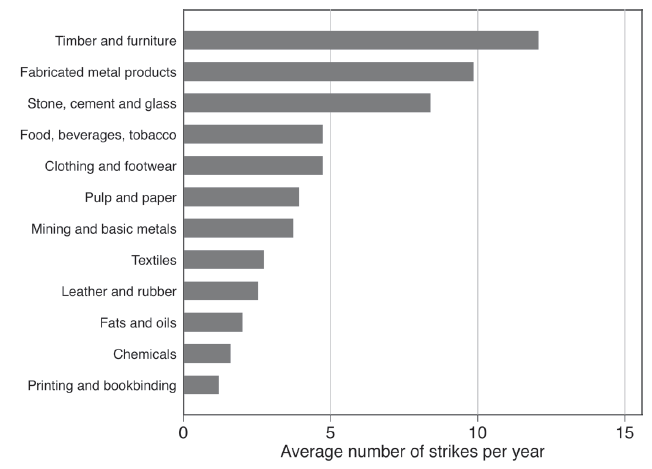
Overall, we are able to identify the sector of about 93 percent of the conflicts during the period 1923 to 1938. Around 55 percent of all disputes are allocated to a manufacturing sector in the Manufacturing Statistics, while an additional 6 percent are allocated to the nine extra sectors in the Industrial Statistics.Footnote 11 Figure 3 shows the average number of strikes per year by the 12 broad manufacturing sectors, while Online Appendix Figure A13 shows the number of strikes by the fine manufacturing sectors. Replication materials are available online (Kotsadam et al. Reference Kotsadam, Rasmussen, Moene, Kjelsrud and Gjerløw2025).
AVERAGE NUMBER OF STRIKES PER YEAR, BY BROAD SECTORS
Note: The figure presents the average number of strikes per year over the period 1923 to 1938, by 12 broad manufacturing sectors.
Source: Produced by the authors.

Figure 3 Long description
The bar graph illustrates the average number of strikes per year across different manufacturing sectors between 1923 and 1938. The sectors include Timber and furniture, Fabricated metal products, Stone, cement and glass, Food, beverages, tobacco, Clothing and footwear, Pulp and paper, Mining and basic metals, Textiles, Leather and rubber, Fats and oils, Chemicals, and Printing and bookbinding. Each sector is represented by a horizontal bar, with the length of the bar indicating the average number of strikes per year. Timber and furniture have the highest average number of strikes, followed by Fabricated metal products and Stone, cement and glass. The sectors with the lowest average number of strikes are Printing and bookbinding, Chemicals, and Fats and oils.
EMPIRICAL SETUP
The goal of our empirical exploration is to identify the effect of strike threats on the choice of production technology. Next, we describe our empirical setup.
We use the following two-way fixed-effect model as our main specification:

where σ i and σ t denote fixed effects for manufacturing industries and years, respectively, while y it denotes the outcome of interest for industry i in year t. Strikes i,t−1 denotes strike threats, as measured by the extent of actual strikes in year t − 1. In most regressions, we also add the dependent variable lagged, y i,t−1, to obtain more precision. Robust standard errors are clustered at the level of manufacturing sectors.
Clearly, the risk of strikes—the strike threat—cannot be observed by us as researchers. Our approach, therefore, is to use previous incidents of strikes as a proxy for the perceived likelihood of future strikes. In our baseline specification, we simply use a binary variable denoting whether or not each manufacturing sector experienced a strike in the previous calendar year. In alternative specifications, we make use of proxies that potentially better capture the extent of the strike threat: the number of strikes in each sector, the number of workers involved in strikes, and the number of working days lost to strikes. We transform the latter two proxies using the inverse hyperbolic sine (Burbidge, Magee, and Robb 1988; MacKinnon and Magee Reference MacKinnon and Magee1990; Pence Reference Pence2006).Footnote 12
RESULTS
In this section, we first present our main results on strikes and technological choice and assess their robustness. We then discuss alternative interpretations of the results and whether the identified relationships could be interpreted causally.
Main Results and Robustness
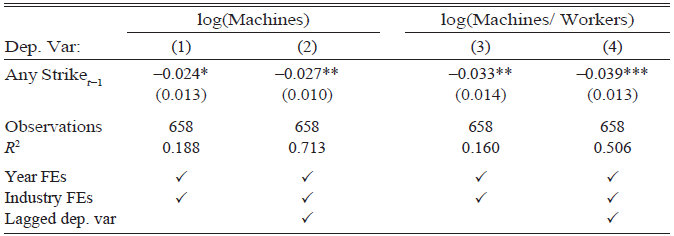
Table 1 presents our baseline results. In the even-numbered columns, we control for the lagged dependent variable, which we do not do in the odd-numbered columns.
BASELINE REGRESSIONS: STRIKES AND MECHANIZATION

Table 1 Long description
The table presents baseline regression results examining the relationship between strikes and mechanization. It includes two sets of dependent variables: log of Machines and log of Machines per Workers. Each set has two columns, with even-numbered columns controlling for the lagged dependent variable. The table shows coefficients for the variable 'Any Strike' with standard errors in parentheses. The number of observations is 658 for all models. R-squared values vary across models, indicating the proportion of variance explained. Year and industry fixed effects are included in all models, and the lagged dependent variable is included in even-numbered columns.
* = Significant at the 10 percent level.
** = Significant at the 5 percent level.
*** = Significant at the 1 percent level.
Notes: The table is based on data from the period 1928–1938. All regressions include year fixed effects and manufacturing sector fixed effects. Robust standard errors, clustered on 60 manuf. sectors, are shown in parentheses.
Source: Produced by the authors.
The outcome variable in Columns (1) and (2) is the log of the fire insurance value of buildings and machines. We obtain an estimated coefficient of –0.024 in Column (1), and this changes only marginally to –0.027 when we include the lagged outcome in Column (2). However, the R-squared rises substantially. The point estimate suggests that the strike in the previous year is associated with a decrease in the stock of machines of 2.7 percent.
In Columns (3) and (4), we use the log of machines over the log of the number of workers as the outcome variable. The results clearly suggest that strikes are associated with a shift in the mode of production away from machines and toward labor. The estimated coefficients are highly significant and imply that a strike in the previous year is associated with a fall in the ratio of machines over workers of 3.9 percent. The estimate is thus economically and statistically important.
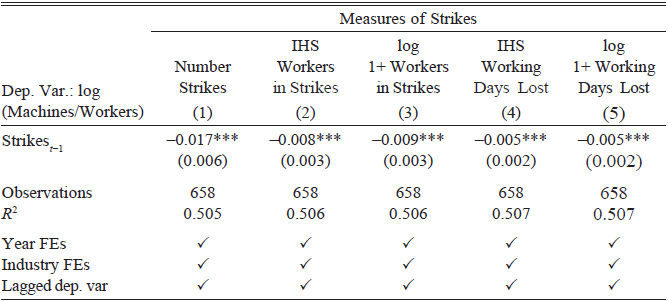
In Table 2, we show that results are similar when we use other measures that capture the severity of conflicts: the number of strikes, the number of workers on strike, and the number of working days lost due to strikes. Our results are also robust to a wide set of other alternative specifications and choices (see Online Appendix D). Specifically, our results are robust when using three alternative measures of mechanization (Online Appendix Table A3) and alternative data sources (Online Appendix Table A4), when including sector-specific time trends (Online Appendix Table A5), and when excluding manufacturing sectors in a rotating fashion (Online Appendix Figure A2). In addition, we estimate the effects in 20 broad regions, finding negative effects in the majority of them. We also exclude one region at a time and find results very similar to those in our main specification, suggesting that the results are not driven by a specific region (see Online Appendix E).
ROBUSTNESS: STRIKES AND MECHANIZATION, USING DIFFERENT MEASURES OF STRIKE THREAT

Table 2 Long description
The table presents data on the impact of strikes on mechanization, using various measures of strike severity. It includes five columns: Number of Strikes, Workers in Strikes, One Plus Workers in Strikes, Working Days Lost, and Log One Plus Working Days Lost. Each column shows the coefficient, standard error, number of observations, and R-squared value for the relationship between strikes and mechanization. The table also indicates the inclusion of year and industry fixed effects, as well as lagged dependent variables. The data suggests negative coefficients across all measures, indicating that strikes have a detrimental effect on mechanization.
* = Significant at the 10 percent level.
** = Significant at the 5 percent level.
*** = Significant at the 1 percent level.
Notes: The table is based on data from the period 1928–1938. The outcome variable is the log of machines over the log of the number of workers. All regressions include year fixed effects and manufacturing sector fixed effects, as well as the dependent variable lagged. Robust standard errors, clustered on 60 manuf. sectors, are shown in parentheses.
Source: Produced by the authors.
Interpretation and IV Estimation
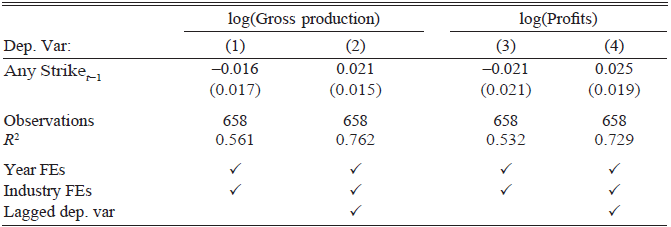
The previous results suggest that the cost flexibility effect dominates the cooling of militancy effect, at least in our setting. However, several alternative interpretations could potentially also be consistent with our results. One explanation, in line with our theory, is that firms tend to postpone replacement investments when faced with a high probability of a strike. Similarly, the firm may also be hesitant to fire workers prior to a likely strike just to prevent workers from becoming even angrier. Another interpretation that may modify somewhat the one we prefer is that strikes reduce the profitability of firms, leading to less liquidity and fewer capital investments. Although we cannot completely exclude this possibility, it is not supported by our data, as lagged strikes have no predictive power on either gross production or profits in the preceding year, t – 1 (see Table 3). Additionally, we show in Online Appendix D.7 that strikes only make firms hesitant to introduce more capital-intensive technologies during the following year and that there are no lingering effects of strikes in earlier periods.
STRIKES AND OTHER OUTCOMES IN PERIOD t

Table 3 Long description
The table presents data on the impact of strikes on gross production and profits. It includes four columns: two for log(Gross production) and two for log(Profits). Each column contains regression results with coefficients, standard errors, and the number of observations. The table also includes R-squared values and indicators for year and industry fixed effects. The data shows the coefficients for the variable 'Any Strike' in the previous period (t-1) across different models. The first two columns focus on log(Gross production), while the last two columns focus on log(Profits). The table indicates that strikes in the previous period have minimal impact on both gross production and profits in the current period.
* = Significant at the 10 percent level.
** = Significant at the 5 percent level.
*** = Significant at the 1 percent level.
Notes: The table is based on data from the period 1928–1938. All regressions include year fixed effects and manufacturing sector fixed effects. Robust standard errors, clustered on 60 manuf. sectors, are shown in parentheses.
Source: Produced by the authors.
Another potential interpretation is that strike threats were higher in sectors with strong unions. These sectors, one could imagine, had stronger wage rigidities, which made employers less able to negotiate wages down during deflationary periods. This could have reduced firms’ capacity to accumulate or attract capital for future investments in machinery. However, such factors—particularly sector-specific unionization—are likely to be slow-moving or nearly constant over time and should hence be accounted for by the sector fixed effects.Footnote 13
Yet, strikes are obviously not random events, and it is therefore difficult to claim with certainty that the relationships we observe are causal. However, several factors lead us to believe the relationships are indeed causal. First, we control for year fixed effects, which likely account for major confounding factors such as business cycles.
Second, we examine potential bias arising from using two-way fixed effect models in Online Appendix Section D.5. These analyses suggest that negative weights are not a concern in our setting.
Third, we assess the sensitivity of our estimates to unobserved confounders in Online Appendix Section D.6. Specifically, following the approach in Cinelli and Hazlett (Reference Cinelli and Hazlett2019), we find that unobserved confounders with an influence even half as strong as our lagged dependent variable have minimal impact on the results.
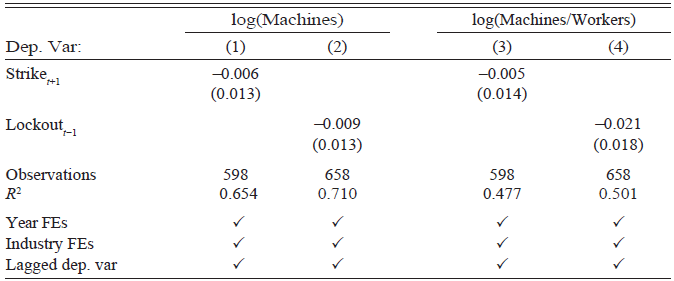
Fourth, placebo regressions indicate that the relationship is unlikely to be reversed. This conclusion is based on two different tests. For one, we estimate the association between machine use and strikes lead, as measured by strikes one year after the outcome. Estimates are shown in Columns (1) and (3) of Table 4. Both coefficients are close to zero. For the other, we use lagged lockouts as the main independent variable. Lockouts are different from strikes in that they are initiated by the firms. As long as this is the case,Footnote 14 we would not expect any effect on the chosen production technology.Footnote 15 Comfortably, we do not, as can be seen from Columns (2) and (4) of Table 4.
PLACEBO REGRESSIONS

Table 4 Long description
The table presents regression results for the log of machines and the log of machines per worker, with strike and lockout variables. It includes four columns: two for the log of machines and two for the log of machines per worker. Each column shows the coefficients for strike and lockout from the previous year. The table also lists the number of observations and the R-squared values for each regression. Year and industry fixed effects, as well as lagged dependent variables, are included in the models.
* = Significant at the 10 percent level.
** = Significant at the 5 percent level.
*** = Significant at the 1 percent level.
Notes: The table is based on data from the period 1928–1938. All regressions include year fixed effects and manufacturing sector fixed effects, as well as the dependent variable lagged. Robust standard errors, clustered on 60 manuf. sectors, are shown in parentheses.
Source: Produced by the authors.
Finally, and most importantly, we show that we obtain consistent results when using the number of expiring wage agreements as an instrument for the strike threat within sectors. About 86 percent of the strikes in our study period list “bargaining over a new wage agreement” as the main reason for the conflict. This is not surprising, as the Labor Disputes Act of 1915 had a clause on industrial peace, whereby strikes were unlawful during the period of a wage agreement (Alsos, Seip, and Nygaard Reference Alsos, Seip and Nygaard2016). Thus, expiration dates of wage agreements are a plausible predictor of the timing of strikes.
We implemented the analysis by first digitizing the wage agreements listed in the annual AFL reports. Starting from the publication for 1927, these reports include information on the expiration date of each agreement.Footnote 16 In line with the institutional context, we find that the number of expiring wage deals within each sector strongly predicts the occurrence of strikes. See Online Appendix C for more details.
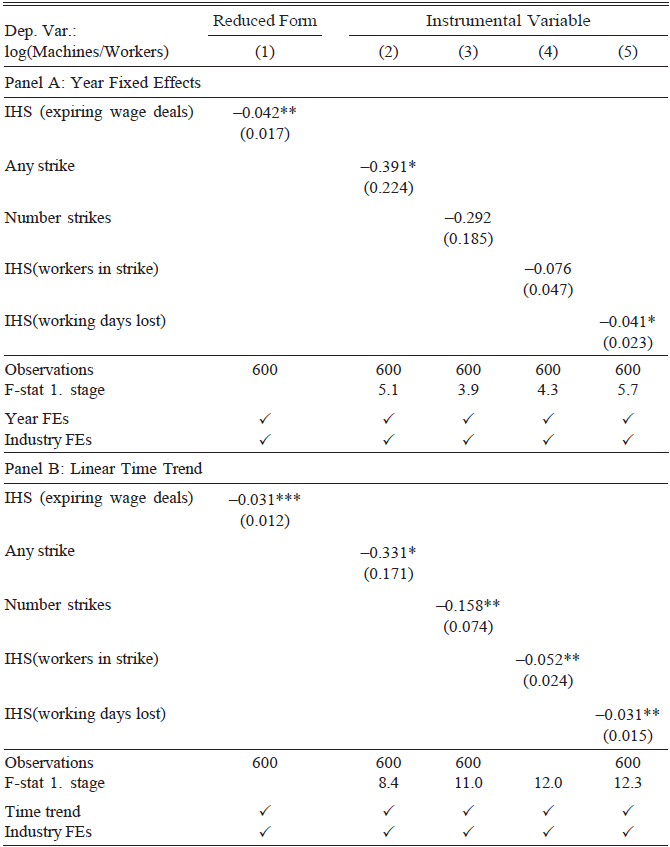
The first column in Panel A of Table 5 displays the effect of the number of expiring wage deals during the previous year on machines per worker. We find an estimate of –0.042, significant at the 5 percent level. In Column (2), we display estimates based on instrumenting the likelihood of a strike with the number of expiring wage deals. The F-stat from the first stage of this regression is below rule-of-thumb minimum levels, but we still obtain a negative and marginally significant coefficient (p-value = 0.082). The rest of Panel A displays similar IV results using the alternative and more granular measures of strikes (number of strikes, number of workers, and number of lost working days).
EXPIRING WAGE AGREEMENTS AS INSTRUMENT FOR STRIKES

Table 5 Long description
The table presents data on the relationship between expiring wage deals and various strike metrics. It includes two panels: Panel A with year fixed effects and Panel B with a linear time trend. Each panel has five columns displaying different variables and their impacts. The first column in Panel A shows the effect of expiring wage deals on machines per worker, with a significant estimate of 0.042. Column 2 shows the instrumented likelihood of a strike, with a negative and marginally significant coefficient. The remaining columns in Panel A and all columns in Panel B display similar instrumental variable results using different strike measures, such as the number of strikes, workers involved, and working days lost. The table includes 600 observations per column and various statistical measures like F-statistics and fixed effects for year and industry.
* = Significant at the 10 percent level.
** = Significant at the 5 percent level.
*** = Significant at the 1 percent level.
Notes: The table is based on data for the period 1929–1938. Robust standard errors, clustered on 60 manufacturing sectors, are shown in parentheses.
Source: Produced by the authors.
Because of the weak first stage, we also present estimates where we replace the year fixed effects with a less demanding linear time trend. We show these estimates in Panel B of 5. The reduced form estimates imply a somewhat weaker effect on the use of machines, while the instrumental variable regressions are more precisely estimated with a stronger first stage (see also Online Appendix C).
In sum, we believe these IV results—combined with all the other tests presented in this section—justify a causal interpretation and that higher strike threat in fact leads to less mechanized production methods, in line with our cost flexibility effect from the second section.
Firm-Level Strikes versus Broad Strikes
The results presented so far suggest that the flexibility effect dominates the cooling effect in our setting. The relative strength of the two effects should, however, depend on the type of strike. In this section, we investigate whether our data is consistent with this theoretical prediction.
The relative strength of the cost flexibility effect and the cooling of the militancy effect should, according to our theory, depend on whether or not strikes are exogenous from the perspective of the firm. If the strike threat is independent of decisions made by each individual firm, there is little effect in trying to cool down worker militancy at the firm level. Instead, the firms have incentives to rig their production in such a way that the cost of work stoppages is reduced. Given our baseline results—of a negative association between strike threat and machine use—we would thus expect a larger negative impact on the stock of machines when the strike threat is decided at the industry or national level rather than at the level of the individual firms.
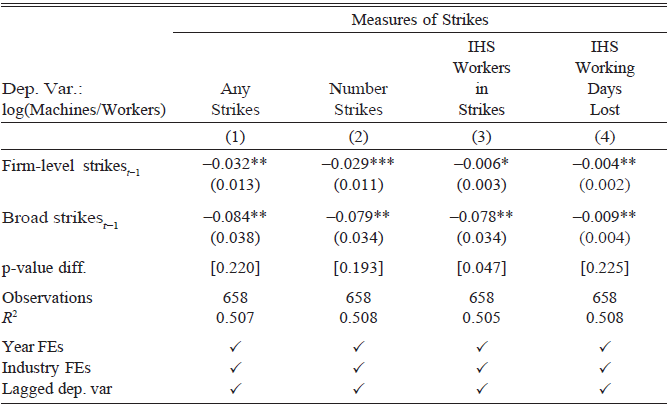
To investigate this, we manually classify each conflict as either “broad” or “firm-level” based on the information in the AFL reports. We defined a conflict as broad if it involves multiple firms within the same sector. We identify 15 broad strikes during the period 1927 to 1938. We classify the remaining strikes as firm-level. We then construct our earlier measures of strike threat using the two types of strikes and include the measures as separate variables in our regressions. Estimates are shown in Table 6.
FIRM-LEVEL VERSUS BROAD STRIKES

Table 6 Long description
The table presents data on the impact of firm-level and broad strikes on various measures of strikes. It includes four columns labeled Any Strikes, Number Strikes, IHS Workers in Strikes, and IHS Working Days Lost. Each column contains regression results for firm-level strikes and broad strikes, with corresponding p-values and observations. The table also includes R-squared values and indicates the inclusion of year and industry fixed effects, as well as lagged dependent variables. Notable trends include negative coefficients for both firm-level and broad strikes across all measures, with broad strikes generally showing larger negative impacts.
* = Significant at the 10 percent level.
** = Significant at the 5 percent level.
*** = Significant at the 1 percent level.
Notes: The table is based on data from the period 1928–1938. The outcome variable is the log of machines over the log of the number of workers. All regressions include year fixed effects and manufacturing sector fixed effects, as well as the dependent variable lagged. p- value diff denotes the p-value for the difference between the two coefficients displayed in the table. Robust standard errors, clustered on 60 manuf. sectors, are shown in parentheses.
Source: Produced by the authors.
The estimates in Column (1) of Table 6 are based on the binary measure of strike threat. The point estimates are in line with the theoretical predictions: the coefficient of broad strikes suggests a reduction in the stock of machines per worker by 8.4 percent, while the corresponding coefficient of firm-level strikes suggests a reduction of 3.2 percent. We do not, however, have power to statistically distinguish the two coefficients (p-value of .220). We obtain a similar difference when using the number of strikes as the measure of strike threat, as can be seen from Column (2).
One concern with the measures in this setting, however, is that broad strikes, by definition, are larger than firm-level strikes. This implies that the broad strikes affect more firms within each manufacturing sector, which potentially could explain the heterogeneous relationship between strikes and mechanization. Columns (3) and (4) account for this by using the number of workers in strike and the number of working days lost as measures of the strike threat. When using the number of workers, we obtain a much sharper difference (significant with a p-value of 0.047), while the estimates using working days lost are roughly comparable to those in Columns (1) and (2).
CONCLUDING REMARKS
Our study has explored some central consequences of strikes on technological choices in an economy prone to labor unrest. Unlike much prior research, which primarily explored the causes of strikes,Footnote 17 this study examines how strikes influence employers’ decisions regarding production technology. The resulting choice of technology is influenced by more than just the cost of labor and capital. Two competing effects stand out: the “cooling” effect, where employers invest in machinery to reduce worker militancy, and the “flexibility” effect, where they choose labor-intensive technology to mitigate the costs of labor disputes.
Drawing on newly compiled data, our analysis reveals a strong support for the flexibility effect. Strikes in the previous year led to a reduction of up to 4.3 percent in the machine-to-worker ratio. This effect is consistent across different types of strikes, with a more pronounced impact during broad sector-wide strikes. Employers preferred production technologies, it seems, that could economically tolerate potential disruptions in the workplace.
These findings challenge the claim made by Marx and others that major strikes inevitably led to the adoption of new machinery as a countermeasure against labor militancy. However, it is important to note that our focus has been on the implementation of existing technologies, whereas Marx, Rosenberg, and others discussed the invention of new technologies. The type of available technology is obviously significant. For example, in the early nineteenth century, mechanized weaving looms quickly became a means to counteract strikes by highly skilled workers. However, in the Norwegian interwar period, the adoption of mechanization via electric motors was less effective in replacing certain strike-prone workers, who were often low-skilled manual laborers. As a result, this form of mechanization was less effective in reducing worker militancy in that context.
Our research also questions core assumptions of the labor process literature, which suggests that conflict drives machinery adoption and Taylorism to curb labor power. Although this literature correctly notes distributional concerns regarding the choice of technology, our findings suggest it might misinterpret the biases that result. For instance, capital-intensive technology adoption in the U.S. labor history, as in the 1892 Homestead dispute, occurred only after union threats were mitigated (Stone Reference Stone1974).
All in all, strikes and confrontations have a long history of discouraging capital- intensive investments, it seems. Even the Luddites in early nineteenth-century England were able to resist some labor-saving innovations by their tactics of “collective bargaining by riots.”Footnote 18 In such contexts, employers facing strike-prone workers likely hesitated to invest in costly machinery. More labor-intensive technologies offered both greater cost flexibility and less bargaining power for the workers during conflicts.
More generally, one may, as the historian Dahl (Reference Dahl1971), pose the question: Where did the intense class struggle in the period between the world wars actually lead Norwegian society? He concludes that between 1918 and 1939, Norwegian industries did not undergo significant changes. Unlike the industrialization period from 1900 to 1916, Norwegian industries produced as before with the same social composition of the population. The result of the class struggle was basically the establishment of organizations—self-defense against the crisis, social collaboration, and union coordination—in part intended to advance society toward new class relations, which did not materialize.
So for the institutional history of Norway, or Scandinavia more generally, our study helps us understand how union-led labor disputes in the interwar period hindered modernization and destabilized the economy (Sandvik Reference Sandvik2022). However, by the mid-1930s and post-WWII, institutional changes such as centralized bargaining strengthened unions, reduced strike frequency, and improved cooperation between unions and employers (Alsos, Nergaard, and Trygstad Reference Alsos, Nergaard and Trygstad2019; Sandvik Reference Sandvik2022). Only then, we argue, could the process of creative destruction utilize modern capital equipment on an extended scale.
Thus, our results contribute to the ongoing debate about the factors shaping Norway’s economic performance during the late 1920s and 1930s. They provide part of the explanation for the lack of technological investment during the strike-prone 1920s, contrasting with higher investments during the more peaceful 1930s.Footnote 19 A key factor behind this shift was the industrial peace brought by the Basic Agreement of 1935 and the growing coordination of collective bargaining. These changes reduced conflict and fostered conditions conducive to long-term technological investment and economic growth.