INTRODUCTION
Species of Gyrodactylus are principally ectoparasites of fish. Currently, approximately 410 Gyrodactylus species have been described (Harris et al. Reference Harris, Shinn, Cable and Bakke2004). Some cause severe gyrodactylosis, and Gyrodactylus salaris, which has a devastating effect on East Atlantic salmon (Salmo salar) populations (Johnsen et al. Reference Johnsen, Møkkelgjerd and Jensen1999), has attracted particular attention. Taxonomy and species identification in Gyrodactylus relies heavily on comparative morphometrics of the hard-parts of the posterior attachment organ, namely the hamuli, marginal hooks and ventral bar. The hamuli and marginal hooks are composed of collagen-like proteins stabilized by disulphide bridges, whereas the ventral bar contains higher concentrations of calcium respective to the other 2 structures (Kayton, Reference Kayton1983; Shinn et al. Reference Shinn, Gibson and Sommerville1995). During embryogenesis, marginal hooks develop first followed by the hamuli and later the ventral bars (Malmberg, Reference Malmberg1990; Cable and Harris, Reference Cable and Harris2002). A substantial problem is that the morphology of taxonomically important features is subjected to phenotypic plasticity resulting from environmental variation. Several studies have shown that macro-environmental factors, such as temperature, may influence the shape and size of the hard-parts of Gyrodactylus species and thus hamper the use of morphology-based diagnostic keys (e.g. Malmberg, Reference Malmberg1970; Kulemina, Reference Kulemina and Skarlato1977; Mo, Reference Mo1991a, Reference Mob, Reference Moc; Dmitrieva and Dimitriov, Reference Dmitrieva and Dimitrov2002; Dávidová et al. Reference Dávidová, Jarkovský, Matějusová and Gelnar2005). An impact on the morphology of the hard-parts has also been documented for micro-environmental factors related to the host species (Dmitrieva and Dimitriov, Reference Dmitrieva and Dimitrov2002; Huyse and Volckaert, Reference Huyse and Volckaert2002). It is noteworthy that these studies are based on traditional morphometrical methods using linear point-to-point measurements, visual analysis or a combination of both.
Gyrodactylus salaris and G. thymalli are closely related species. Atlantic salmon is regarded the primary host for G. salaris and grayling (Thymallus thymallus) the primary host for G. thymalli. In addition to Atlantic salmon, G. salaris is also a common parasite on rainbow trout (Oncorhynchus mykiss) in hatcheries and farms in Fennoscandia (Malmberg and Malmberg, Reference Malmberg and Malmberg1991; Mo, Reference Mo, Pike and Lewis1994; Koski and Malmberg, Reference Koski and Malmberg1995; Buchmann and Bresciani, Reference Buchmann and Bresciani1997), and has also been recorded on Arctic charr (Salvelinus alpinus) in the wild (Kristoffersen et al. Reference Kristoffersen, Rikardsen, Winger, Adolfsen and Knudsen2005; Knudsen et al. Reference Knudsen, Adolfsen, Sandring, Kristoffersen, Siikavuopio and Rikardssen2007; Robertsen et al. Reference Robertsen, Hansen, Bachmann and Bakke2007; Winger et al. Reference Winger, Kanck, Kristoffersen and Knudsen2008). In a study using traditional linear measurement approaches, Olstad et al. (Reference Olstad, Shinn, Bachmann and Bakke2007) did not find unambiguous support for an a priori host-based separation of G. salaris and G. thymalli. They concluded that environmental factors may blur the taxonomic signal in the phenotype of gyrodactylid populations and stressed the need for more detailed information on the phenotypic plasticity in the morphological markers of the opisthaptoral hard-parts.
The present experimental study examines the effects of the macro- and micro-environmental factors of temperature and host species on shape and size of the hard-parts of G. salaris. The need for such knowledge was stated by Olstad et al. (Reference Olstad, Shinn, Bachmann and Bakke2007). For comparison, the effect of temperature on the hard-parts of G. thymalli was also studied.
MATERIALS AND METHODS
Gyrodactylus stocks
G. salaris on Atlantic salmon from the river Drammenselva (Buskerud County, southeastern Norway) and G. thymalli on grayling from the river Trysilelva (Engerdal, Hedemark County, eastern Norway) were used. Infected salmon and grayling, caught by electro-fishing and fly-fishing, respectively, were transported live to the laboratory in O2-aerated plastic bags containing river water. In the laboratory they were placed in 200 litre grey plastic tanks in charcoal-filtered tap water (flow rate 2–4 L/min). Thereafter, infections were maintained by regularly adding naïve hosts of the corresponding species for >1 month.
Fish hosts
The experimental infra-populations of G. salaris and G. thymalli were established from 1 asexually produced individual, in order to minimize the genetic variation. Infected fish were anaesthetized in 0·04% chlorbutanol and killed before the fins were cut off and examined for parasites under a stereo-microscope with fibre optic illumination. Thereafter, 5 randomly selected Atlantic salmon and graylings were each infected with 1 randomly selected G. salaris and G. thymalli, respectively, by transfer from the excised fins to the anaesthetized recipients. After having given birth, the mother (P generation) was immediately removed, and the progeny (F1 generation) left to establish a new infrapopulation. For each species, 1 successful infrapopulation was maintained for the experiments.
Since G. salaris has been also found on rainbow trout (Mo, Reference Mo, Pike and Lewis1994) and Arctic charr (Kristoffersen et al. Reference Kristoffersen, Rikardsen, Winger, Adolfsen and Knudsen2005; Knudsen et al. Reference Knudsen, Adolfsen, Sandring, Kristoffersen, Siikavuopio and Rikardssen2007; Robertsen et al. Reference Robertsen, Hansen, Bachmann and Bakke2007; Winger et al. Reference Winger, Kanck, Kristoffersen and Knudsen2008), these 2 species were included in the experiments as secondary hosts for G. salaris. Additionally, grayling was also regarded as a potential secondary host for G. salaris, according to previous experimental host preference tests (see Soleng and Bakke, Reference Soleng and Bakke2001; Sterud et al. Reference Sterud, Mo, Collins and Cunningham2002). The hosts used in the experiments were: hatchery-reared Atlantic salmon (1·5–9·4 g; 6–11 cm) from river Drammenselva (Hellefoss-Åmot Kultiveringsanlegg, Hokksund, Buskerud County, Norway), hatchery-reared grayling from river Trysilelva (4·5–6·2 g; 9–11 cm) (Snerta Kultiveringsanlegg, Hedemark County, Norway), hatchery-reared Arctic charr (2·3–9·2 g; 7–11·5 cm) of the Hammerfest stock (Tallvik settefiskanlegg, Alta, Finmark County, Norway), and a commercially reared rainbow trout (1·3–6·9 g; 5·5–9·5 cm) (Valdres ørretoppdrett Røn, Buskerud County, Norway). Fish hosts were maintained in experimental tanks in the aquarium for a minimum of 3 weeks prior to the start of the experiments. All fish hosts were naïve with respect to Gyrodactylus infections.
Infection experiments
In order to minimize variation other than that related to phenotypic plasticity, isogenic parasite populations were used. The isogenic lineages were prepared by infecting a number of individually isolated hosts with a single parasite. When a birth was registered, the parental individual was killed, leaving the first offspring as the founder individual of an isogenic lineage. One lineage of G. salaris and another for G. thymalli were used in the following experiments.
The isogenic lineages of G. salaris and G. thymalli were bred on groups containing 5 hosts under specific environmental regimes (see Table 1). (i) Temperature: in 5 separate tanks, isogenic G. salaris were bred on groups of salmon at 5, 12 and 18°C, respectively and isogenic G. thymalli were bred on groups of grayling at 5 and 12°C. The temperature regimes were run for 30 days (i.e. 1·5 times, 2 times, and >2 times longer than the average life-span of G. salaris on salmon at the respective temperatures according to Jansen and Bakke (Reference Jansen and Bakke1991)). (ii) Host: G. salaris were bred for 30 days on salmon, rainbow trout, Arctic charr and grayling (the latter not in parallel due to difficulties in breeding on grayling) in a common tank at 12°C. In order to prevent cross-infection, the host species groups were separated by keeping them in grey floating plastic boxes (20×10×10 cm) with wire-mesh bottoms to ensure a free flow of fresh water into the boxes. At the end of the experiment, the fish were killed before being stored individually in bottles containing 96% ethanol. Parasite specimens were thereafter sampled from all available hosts representing the experimental groups.
Experimental infections with isogenic Gyrodactylus thymalli originating from River Trysilelva and isogenic G. salaris originating from River Drammenselva on different host species and at different temperatures for analyses of variation in the opisthaptoral hard-parts
(Numbers of structures available for analyses given in parentheses in the following order: hamuli; marginal hooks; ventral bars.)

Image preparation
Using a scalpel blade, the opisthaptors were excised from individual Gyrodactylus specimens. Opisthaptoral hard-parts were thereafter prepared using a slightly modified method of Harris et al. (Reference Harris, Cable, Tinsley and Lazarus1999). The haptors were digested in 75 mm Tris, 10 mm EDTA, 5% SDS, and 100 mg/ml proteinase K, pH 8·0. Following a wash in distilled water, the released hard-parts were mounted in ammonium picrate glycerine (Malmberg's fixative). All hard-part structures were photographed using a Leica DC 500 camera (mounted on a Leica DM 6000B stereomicroscope under a ×100 oil objective with 1×, 1·25× and 1·6× magnification changer). The pictures (2600×2060 pixels resolution) were maximally cropped and, if necessary, rotated using Adobe Photoshop 7.0 (©Adobe Systems Incorporated).
Size of opisthaptoral structures
For comparisons of structure size among relevant groups, 1 measurement was taken from each of the 3 hard-parts, i.e., marginal hook sickle length (MHSL), ventral bar width (VBW) and hamulus total length (HTL) from all individuals included in the analyses (measurements and annotations described by Shinn et al. (Reference Shinn, Hansen, Olstad, Bachmann and Bakke2004) and Olstad et al. (Reference Olstad, Shinn, Bachmann and Bakke2007)).
Shape of opisthaptoral structures
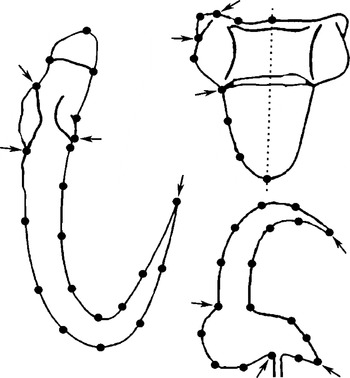
Since the opisthaptoral hard-parts of Gyrodactylus have few unambiguous landmarks such as structure joints or well-defined points of structural extremes, shape is represented mainly by outlines and surfaces. Therefore, instead of using classical point-to-point measurements, the sliding semi-landmark method capturing outlines (Green, Reference Green, Mardia, Gill and Dryden1996; Bookstein, Reference Bookstein1997) was applied. This operation extends the standard Procrustes superimposition procedure: in addition to translating, scaling, and rotating landmark configurations, the semi-landmark points are slid along the outline curve until they match as close as possible the positions of corresponding points of a reference configuration (Adams et al. Reference Adams, Rohlf and Slice2004). Optimally, this gives a data-matrix describing landmark-configurations in which the remaining variation among individuals is due to variation in shape only (i.e., the effects of location, rotation and size are removed mathematically). These data in the matrix can be analysed statistically, revealing significant variation among groups and, visually, revealing the actual shape differences. Before digitizing the landmarks, all specimens were randomized using tpsUtil, Version 1.37 (Rohlf, Reference Rohlf2006b). After digitization, the original order of the specimens was restored. The landmarks were digitalized as illustrated in Fig. 1, using tpsDig, Version 2.10 (Rohlf, Reference Rohlf2006a). Sliding of semi-landmarks according to the minimum bending energy (BE) criterion (Bookstein, Reference Bookstein, Mardia, Gill and Dryden1996, Reference Bookstein1997; Green, Reference Green, Mardia, Gill and Dryden1996; Bookstein et al. Reference Bookstein, Streissguth, Sampson, Connor and Barr2002) and superimposition of shape coordinates by General Procrustes (GP) procedures was performed using tpsrelw Version 1.45 (Rohlf, Reference Rohlf2007).
Template of landmarks as digitalized on digital images of opisthaptoral hard-parts of Gyrodactylus. Totally, 49 landmarks were digitalized from each individual: 21 from hamulus (left), 10 from ventral bar (upper right) and 18 from marginal hook (lower right). All landmarks but those indicated by arrows were defined as sliding semi-landmarks prior to superimposition. Symmetry line of the ventral bar is indicated by a dashed line. (The structures are not in scale).

Statistical analyses
All statistical analyses were performed using the software PAST (Hammer et al. Reference Hammer, Harper and Ryan2001). The number of individuals analysed (n) for each structure is given in Table 1. The linear measurements were not normally distributed for all experimental groups for any of the variables. The analyses were thus performed using pairwise Mann-Whitney tests. The statistical analyses of shape were performed on matrices of partial warp scores of the General Procrustes coordinates. Because the number of degrees of freedom is unclear for configurations based on a number of sliding semi-landmarks (Zelditch et al. Reference Zelditch, Swiderski, Sheets and Fink2004), permutation tests based on Mahalanobis' distances were used for analysing shape differences among groups. In cases with too few individuals compared to variables, non-parametric MANOVA based on Euclidian distance and using permutation calculating P-values (Anderson, Reference Anderson2001) was applied.
Visualization of shape differences
PCA was performed for the Procrustes superimposed shape variables (run on the variance-covariance matrix; shape PCA=Relative Warp analysis when including the uniform component; e.g., Zelditch et al. Reference Zelditch, Swiderski, Sheets and Fink2004) from the 3 analysed structures separately for (i) G. salaris on Atlantic salmon at 5, 12 and 18°C, and G. thymalli on grayling at 5 and 12°C, and (ii) G. salaris on Atlantic salmon, grayling, rainbow trout, and Arctic charr at 12°C. Shape changes along individual principal components were illustrated depicting shape configurations at extremes along the respective principal components. All terminology related to the description of general and specific features of the hard-parts structures is similar to the terminology described by Shinn et al. (Reference Shinn, Hansen, Olstad, Bachmann and Bakke2004).
RESULTS
Size of opisthaptoral structures
Temperature
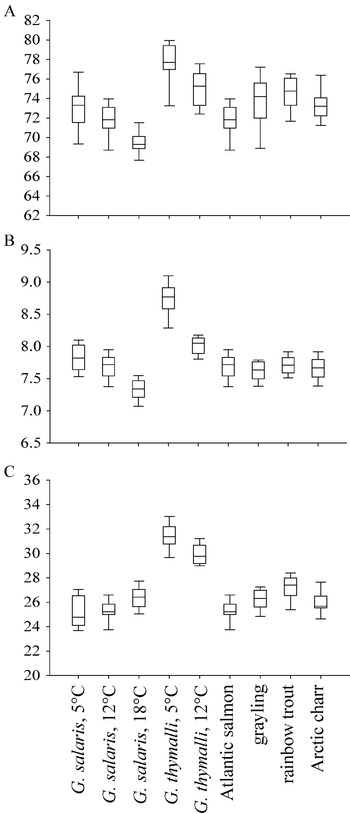
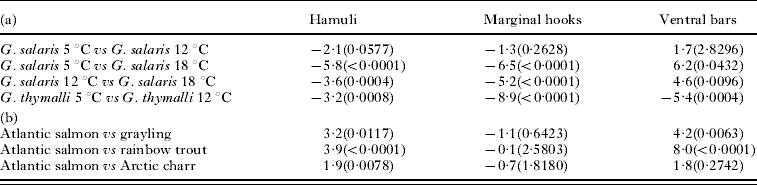
The size of the hamuli and marginal hooks from G. salaris were temperature dependent, as these structures were generally bigger at lower water temperature (Table 2, Fig. 2). However, ventral bars from G. salaris did not follow this pattern, and the largest structures were recorded at highest temperature (18°C; Table 2, Fig. 2). Concerning G. thymalli all 3 opisthaptoral structures (hamuli, marginal hooks, and ventral bars) followed the pattern of being bigger at lower water temperature. The opisthaptoral structures of G. thymalli were usually larger than those of G. salaris but there was an apparent overlap between the largest hamuli and marginal hooks of G. salaris and the smallest from G. thymalli (Fig. 2). However, for ventral bar size no overlap was observed between G. salaris and G. thymalli within the studied temperatures (Table 2, Fig. 2).
Box plot showing 25–75 percentiles (box), median (horizontal line inside box) and 10–90 percentiles (whiskers) of centroid size from groups of Gyrodactylus salaris grown on Atlantic salmon at 5, 12 and 18°C, G. thymalli grown at 5 and 12°C and from G. salaris grown on Atlantic salmon, grayling, rainbow trout and Arctic charr (all at 12°C). (A) hamuli (hamulus total length (HTL)), (B) marginal hooks (marginal hook sickle length (MHSL)), and (C) ventral bars (ventral bar width (VBW)).

Percentage differences between measurements of hamuli (hamulus total length; HTL), marginal hooks (marginal hook sickle length; MHSL) and ventral bars (ventral bar width; VBW) among (a) groups of Gyrodactylus salaris grown on Atlantic salmon at 5, 12 and 18°C and G. thymalli grown at 5 and 12°C and (b) G. salaris grown on Atlantic salmon, grayling, rainbow trout and Arctic charr (all at 12°C)
(P-values from pairwise Mann-Whitney tests are given in parentheses. The P-values are Bonferroni corrected according to the number of comparisons ((a): 4; (b): 3).)

Shape of opisthaptoral structures
Temperature
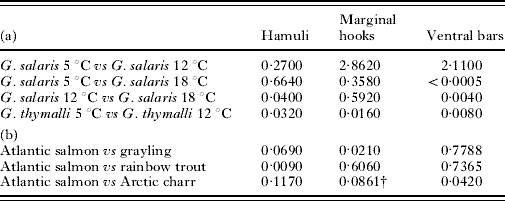
The shapes of the hamuli of G. salaris were significantly different at 12 and 18°C. The shape of the ventral bars differed significantly between 5 and 18°C and between 12 and 18°C (Table 3). However, there was no evidence for altered shape of the marginal hooks with temperature in G. salaris. There was no uniform association between shape and temperature in the opisthaptoral hard-parts from G. salaris. In G. thymalli, all hard-parts were significantly different in shape between 5 and 12°C. There was a stronger signal for shape differences in G. thymalli at 5 and 12°C than in G. salaris over the same temperature range (see Table 3).
P-values from pair-wise multivariate permutation tests of principal components scores from GPA superimposed shape configurations among (a) groups of Gyrodactylus salaris grown on Atlantic salmon at 5, 12 and 18°C and G. thymalli grown at 5 and 12°C and (b) G. salaris grown on Atlantic salmon, grayling, rainbow trout and Arctic charr (all at 12°C)
(The P-values are Bonferroni corrected according to the number of comparisons ((a): 4; (b): 3).)

† Sample sizes too small to calculate Mahalanobis' distances. Alternative test run: non-parametric ANOVA post-hoc.
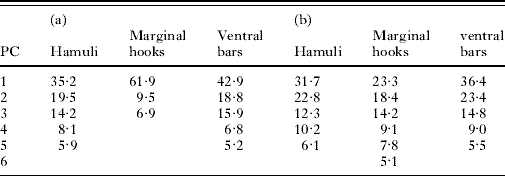
The visualization of shape differences through shape PCA analysis was performed only for statistically significant different groups (the complete range of figures from the shape PCA analyses is given as supplementary material in the Appendix). The percentage of total variation explained in the principal components, based on Eigen-values from the shape PCA analyses are presented in Table 4.
Percentage explanation of total variation from shape PCA analyses of procrustes superimposed shape variables from hamuli, marginal hooks and ventral bars from (a) groups of Gyrodactylus salaris grown on Atlantic salmon at 5, 12 and 18°C and G. thymalli grown at 5 and 12°C and (b) G. salaris grown on Atlantic salmon, grayling, rainbow trout and Arctic charr
(Only values >5% are included in the table.)

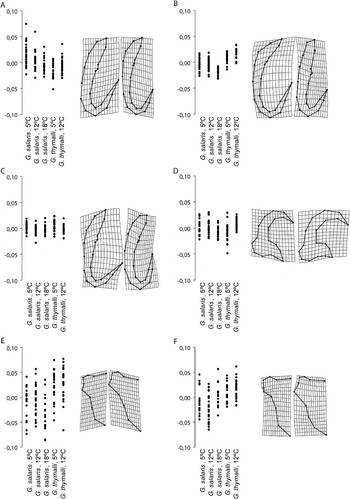
For the hamuli of G. salaris, there was a slight pattern of separation between shape configurations at 12 and 18°C in PC1, and a more pronounced pattern in PC2 (Fig. 3A, B). Change in shape between G. salaris at 12 and 18°C, as a combination of these two components, could be assigned to the hamuli being more upright structures with a shorter point at 12°C than at 18°C (Fig. 3A, B). The most pronounced shape differences for G. thymalli at 5 and 12°C was detected in PC4 (Fig. 3C). The shape change along this component was basically a relative shortening of the hamulus root, a rounding of the more robust shaft and point, and a closing of the aperture (Fig. 3C). The shape of the marginal hooks of G. thymalli at 5 and 12°C differed in PC2 only (Fig. 3D). From 5 to 12°C the shape changed mainly by a lowering of the heel as well as a shortening and rising of the toe (Fig. 3D).
(A–F) Illustrations of shape changes along single principal components (PC) for Procrustes superimposed shape variables from opisthaptoral hard-parts from isogenic Gyrodactylus salaris parasitizing Atlantic salmon at 5°C, 12°C, and 18°C, and from isogenic G. thymalli parasitizing grayling at 5°C and 12°C. (A–C) hamuli; (A) PC1, (B) PC2, (C) PC4; (D) marginal hooks; PC2 and (E–F) ventral bars; (E) PC1, (F) PC2. Left: Plots of the distribution of individuals from experimental groups along single PC. Right: Illustrations of shape changes along relevant PC. Pictures to the left represent shape configurations in the point (−0·1) along the respective principal components, whereas images to the right represents shape configurations in the point (+0·1).

In G. salaris the ventral bar shapes at 18°C were slightly different in PC1 than those at 5 and 12°C (Fig. 3E). The individuals at 18°C had a more abruptly curved lower part of the ventral bar membrane and a convex rather than concave ventral bar upper ridge (Fig. 3E, F). For G. thymalli, there were no clear trends in shape change in ventral bars at 5 and 12°C.
Host
Despite significant differences in single pair-wise comparisons (Table 3), there was no uniform pattern of shape differences for the hard-parts from individuals of G. salaris grown on Atlantic salmon versus those grown on secondary hosts.
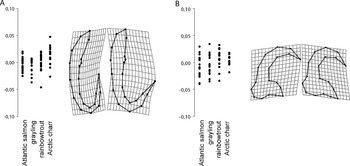
Concerning the hamuli, there were only minor shape differences between specimens of G. salaris grown on Atlantic salmon and those from rainbow trout. However, in PC2, the rainbow trout group were slightly different from the Atlantic salmon group (Fig. 4A). The shape changes along this component (Atlantic salmon→rainbow trout) were an increased opening of the aperture, an increased general robustness, and a reduced rounding of shaft and root (Fig. 4A).
(A–B) Illustrations of shape changes along single principal components (PC) for Procrustes superimposed shape variables from opisthaptoral hard-parts from isogenic Gyrodactylus salaris parasitizing Atlantic salmon, grayling, rainbow trout and Arctic charr. (A) hamuli; PC2, (B) marginal hooks; PC1. Left: Plots of the distribution of individuals from experimental groups along single PC. Right: Illustrations of shape changes along relevant PC. Images to the left represents shape configurations in the point (−0·1) along the respective principal components, whereas pictures to the right represent shape configurations in the point (+0·1).

There were no directional shape differences observed for the marginal hooks of G. salaris from Atlantic salmon and grayling, despite statistically significant differences (Table 3). A trend, however, was observed along PC1 for parasites on Atlantic salmon versus parasites on rainbow trout and Arctic charr (Fig. 4B). Parasites from rainbow trout and Arctic charr had a more closed marginal hook aperture as well as elongated and less rounded toes (Fig. 4B).
For the ventral bars, there was a statistically significant difference in shape between parasites from the Atlantic salmon group and Arctic charr. Otherwise, there was no signal along the component in the shape PCA analysis for this structure (Table 3). Accordingly, ventral bar shape changes could not be interpreted.
DISCUSSION
Isogenic lineages of the monogenean flatworms G. salaris and G. thymalli were established in order to minimize variation in the opisthaptoral phenotype, other than variation caused by the environment. Although we consider the approach straightforward for the analysis of phenotypic plasticity in gyrodactylids, the observed variation in the experimentally used lineages may not necessarily represent entirely the G. salaris and G. thymalli populations from which the two initial parasite specimens originated. This latter point is important to consider in relation to taxonomic studies of G. salaris and G. thymalli.
Temperature effects on size and shape of the hard parts
In the present study, the ventral bars of G. salaris were bigger at higher temperature, a trend that is the contrary to that observed for the hamuli and the marginal hooks. For these latter structures, the results confirmed the previously reported size–temperature patterns (Malmberg, Reference Malmberg1970; Kulemina, Reference Kulemina and Skarlato1977; Mo, Reference Mo1991a, Reference Mob, Reference Moc; Dávidová et al. Reference Dávidová, Jarkovský, Matějusová and Gelnar2005; Dmitrieva and Dimitriov, Reference Dmitrieva and Dimitrov2002; Huyse and Volckaert, Reference Huyse and Volckaert2002), i.e. size of the opisthaptoral hard-parts decreases with higher temperatures. However, Mo (Reference Mo1991a, Reference Mob, Reference Moc) and Dmitrieva and Dimitriov (Reference Dmitrieva and Dimitrov2002), although not discussing their findings, also reported several ventral bar measurements for G. salaris and G. alviga, respectively, that increased in size with increasing temperature.
The positive size–temperature correlation for the ventral bar of G. salaris could be due to a different chemical composition and growth process than for the hamuli and the marginal hooks. According to Shinn et al. (Reference Shinn, Gibson and Sommerville1995), ventral bars in G. salaris, G. caledoniensis and G. colemanensis are clearly different in their chemical composition from the hamuli and marginal hooks of the respective species; they contain more calcium and are less keratinized than the 2 latter structures. Furthermore, the ventral bar of Gyrodactylus is the last hard part to develop during ontogeny (Malmberg, Reference Malmberg1990; Cable and Harris, Reference Cable and Harris2002) and should, accordingly, be more affected by a shorter developmental period. At 18°C embryogenesis of Gyrodactylus takes ~3 days, while at 5°C it lasts for up to 15 days (see Jansen and Bakke, Reference Jansen and Bakke1991). The observed pattern could imply that, unlike hamuli and marginal hooks, the ventral bars grow post-birth; such post-birth growth was found, e.g. for hamulus root in Gyrdicotylus gallieni by Jackson and Tinsley (Reference Jackson and Tinsley1995). If this is correct, it is surprising that there were inverse size–temperature correlations for the ventral bar in G. salaris and G. thymalli. However, the observation is preliminary, as there are no data for G. thymalli at 18°C.
There was no consistent trend of shape differences for the hamuli and marginal hooks of G. salaris in the temperature range 5 to 18°C. However, the shapes of the ventral bar at 18°C were different from those at both 5°C and 12°C (which were not significantly different from each other). This may further support the above hypothesis that the ventral bar of G. salaris develops by a different process than hamuli and marginal hooks. The shape of ventral bars at 18°C as compared with those at 5 and 12°C (shape PCA analysis) were basically more compact and robust. The increased robustness was consistent with the observation from linear measurements that the structures at 18°C were bigger. Again, this could be taken as a support for a previous hypothesis that the development of ventral bars in G. salaris is dependent on temperature rather than time. In G. thymalli, all opisthaptoral structures were significantly different in shape at 5 and 12°C. It is interesting to note that generally, there was a stronger signal of differences in shape between G. thymalli at 5 and 12°C than among G. salaris in the temperature range 5 to 18°C (except ventral bars).
The impact of primary- and secondary hosts on size and shape of the hard parts
The size of the hard parts of G. salaris were similar (marginal hooks) or larger (hamuli and ventral bar) when grown on the secondary hosts compared to on the primary host, Atlantic salmon. This is in accordance with a previous report by Mo (Reference Mo1991b) who also reported larger hamuli in G. salaris from rainbow trout in southern Norway as compared with G. salaris on parr of Atlantic salmon in northern and north-western Norwegian rivers. In contrast, Dmitrieva and Dimitriov (Reference Dmitrieva and Dimitrov2002) found that specimens of G. alviga parasitizing the primary host have larger hard parts than those parasitizing a secondary host. They attributed this difference to an effect of unfavourable conditions, assuming that, in such instances, an increased reproductive rate and accelerated embryogenesis would decrease the size of the opisthaptoral hard parts. The present observations for G. salaris are, however, more in line with the assumption of extended embryogenesis on less favourable hosts. Basically, the postulated mechanism is the same as that suggested for explaining the effect of varying temperature on hamuli and marginal hooks. New experimental evidence that G. salaris has a longer generation time on grayling than on Atlantic salmon supports our interpretation (O.G. Øvstaas and T.A. Bakke, unpublished information). The observation that certain linear measurements were not normally distributed for some groups could be an indicator of suboptimal conditions and perhaps disturbances of embryonic development. However, the data did not reveal any consistent pattern to support such a hypothesis. Further experimental work would be required to explore this topic.
The shape of the hamuli and marginal hooks of G. salaris were different when the parent developed on secondary hosts compared to the primary host, Atlantic salmon. There was, however, no consistent pattern in these shape differences. The shape of hamuli and marginal hooks was affected more by the host than the shape of the ventral bar. This contradicts, to some extent, the results of the temperature experiments, in which the shape of the ventral bar was affected most. Partial starvation may explain the non-uniform pattern of shape differences since this is known, for example, to potentially cause distorted development of the F2 embryo and the opisthaptoral hard parts in G. gasterostei (see Cable et al. Reference Cable, Tinsley and Harris2002).
Geometric morphometrics in Gyrodactylus studies
The present study illustrates that the taxonomically informative opisthaptoral hard-parts of Gyrodactylus flatworms show different responses to temperature and host species. The pattern of these responses with respect to size and shape varies, even between the closely related species G. salaris and G. thymalli. These findings may explain why Olstad et al. (Reference Olstad, Shinn, Bachmann and Bakke2007) failed to unambiguously discriminate wild populations of G. salaris and G. thymalli with morphometric means according to an a priori species assignment. Although few Gyrodactylus species have been studied in more detail and reports on phenotypic plasticity in the genus are limited (cf. Harris, Reference Harris1998), it can be safely assumed that such problems in morphometry-based species identification are common for Gyrodactylus.
Linear and geometric morphometrics is powerful for unravelling minute differences in size and shape of morphological structures and for discovering new morphological characters and character states (MacLeod, Reference MacLeod, MacLeod and Forey2002). The use of sliding semi-landmarks provides opportunities for studies of the opisthaptoral hard-parts of Gyrodactylus. Following this, a number of potential studies might emerge. One further extension could be to define sets of diagnostic measurements for a range of species of Gyrodactylus. Another interesting aspect would be the functionality of the opisthaptoral hard-parts in relation to site-specificity on the host.
This work was supported by the Norwegian Research Council ‘Wild Salmon Programme’ (Project no. 145861/720) and the National Centre for Biosystematics (Project no. 146515/420, co-funded by the NRC and the NHM, University of Oslo, Norway). We thank Ø. Fladaas, F. Løvik, M. Nordsveen and E. Røn for providing hatchery reared salmon, Arctic charr, grayling, and rainbow trout, respectively. The procedures described in this paper were approved by the Norwegian Animal Research Authority (NARA) (no. 07/9365).