INTRODUCTION
In Brazil and in various parts of the world, the coastal area is undergoing a rapid process of population and economic expansion that includes activities that negatively impact the marine and coastal environments (Stori et al., Reference Stori, Cardoso and Beccato2006). These impacts often generate changes in ecological conditions and habitats, which causes a loss of biodiversity (Costa et al., Reference Costa, Neumann-Leitão, Souza-Santos, Eskinazi-Leça, Neumann-Leitão and Costa2004). Studies that assess the impact of these changes on the environment and biota are important because they support the adoption of protection and management measures for these ecosystems.
Phytoplankton consists of several groups of organisms, including cyanobacteria, diatoms, dinoflagellates, chlorophyta, coccolithophorids, silicoflagellates and cryptophytes (Lourenço & Marques Júnior, Reference Lourenço, Marques Junior, Pereira and Soares-Gomes2009). Understanding the structure and functioning of aquatic ecosystems requires the study of these species of microalgae, and the diversity of these species can be analysed according to species richness and taxonomic knowledge (Wetzel, Reference Wetzel1993).
Planktonic algae are ecologically important because they are the primary producers in the marine environment. They are chiefly responsible for initiating and maintaining the marine food web by releasing dissolved oxygen into the water, and are considered excellent bioindicators of water and environmental quality (Round, Reference Round1983; Medeiros et al., Reference Medeiros, Macedo, Feitosa and Koening1999; Eskinazi-Leça et al., Reference Eskinazi-Leça, Koening, Silva-Cunha, Eskinazi-Leça, Neumann-Leitão and Costa2004). Together with zooplankton, they are the direct food source of coral polyps and of many other animals that inhabit coral reefs.
The environmental changes that alter factors such as light, temperature, substrate, salinity, pH and nutrient availability directly impact the biomass, and the density, community structure and productivity of phytoplankton (Eskinazi-Leça & Koening, Reference Eskinazi-Leça and Koening1991).
The rapid response of the phytoplankton community to the rapid physical and chemical alterations of the aquatic environment affords it a very dynamic nature, with high rates of reproduction and loss. Changes in composition and structure of this community can lead to profound changes at all trophic levels (Valiela, Reference Valiela1995; Brandini et al., Reference Brandini, Lopes, Gutseit, Spach and Sassi1997).
The phytoplankton community is the main food source in the pelagic marine environment. However, it assumes a secondary role in reef ecosystems in relation to the primary production of zooxanthellae. Although this community is not chiefly responsible for the primary productivity of this ecosystem, it is ecologically important because it plays a fundamental role in the nutrition and maintenance of many organisms that are filter feeders and also inhabit coral reefs, including coral polyps (Sorokin, Reference Sorokin and Dubinsky1990). Moreover, it is considered an excellent indicator of water quality due to its rapid response to environmental impact (Eskinazi-Leça et al., Reference Eskinazi-Leça, Moura, Silva-Cunha, Koening, Tabarelli and Silva2002).
The beach of Porto de Galinhas stands out among the reef environments of the Brazilian coast because of its natural pools of warm and transparent waters. This main attraction makes this beach one of the most popular national and international tourist destinations in the north-east coast of Brazil (Mendonça, Reference Mendonça2004).
Taking into account the importance of the environmental and socioeconomic conservation of the reef ecosystem of Porto de Galinhas and the strong human pressure to which it is subjected, due to real estate speculation and disorganized tourism, there is a need to better understand this ecosystem in order to monitor and maintain its fauna and flora. Consequently, several environmental works have been carried out in the area, including evaluations of phytoplankton biomass and productivity (Fonseca et al., Reference Fonseca, Passavante, Maranhão and Muniz2002; Machado et al., Reference Machado, Feitosa, Bastos and Travassos2007, Reference Machado, Feitosa, Koening, Flores-Montes, Bastos and Jales2014; Barradas et al., Reference Barradas, Amaral, Hernández, Flores-Montes and Steiner2012).
The aim of this paper is to evaluate the structure of the phytoplankton community (composition, abundance, frequency, specific diversity, evenness) and the influence of hydrological parameters on this community. As this is the first survey on the structure of this community, it will contribute valuable knowledge on the ecology of this environment.
Study area
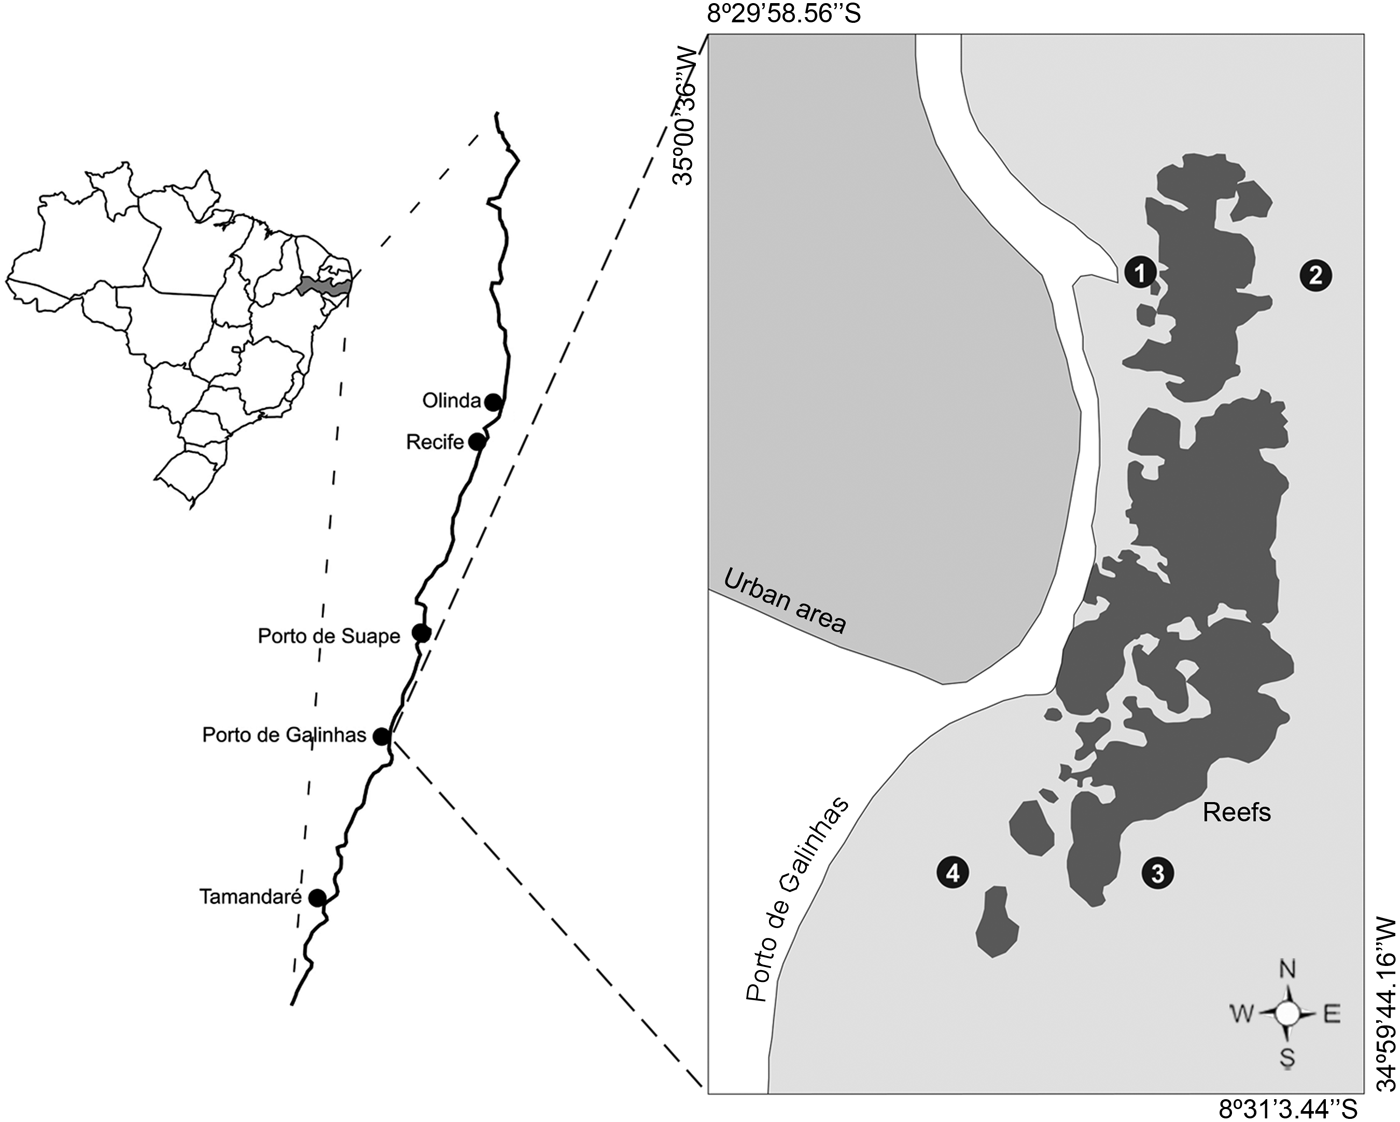
The beach of Porto de Galinhas is situated in the municipality of Ipojuca, state of Pernambuco, 50 km south of the city of Recife (8°30′17″S 35°00′18″W). It presents reef formations that are characteristic of the coast of Pernambuco. These formations correspond to lines of beachrock that are generally parallel to the coast and serve as a substrate for the development of algae and corals (Manso et al., Reference Manso, Corrêa and Guerra2003).
The reef area is about 1.5 km long and has varying widths, with a central portion that measures 0.38 km. It presents a highly diversified flora and fauna that is characteristic of a reef environment.
The direction of the winds on the beach of Porto de Galinhas is predominantly of E-SE orientation from April to September and of E-NE orientation from October to March (CPRH, 1997).
The rivers that are closest to the reef environment of Porto de Galinhas are the Maracaípe River toward the south, with a mouth that is located at a distance of around 3 km, and the Suape port complex toward the north, formed by the rivers Ipojuca, Merepe, Tatuoca and Massangana, at a distance of around 10 km.
According to the Köppen classification, the climate is considered type As’ with autumn-winter rains (Andrade & Lins, Reference Andrade and Lins1965). It is therefore characterized as having two distinct periods in the rainfall regime: a dry season or drought from September to February (spring-summer), and a rainy season from March to August (autumn-winter). The average annual precipitation is 2050 mm and the temperatures range from 24 to 32°C (Chaves, Reference Chaves1991; Torres & Machado, Reference Torres and Machado2011).
MATERIALS AND METHODS
The samples were collected during 4 months of the rainy season (May, June, July and August 2010) and 4 months of the dry season (October, November and December 2010, and January 2011) on the surface of the water column, at the low tide and high tide of a same day, during the syzygy.
Four fixed sampling stations surrounding the reef area were established based on geomorphology and local hydrodynamics. Two of these points were between the reefs and the beach and two points were on the opposite side. Points 1 (8°30′14.58″S 34°59′57.16″W) and 2 (8°30′11.35″S 34°59′46.58″W) are situated at the north end of the reef, and points 3 (8°30′50.18″S 35° 0′8.61″W) and 4 (8°30′57.34″S 34°59′58.56″W) at the southern end of the reef (Figure 1).
Location of sample collection points at the coastal zone of Porto de Galinhas, PE, Brazil. (Source: Google Earth, 2015).

Temperature was determined using a thermometer with a scale of −10 to 60°C. The transparency of the water was calculated using a Secchi disk. Salinity was determined using a manual refractometer (ATAGO). Dissolved oxygen was determined using the modified Winkler method (Strickland & Parsons, Reference Strickland and Parsons1972) and its saturation value according to the UNESCO tables (1973). Suspended particulate matter (SPM) was determined using the method of the Woods Hole Institution (Melo et al., Reference Melo, Summerhayes and Toner1975). Dissolved nutrient salts, dissolved inorganic nitrogen (DIN = ammoniacal N + nitrite + nitrate) and phosphate were calculated using the methods described by Strickland & Parsons (Reference Strickland and Parsons1972), and silicate was calculated according to Grasshoff et al. (Reference Grasshoff, Ehrhardt and Kremling1983). Phytoplankton biomass was determined using the spectrophotometric method of UNESCO (1966).
For the analysis of phytoplankton density (number of cells l−1), the samples were collected in a Niskin bottle and fixed in Lugol's solution. For laboratory analysis, 10 ml sedimentation chambers were used in combination with an inverted microscope according to the Utermöhl method (Hasle, Reference Hasle and Sournia1978; Edler, Reference Edler1979; Ferrario et al., Reference Ferrario, Sar, Sala, Alvear, Ferrario, Oliveira Filho and Sar1995).
The samples for the study of phytoplankton were collected using 5 min horizontal tows with a plankton net with a 20 µm mesh. The samples were subsequently fixed with neutral formaldehyde solution to a final concentration of 4% according to the technique of Newell & Newell (Reference Newell and Newell1963). The composition of phytoplankton flora was established by observing the samples using an optical microscope with 100 and 400× magnification. Once the samples were homogenized, aliquots of 0.5 ml were removed and placed between a slide and a coverslip. All the organisms observed on the slide were considered.
Taxonomy was identified by consulting specialized literature. The international database Algaebase was used to classify and check the scientific names of the taxa (Guiry & Guiry, Reference Guiry and Guiry2015).
Relative abundance of the taxa was calculated as described by Lobo & Leighton (Reference Lobo and Leighton1986), and the frequency of occurrence was calculated using the formula described by Mateucci & Colma (Reference Mateucci and Colma1982).
The ecological classification of infrageneric taxa was based on Moreira Filho et al. (Reference Moreira Filho, Yalente-Moreira, Souza-Mosmann and Cunha1990, Reference Moreira Filho, Eskinazi-Leça and Valente-Moreira1994–1995, Reference Moreira Filho, Eskinazi-Leça, Valente-Moreira and Cunha1999) and Torgan & Biancamano (Reference Torgan and Biancamano1991). For the other groups, the same bibliography that was consulted for taxonomic identification was used.
The specific diversity of the phytoplankton was evaluated using the Shannon index (Reference Shannon1948), and the evenness was calculated according to Pielou (Reference Pielou1977).
The biological data were numerically evaluated using non-parametric multidimensional scaling (MDS), followed by Similarity Analysis (ANOSIM) to test the significance of the similarities. The SIMPER routine was also performed to check the main group-forming species. Then, the Bio-Env procedure was used to find the group of abiotic variables that best explains the configuration of biological variables, using the software Primer® 6.1.12. The non-parametric Kruskal–Wallis test, via Statistica® 8.0 software, was applied to test differences in seasonality, spatiality and tides among the abiotic variables, diversity and evenness. The P-values ≤ 0.05 were considered significant.
RESULTS
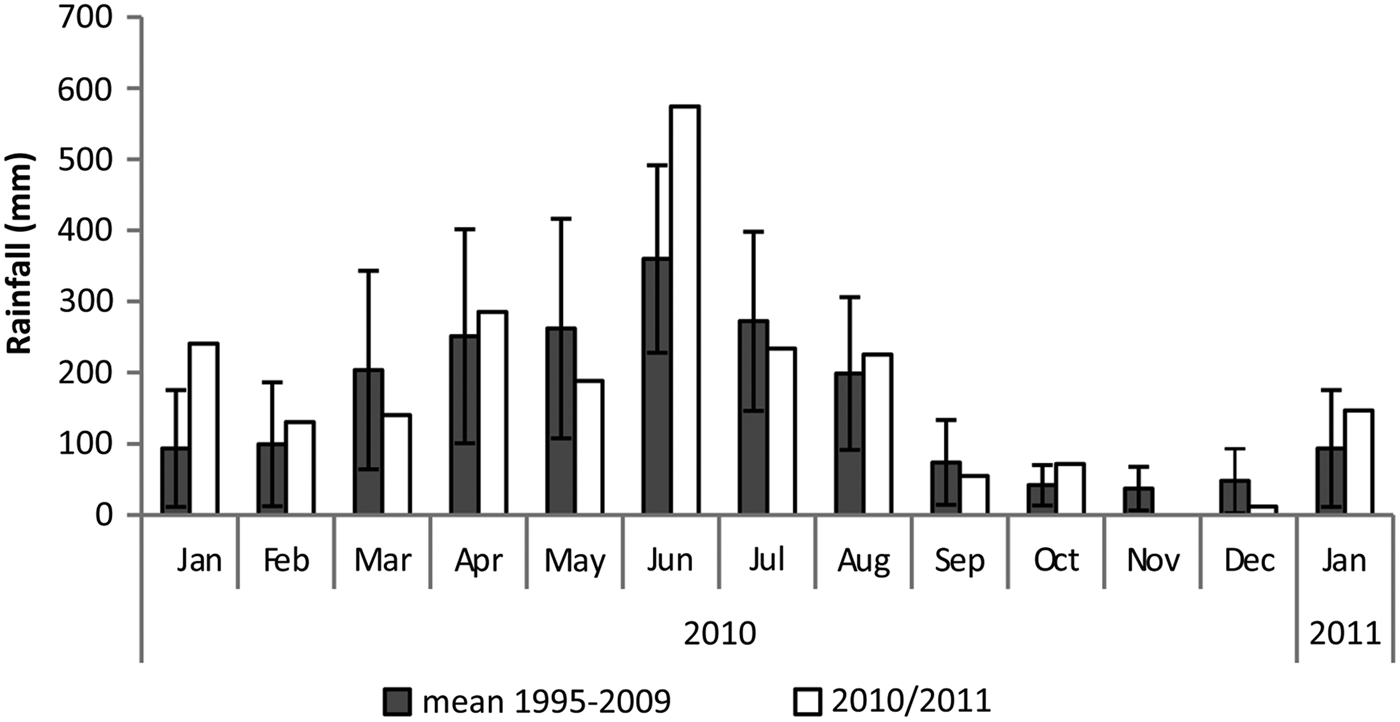
The monthly distribution of rainfall in the studied months was the same as the average distribution of the 15 previous years, with the exception of June 2010, when rainfall was higher, and November 2010, when rainfall was below average (Figure 2). The high rainfall observed in June was caused by the Easterly Wave Disturbance (EWD) that occurred 5 days before the collection day. In Porto de Galinhas, rainfall in the studied period matched the climatic pattern of the area, with autumn-winter rain. Total annual precipitation did not vary in relation to the average rainfall of the previous 15 years, with the exception of June 2010.
Rainfall data from the Experimental Station of Porto de Galinhas-PE in 2010 and 2011 and the average historical monthly values (1995–2009). Source: APAC.

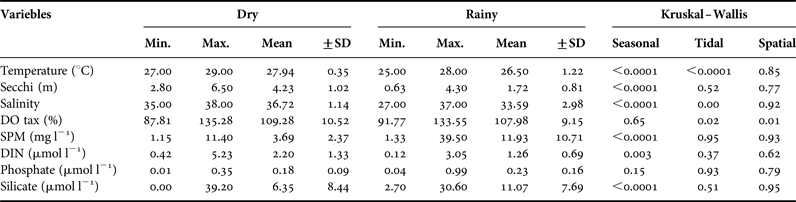
Among the abiotic variables, water temperature showed a significant seasonal variation, with higher values in the dry season. Salinity showed a seasonal variation, with lower values during the rainy season, especially in June with a minimum of 27, and a tidal variation, with lower values at low tide. The SPM in the waters of Porto de Galinhas showed a seasonal pattern, with significantly higher values during the rainy season. Transparency showed an opposite pattern. Most of the dissolved oxygen saturation values were above 100%. Highest values were recorded at low tide (Table 1). Points 1 and 4 presented greater values in relationship to the other points. Among the dissolved nutrients, DIN and silicate showed a well-defined seasonal variation, with higher values in the rainy season (Table 1).
Biological and abiotic variables in dry and rainy seasons (Min., minimum; Max., maximum; Ave., average and SD, standard deviation) and the Kruskal–Wallis test with P values for the various treatments (seasonal, spatial and tidal).

*P ≤ 0.05.
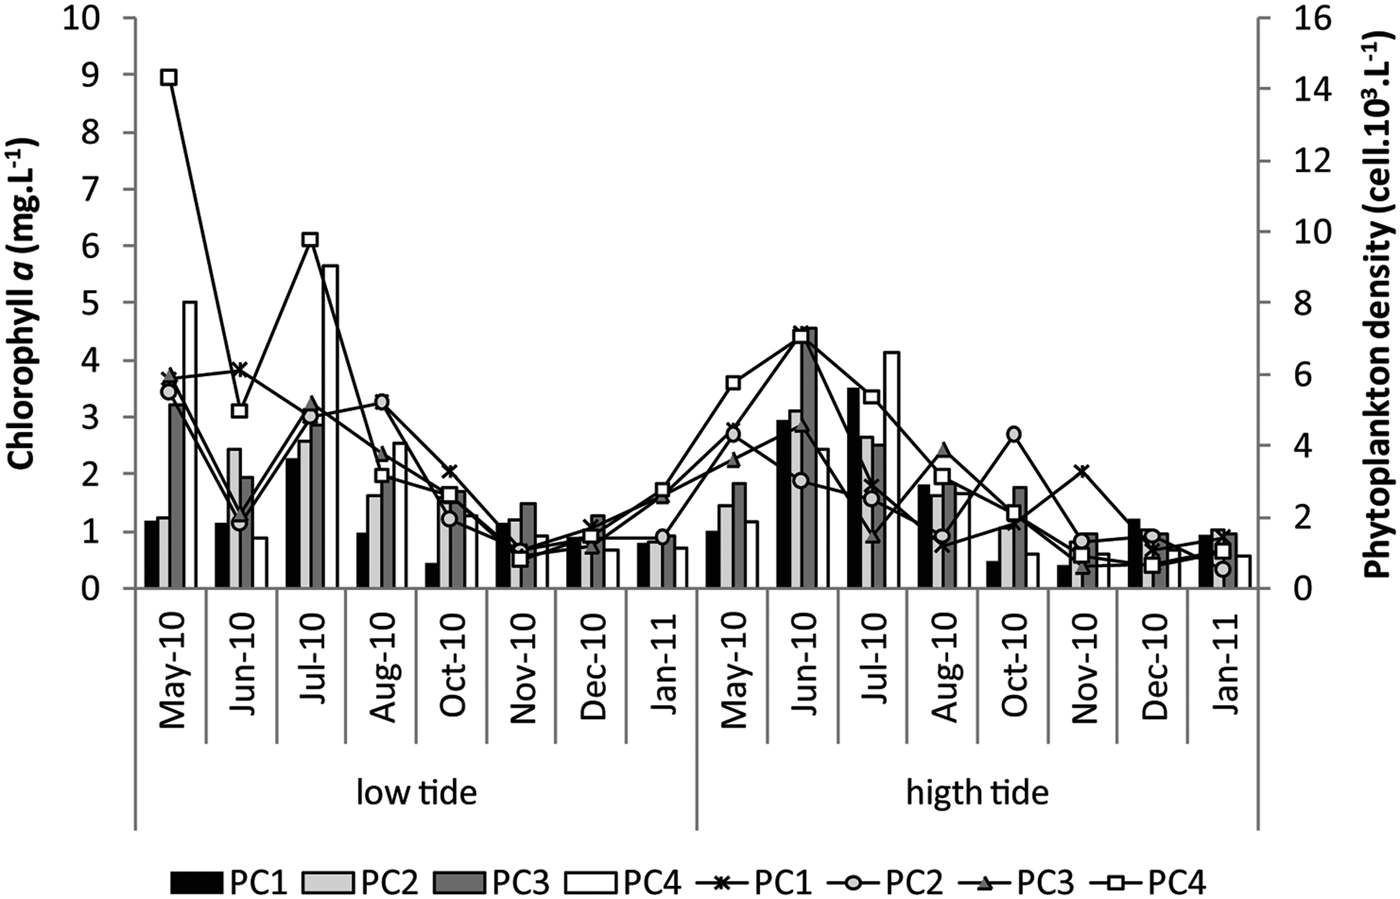
Phytoplankton biomass ranged from 0.42 to 5.66 mg m−3, showing a seasonal variation with higher values during the rainy season (P < 0.0001) (Figure 3). No significant spatial or tidal variations were observed. However, it should be noted that peaks of chlorophyll a were found in the rainy season at points 3 and 4.
Chlorophyll a (mg m−3) (bars) and phytoplankton density (lines) surrounding the reef ecosystem of Porto de Galinhas, PE, Brazil, on both rainy (May, June, July and August/10) and dry season (October, November, December/10 and January/11).

Phytoplankton density ranged from 0.50 to 14.3 cells 103 l−1 and accompanied the variation of phytoplankton biomass (Figure 3), with higher values in the rainy season (4.71 average cell 103 l−1) in comparison with the dry season (1.68 cells 103 l−1) (P < 0.0001). The highest values of phytoplanktonic density, as highest values of biomass, were observed in point 4 in May and July at low tide.
Based on data obtained from the microscopic analysis of phytoplankton samples taken from the reef area of Porto de Galinhas, it was possible to identify 192 taxa distributed into six phyla. The phylum Ochrophyta was represented by 124 taxa, contributing with 64.6% of the flora, followed by the phylum Dynophyta with 37 taxa (19.3%), Cyanobacteria with 19 taxa (9.9%), Chlorophyta with seven taxa (3.6%), Euglenozoa with four taxa (2.1%) and one Cryptophyta (0.5%) (online Appendix 1, available at supplementary material).
Taxonomic richness ranged from 5 to 48, averaging 35 in the rainy season and 15 in the dry season, and presented a significant seasonal variation (P < 0.001).
In terms of frequency of occurrence of the identified taxa, only three species (1.5%) were categorized as highly frequent, namely Ostreopsis ovata Fukuyo, 1981, Paralia sulcata (Ehrenberg) Cleve, 1873 and Thalassiosira leptopus (Grunow ex Van Heurck) Hasle & G. Fryxell, 1977. Most taxa (63.9%) were considered sporadic, 7.2% were considered frequent, and 27.3% were considered infrequent. In relation to relative abundance, Trichodesmium erythraeum Ehrenberg ex Gomont, 1892 and O. ovata were the only dominant species. Trichodesmium erythraeum was dominant in point 2 at high tide in October, and O. ovata was dominant in point 1 at low tide and in four samples of the dry season.
According to the consulted bibliography, infrageneric phytoplankton surrounding the reef environment of Porto de Galinhas were classified according to the following categories: neritic marine plankton (28.6%), oceanic marine plankton (15%), neritic/oceanic marine plankton (3.6%), neritic/estuarine plankton (1.4%), estuarine plankton (0.7%), freshwater plankton (8.6%), neritic tycoplankton (32.9%), estuarine tycoplankton (6.4%), estuarine/neritic tycoplankton (0.7%) and freshwater tycoplankton (2.1%).
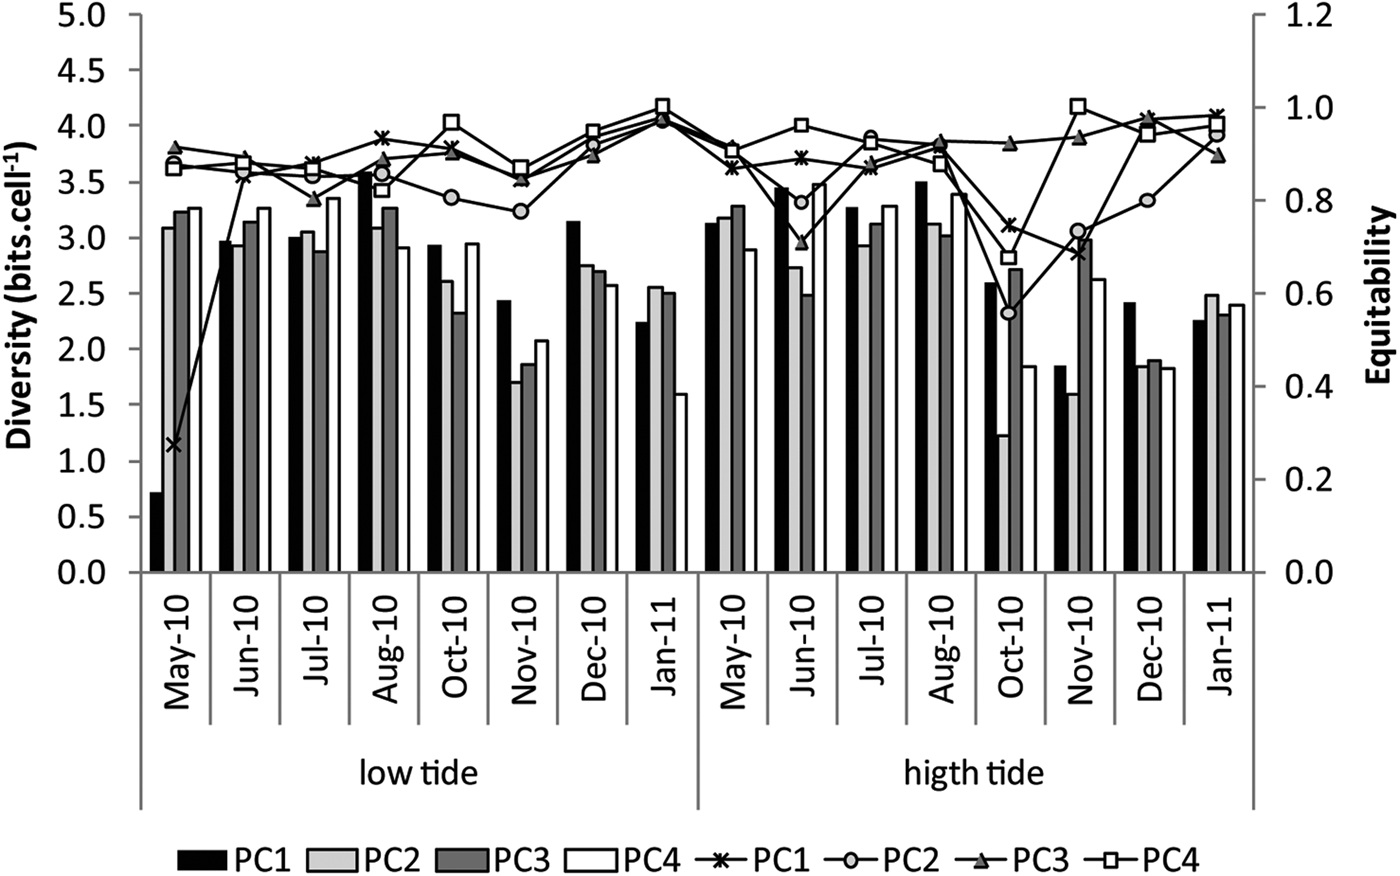
The specific diversity indexes varied between 0.72 and 3.59 bits cell−1. The phytoplankton community was classified as having high diversity in 25.9% of the samples, all during the rainy season; average diversity in 53.7% of the samples, especially in the rainy season; low diversity in 18.5% of the samples, mainly in the dry season; and very low diversity in 1.9% of the samples, in the dry season at high tide (Figure 4). Water temperature showed a significant seasonal variation (P < 0.0001), with higher numbers in the dry season (average of 3.07 bits cell−1) in comparison with the rainy season (average of 2.31 bits cell−1).
Specific diversity index (bars) and eveness (lines) surrounding the reef ecosystem of Porto de Galinhas, PE, Brazil, on both rainy (May, June, July and August/10) and dry season (October, November, December/10 and January/11).

Evenness values ranged from 0.27 to 1, with an average of 0.87, representing a distribution that tends toward uniformity and high evenness. No significant seasonal, spatial or tidal variation was observed (Figure 4).
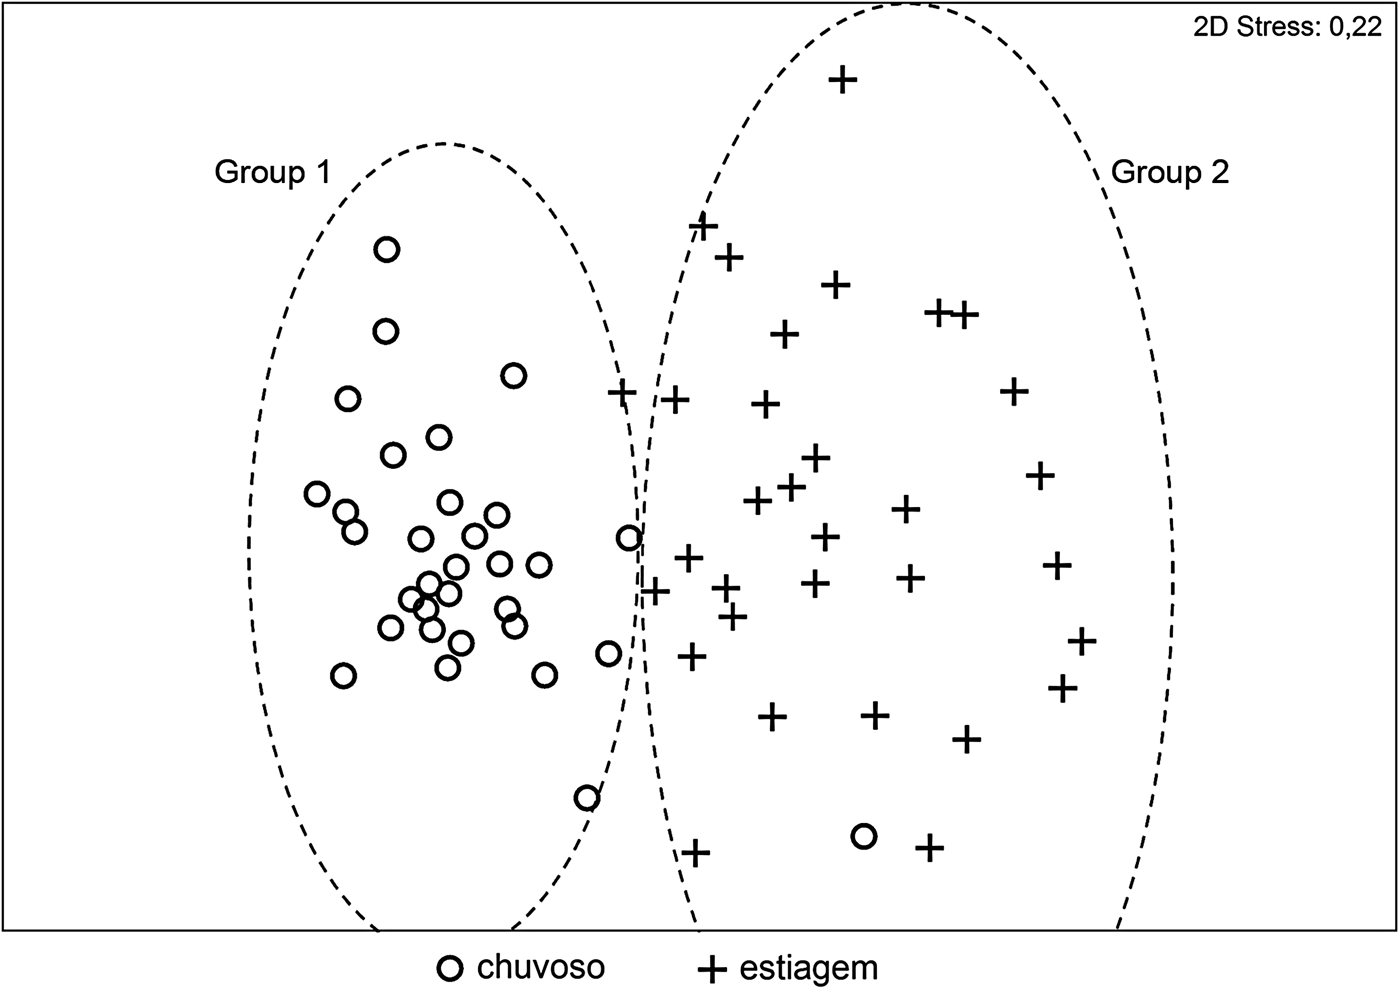
The MDS based on the trawl samples of phytoplankton resulted in two groups, with a stress value of 0.22 (Figure 5), revealing seasonal differences in the phytoplankton community structure. Group 1 included samples of the rainy season and the sample of point 4 at low tide in October. Group 2 included the samples of the dry season and the sample of collection point 1 at low tide in May (ANOSIM – R Global: 0.624; P = 0.01). The formation of groups related to the tidal stages (ANOSIM – R Global: 0.012; P = 0.27) and to the sampling stations (ANOSIM – R Global: −0.017; P = 0.77) was not observed.
Multidimensional scaling (MDS) plot based on Bray–Curtis similarities of phytoplankton density data surrounding the reef ecosystem of Porto de Galinhas, PE, Brazil, that considered group 1 (rainy season and the sample of point 4 at low tide in October) and group 2 (dry season and the sample of collection point 1 at low tide in May).

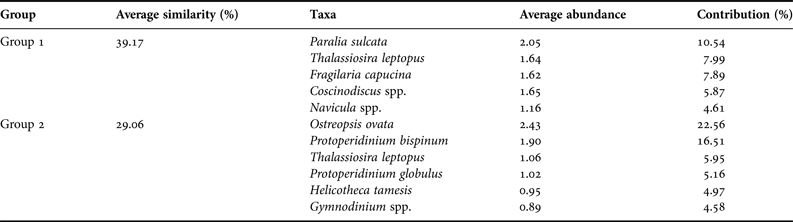
The analysis of the contributions to similarity using the SIMPER routine showed an average similarity of 39.17% for group 1 and 29.06% for group 2 (Tables 2 & 3). Paralia sulcata was the species that contributed most to the formation of group 1, while O. ovata contributed the most to the formation of group 2.
Summary of the results obtained using the percentage of greater contribution of phytoplankton species to similarities (SIMPER) of each group formed by the multidimensional scaling (MDS).

Summary of the results obtained using the percentage of greater contribution of phytoplankton species to dissimilarities (SIMPER) of each group formed by the multidimensional scaling (MDS).

The Bio-Env analysis revealed that the group of variables that best explained the change in phytoplankton composition (r = 0.432, P = 0.01) included rain, transparency, chlorophyll a and silicate.
DISCUSSION
The community structure and productivity of phytoplankton are governed mainly by the availability of nutrients, discharge of rivers, seasonal conditions of winds, tides, precipitation cycles, chains of resurgence, or by the joint action of these factors (Paranaguá, Reference Paranaguá1985/86; Neumann-Leitão et al., Reference Neumann-Leitão, Gusmão, Nogueira-Paranhos, Nascimento-Vieira and Paranaguá1991/1993; Eskinazi-Leça et al., Reference Eskinazi-Leça, Silva-Cunha, Koening, Macedo and Costa1997, Reference Costa, Neumann-Leitão, Souza-Santos, Eskinazi-Leça, Neumann-Leitão and Costa2004).
In Porto de Galinhas, the variation of hydrological parameters occurred mainly due to the seasonality, which conditions, among other factors, variations in the river discharge and the turbulence generated by the different wind conditions. In north-eastern Brazil, this seasonal pattern was also previously observed by Moura & Passavante (Reference Moura and Passavante1994/1995) in Tamandaré Bay (PE); Campelo et al. (Reference Campelo, Passavante and Koening1999) on the Carne de Vaca beach (PE), Bastos et al. (Reference Bastos, Feitosa, Koening, Machado and Muniz2011), in Maracaípe, Jales et al. (Reference Jales, Feitosa, Koening, Bastos and Machado2012) in Serrambi; and in Porto de Galinhas (PE) by Fonseca et al. (Reference Fonseca, Passavante, Maranhão and Muniz2002) and Machado et al. (Reference Machado, Feitosa, Koening, Flores-Montes, Bastos and Jales2014). Variations of environmental parameters, based on the tides, have mainly been reported in estuarine environments.
June had the highest rainfall, leading to lower salinities, due to the EWD in June 2010 that caused flooding in several cities (Alves et al., Reference Alves, Cavalcanti and Nóbrega2012).
Chlorophyll a and phytoplankton density also followed a seasonal pattern, with higher values recorded in the rainy season. Ferreira et al. (Reference Ferreira, Silva-Cunha, Koening, Feitosa, Santiago and Muniz2010) relate the higher densities found in three beaches of the southern coast of Pernambuco during the rainy season with the resuspension of sediment, which increases concentrations of SPM and nutrients. In Porto de Galinhas this seasonal pattern is also associated with the resuspension of sediment due to increased turbulence in the water column and the greater discharge of rivers during the rainy season.
The action of these factors is based on the seasonal variation observed in the SPM, transparency, DIN, silicate and salinity. Furthermore, the presence of 17.8% of freshwater and estuarine species and 42.1% of tycoplankton respectively indicate the influence of the river load and sediment resuspension in the phytoplankton community structure. The seasonal influence on the phytoplankton community structure resulted in the formation of two separate groups in the MDS of the samples that were almost exclusive to the dry and rainy season.
The EWD that occurred in June contributed to a greater occurrence of freshwater species in the environment, since Trachelomonas hispida (Perty) F. Stein, 1878, Aphanocapsa rivularis (Carmichael) Rabenhorst, 1865, Spirulina major Kützing ex Gomont, 1892, Synechococcus aeruginosus Nägeli, 1849 and Closteriopsis longissima (Lemmermann) Lemmermann, 1899 were found only in the samples collected during that month.
According to the observed phytoplankton density, the environment can be considered oligotrophic tending toward mesotrophic in the rainy season, according to the classification of Kitsiou & Karydis (Reference Kitsiou and Karydis1998).
Most of the samples collected in the reef environment of Porto de Galinhas presented average phytoplankton diversity. Moreover, the recorded diversity values were a little lower than the values recorded in the adjacent reef environment of Maracaípe (Bastos et al., Reference Bastos, Feitosa, Koening, Machado and Muniz2011) and Serrambi (Jales et al., Reference Jales, Feitosa, Koening, Bastos and Longo2013). This difference is probably because these environments are closer to the mouth of the Maracaipe River, meaning that they receive a greater contribution and consequently present greater diversity.
The evenness was high in most samples, which shows the balance in community structure with few dominant species, and the environmental balance in the area. The lower values of diversity were associated with samples where the species Ostreopsis ovata and Trichodesmium erythraeum were dominant.
Among the species present in the reef environment of Porto de Galinhas, O. ovata was the most widespread and abundant species. In addition, it was the species that most contributed to the formation of group 2, which represents the samples related to the dry season. It was also the species that contributed the most to the dissimilarity between the groups formed in the MDS.
Ostreopsis ovata is a neritic tycoplanktonic dinoflagellate that is associated with a variety of substrates, such as seaweed, rocks and unconsolidated sediment (Totti et al., Reference Totti, Accoroni, Cerino, Cucchiari and Romagnoli2010), and has a global distribution pattern in both tropical and temperate latitudes (Rhodes, Reference Rhodes2011). It produces a powerful toxin called palytoxin, which is associated to ovatoxins. The occurrence of blooms of this species can cause respiratory and dermatological diseases in humans (Tichadou et al., Reference Tichadou, Glaizal, Armengaud, Grossel, Lemée, Kantin, Lasalle, Drouet, Rambaud, Malfait and De Haro2010), and it has a high mortality rate among benthic organisms (Nascimento et al., Reference Nascimento, Corrêa, Menezes, Varela, Paredes and Morris2012a, Reference Nascimento, França, Gonçalves and Ferreirab).
According to Tichadou et al. (Reference Tichadou, Glaizal, Armengaud, Grossel, Lemée, Kantin, Lasalle, Drouet, Rambaud, Malfait and De Haro2010), in favourable conditions during the summer O. ovata can proliferate and create floating clusters that release toxins on the surface of the water. These toxins can subsequently be released into the atmosphere in the form of aerosols. In spite of the low cell density observed in Porto de Galinhas, it is important to monitor this dinoflagellate because it occurs throughout the year at this location and can become dominant in the environment, especially in the dry season when tourist activity on the beach is intense.
The occurrence of O. ovata has been documented in southern Brazil on the island of Arvoredo and on the beaches of Penha and Bombinhas, Santa Catarina (Silva et al., Reference Silva, Ávila, Odebrecht and Matthiensen2006; Tibiriçá et al., Reference Tibiriçá, Proença and Schramm2010); in the south-east on the beaches of Arraial do Cabo and Armação dos Búzios, Rio de Janeiro (Nascimento et al., Reference Nascimento, Monteiro, Ferreira and Rodriguez2008, Reference Nascimento, Monteiro, Alencar and Meneguelli2010); in the Canal de São Sebastião, São Paulo (Naves & Freitas, Reference Naves and Freitas2001); in the north-east, associated with macroalgae on the beaches of Muro Alto and Maracaípe and in the São Pedro and São Paulo Archipelago, Pernambuco (Nascimento, Reference Nascimento2006; Nascimento et al., Reference Nascimento, França, Gonçalves and Ferreira2012b); and in the plankton of Atol das Rocas (MC Jales, unpublished results). Ostreopsis sp. was also documented in Tamandaré beach, Pernambuco (LM Silva, unpublished results).
Protoperidinium bispinum (Schiller) Balech, 1974, a planktonic dinoflagellate of neritic occurrence, was the second largest contributor to group 2 (dry season). In this study, it was considered frequent and abundant in 26 samples. In Maracaípe, South of Porto de Galinhas, this species was dominant and highly frequent. It was also considered the key species of the environment and was directly associated with the marine flow (Bastos, Reference Bastos2011). Although more than 200 species of Protoperidinium have already been identified, little is known about the ecology of this genus (Gribble et al., Reference Gribble, Nolan and Anderson2007).
Trichodesmium erythraeum, as in the case of O. ovata, was dominant, although only in a single sample. It is a colonial marine cyanobacteria that occurs in tropical subtropical oceans (Carvalho et al., Reference Carvalho, Gianesella and Saldanha-Corrêa2008).
In Pernambuco, T. erythraeum was considered as being responsible for episodes of human health problems in Tamandaré beach. The disease that resulted from the blooms of this species was named ‘Tamandaré Fever’ or ‘Tingui’ due to the respiratory symptoms (Satô et al., Reference Satô, Paranaguá and Eskinazi1963/1964). Although this species has been documented along the entire Brazilian coast, to date this was the only public health issue related to the red tide associated to this species (Proença et al., Reference Proença, Tamanaha and Fonseca2009). The disease related to the blooms of T. erythraeum in Tamandaré was probably caused by the additional blooms of other organisms, since no toxins that can cause human diseases via direct contact were found in extracts of T. erythraeum. Furthermore, no studies were conducted to detect the source of the toxins during the episode in Tamandaré (Proença et al., Reference Proença, Tamanaha and Fonseca2009). However, Kerbrat et al. (Reference Kerbrat, Zouher, Pawlowiez, Golubic, Sibat, Darius, Chinain and Laurent2011) showed the presence of palytoxin and 42-hydroxy palytoxin in T. erythraeum for the first time, and consider that other studies are needed to elucidate the toxicity of this species.
Blooms of T. erythraeum have mainly been observed in reef areas. Damming and water evaporation in these areas causes temperature and salinity to rise, which favours the multiplication of the species (Satô et al., Reference Satô, Paranaguá and Eskinazi1963/1964). As in the case of O. ovata, the blooms of this Cyanobacteria mainly occur in the dry season due to the greater transparency, temperature and salinity that promote their development. Therefore, this species should be monitored during this period when the likelihood of booms is greater and tourist activity is intense.
Paralia sulcata was also highly frequent in the environment, and contributed the most to the formation of group 1 (rainy season) in the MDS. This diatom is considered neritic tycoplanktonic and can be associated with a broad spectrum of environmental conditions (McQuoida & Nordberg, Reference McQuoida and Nordberg2003). It is reported as having widespread occurrence and may be considered generalist (Avancini et al., Reference Avancini, Cicero, Di Girolamo, Innamorati, Magaletti and Zunini2006), although there are no records of resistant stages (Jales et al., Reference Jales, Feitosa, Koening, Bastos and Longo2013).
Paralia sulcata has been documented in various studies conducted on the Brazilian coastline, such as the coast of Paraná (Procopiak et al., Reference Procopiak, Fernandes and Moreira-Filho2006) and in the estuaries of the rivers Formoso and Ipojuca (Koening et al., Reference Koening, Eskinazi-Leça, Neumann-Leitão and Macêdo2002; Honorato da Silva et al., Reference Honorato da Silva, Cunha, Passavante, Grego and Muniz2009). It has also been reported as highly frequent in beaches along the southern coast of Pernambuco (Ferreira et al., Reference Ferreira, Silva-Cunha, Koening, Feitosa, Santiago and Muniz2010; Bastos, Reference Bastos2011; Jales et al., Reference Jales, Feitosa, Koening, Bastos and Longo2013).
Thalassiosira leptopus was also very frequent, and it was the second largest contributor of group 1 (rainy season) and the third largest contributor of group 2 (dry season) in the MDS. It is an oceanic planktonic diatom that influenced the environment in the dry season and the rainy season, which shows the oceanic influence in both periods. It was also considered very frequent in the reef ecosystem of Serrambi (Jales et al., Reference Jales, Feitosa, Koening, Bastos and Longo2013).
Fragilaria capucina Desmazières, 1830 was one of the species that most contributed to the dissimilarity of the groups formed in the MDS, and it was exclusive of the rainy season. The presence of this freshwater diatom only in the rainy period indicates that the effect of the plume of the Maracaípe River is capable of influencing the phytoplankton community structure in this period.
The predominance of diatoms has been previously documented in other coastal reef environments in Brazil (Sassi et al., Reference Sassi, Veloso, Melo and Moura1990; Moura, Reference Moura1991; Neumann-Leitão et al., Reference Neumann-Leitão, Feitosa, Mayal, Schwamborn, Silva-Cunha, Silva and Porto Neto2009; Ferreira et al., Reference Ferreira, Silva-Cunha, Koening, Feitosa, Santiago and Muniz2010; Bastos et al., Reference Bastos, Feitosa, Koening, Machado and Muniz2011; Jales et al., Reference Jales, Feitosa, Koening, Bastos and Longo2013). The occurrence of diatoms in these locations is based on their euryhaline nature and their affinity for environments with a greater availability of nutrients (Eskinazi-Leça et al., Reference Costa, Neumann-Leitão, Souza-Santos, Eskinazi-Leça, Neumann-Leitão and Costa2004). The presence of oceanic, neritic, estuarine and freshwater marine species indicates the influence of the ocean environment and of the continental environment in the area, which makes euryhaline species predominant.
Although some potentially toxic species are representative in the area, the recorded density is not characteristic of a large-scale bloom. Moreover, the observed evenness and diversity values were indicative of environmental balance. The results of this study reveal that the reef environment of Porto de Galinhas is characterized as being oligotrophic with a tendency toward mesotrophic in the rainy season. Eutrophication was not found in this environment. Coastline interference was observed in the reef environment, mainly consisting of the transport of suspended particulate matter and nutrients, which leads to seasonal changes in the phytoplankton community structure.
SUPPLEMENTARY MATERIAL
The supplementary material for this article can be found at https://doi.org/10.1017/S0025315416001600.
FINANCIAL SUPPORT
This work was supported by Coordenação de Aperfeiçoamento de Pessoal de Nível Superior (CAPES) who provided Doctoral scholarships granted to Raquel Correia de Assis Machado.