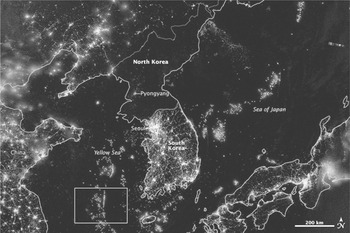
Politics, it is clear, has a massive impact on economic outcomes. States redistribute wealth, make up for market failures, and enact policies that can devastate an economy or promote long-run growth. Think, for instance, of the striking contrast between North and South Korea today (Figure 1). Its ultimate cause is not culture or endowments, but starkly different politics, which makes the difference between starvation in the North and prosperity in the South.
Nor is that all states do. They also provide the essential public goods of security, the rule of law, and a means of exchange. Without these, life is brutal and trade little more than barter. Life without a state, both in the past and today, has usually been vicious anarchy. Not even a fervent libertarian, after all, would have chosen to live in Somalia in the 1990s. One might of course object that peaceful cooperation could emerge among people who interacted repeatedly with one another in the absence of anything like a state. After all, the folk theorem for repeated games suggests that is a possible equilibrium. But in reality societies that have no state are violent, with death rates from warfare that dwarf casualty rates when states do exist. In 27 nonstate societies summarized by Steven Pinker, war slaughtered an average of 524 people each year, for every 100,000 members of the society. That is far more than in twentieth-century Germany and Russia, where the corresponding figures are 144 and 135 deaths annually per 100,000 people, despite the Holocaust, a civil war in Russia, and the devastation of two violent World Wars (Pinker Reference Pinker2011, pp. 52–53).
NIGHTTIME LUMINOSITY IN NORTH AND SOUTH KOREA (2012).

Beyond security, money, and the rule of law, states (or local governments operating under state authority) have long taken care of flood control—they have been doing that for centuries in China and Egypt—and since the nineteenth century they have provided water purification, sewage treatment, and other goods and services that are either public or involve externalities or natural monopolies. In the United States, clean water and sewer systems furnished by municipalities explain (so Werner Troesken has argued) some 60 percent of the increase in life expectancy between 1850 and 1950. The municipal water purification and sanitary sewers not only wiped out typhoid, but it also greatly reduced deaths caused by other ailments (such as heart disease, kidney failure, and respiratory disease) that a case of typhoid could bring on or aggravate (Cutler and Miller Reference Cutler and Miller2005; Ferrie and Troesken Reference Ferrie and Troesken2008; Troesken Reference Troesken2014). They had a large impact in Britain and France as well (Kesztenbaum and Rosenthal Reference Kesztenbaum and Rosenthal2012; Chapman Reference Chapman2014b). States (with the aid, once again, of local governments) have also built roads, canals and ports, and operated rail lines and airports. They are major suppliers of education, pensions, medical care, subsidized housing, and insurance against disability or unemployment, and in addition to all this social spending, they pay for most fundamental scientific research today and are the only weapon available to those who would seek to redistribute wealth in order to fight inequality.Footnote 1
Yet although politics therefore has long had a huge effect on economic outcomes, we still know too little about what determines the laws, regulation, and policies that states adopt or what goods and services they furnish. The link between the state's actions and the politics is often unexplored, and the politics itself is rarely laid bare, particularly if we leave the United States and consider the history of other parts of the world. Nor do we know what shapes the changes in state policies and expenditures over time.
Worse yet, we do not even understand how states arise in the first place or how they gain the ability to tax, without which any other state action is nearly impossible. And fundamental data on tax revenues and what states and local governments spent money on are frequently unavailable (again, this is particularly true outside the United States), even though a bit of historical research could gather the necessary numbers.
There are enough tasks and unanswered questions here to keep an army of economic historians busy for years. Let me sketch what I believe the key tasks and questions are and what the payoffs will be. The result will be more of an exhortation than a article, because the tasks are as yet undone and the questions still unanswered. But one theme will emerge from the call to action: We have spent too much energy worrying about how to restrain an overly powerful state. Yes, states can do immense damage, as Douglass C. North and Barry R. Weingast; Daron Acemoglu, Simon Johnson, and James A. Robinson; and others have long argued, and as North Korea and other striking examples make clear.Footnote 2 But the problem, as Stephan R. Epstein argued, was that states were often too weak (Epstein Reference Epstein2000). That was certainly true in continental Europe before the nineteenth century; Britain alone had a powerful state thanks to political innovations during and after the Glorious Revolution. It was true in nineteenth-century China, and it is true in developing countries today, or so ongoing work in political economy maintains (Besley and Persson Reference Besley and Persson2010). We should analyze how states gain the capacity to act effectively and what goods and service they should provide and what they should leave to private markets.
The place to start is by specifying what we mean by state, because Max Weber's oft repeated definition (a state monopolizes the legitimate use of violence) is virtually useless for historical research. We can then ask what economic theory, historical examples, and the other social sciences say about how states emerge, about the alternatives that can delay their development, and what about what shapes their taxation and spending, both at the level of the central government and by local authorities. Much more needs to be done, including collecting more data and undertaking careful historical research that takes politics seriously.
A BETTER DEFINITION OF A STATE
To define a state, most social scientists, almost without thinking, simply adopt the definition Max Weber formulated: A state is a community that successfully claims a monopoly over the legitimate use of violence within a given territory.Footnote 3 But it is of little use for historical research, because until recently entities that we would certainly consider states could not come close to making such a claim. Private violence against African Americans (or the threat of such violence) was considered legitimate among many whites in the U.S. South from Reconstruction to the Civil Rights Era. Does that mean that there was no state in the old Confederacy? Similarly, western Europe witnessed numerous violent rebellions over issues ranging from working conditions and the price of food to political rights, right up into the twentieth century, and the rebels could make claims to legitimacy (Tilly et al. Reference Tilly, Tilly and Tilly1975). The same was true in nineteenth-century China.Footnote 4 Did western European states therefore not spring into existence until the 1930s? Was there no state in late Qing-Dynasty China? And do states still not exist in neighborhoods on the South Side of Chicago or in poor suburbs of French cities, where at least some young men seem to feel that resorting to violence is justifiable?Footnote 5
Successfully establishing a monopoly of violence is difficult. It requires resources and (at the very least) popular acquiescence, both of which took time for states to get. So by sticking to Weber's definition, we overlook the centuries of work that states did both to acquire resources and to win people over so that the cost of ruling (including the political risks and the expenses involved in collecting tax revenue from a recalcitrant population) would not be prohibitive. Those tasks are among the things economic historians should be studying, but Weber's definition rules them out, for they all precede the very existence of a state as he defined it.
A better definition would characterize a state as a community with two defining characteristics. First, it can employ violence, although it may not have an effective monopoly over its use. Second, it can levy substantial permanent taxation. States therefore come into existence when in addition to being able to use force they also gain the capacity to impose and collect significant amounts of tax revenue, not just temporarily during emergencies but for the foreseeable future.
With this definition as a point of departure, economic historians could focus on taxing and spending and study how states achieved the ability to tax in the first place, which would include gaining at least the grudging assent of the population. Once the state is established, they could gather data on what the tax revenues and expenditures were, including what assets and incomes were subject to taxation, what sort of spending was favored, and how the responsibilities were divided up between the central and local government. Surprisingly, data of that sort is still not readily available, particularly outside the United States. For much of nineteenth-century Europe, for instance, data on categories of spending exists in archives or obscure government publications, but it is not yet easily accessed. It is being gathered, but much more remains to be done, especially for Asia and Latin America and for local spending everywhere.Footnote 6 And the situation is even worse—though not hopeless—before the nineteenth century.
The data itself may seem mundane, but it will not only allow us to analyze the effect of taxes and government expenditures—something economic historians have long done—but even more important, it will make it possible for us to explore the politics behind the tax and spending decisions. Here too some of the initial spadework has already been done, particularly for the United States, and, for other economies, for social spending.Footnote 7 But much remains unknown. Who favors particular taxes or expenditures? Which pivotal leaders or members of the elite in autocracies? Which legislators and constituents, if there are representative institutions? Who is lobbying for the fiscal policy and who benefits or suffers from it? Are supporters organized and therefore able to overcome free rider problems? Do political actors use decisions about taxation and spending to rally adherents to their side or to benefit their followers? Those are questions that one can ask even for an autocratic government, because kings and dictators had to have some support among elites or influential officials. After all, the absolutist monarch Louis XIV negotiated tax increases with local elites in the seventeenth century, by giving them a variety of favors (including a share of local levies or a voice in how the revenue was spent) in return for their assent (Beik Reference Beik1985).
WHEN DO STATES ARISE?
So when and how do states that meet this definition arise? What are the circumstances that give authorities the ability not just to use force but impose substantial permanent taxation? Historians often trace the origins of heavy taxation back to war. So do political scientists and historical sociologists, and there is at least some quantitative evidence to back up their claim.Footnote 8 For France, that sort of taxation was ushered in during the Hundred Years War (1337–1453) with England; for Prussia, it came in the wake of the Thirty Years War (1618–1648) and the First Northern War (1655–1660). The story is similar in East Asia. China, for instance, was first unified (in 221 bc) by the rulers of Qin, who defeated their rivals in two centuries of warfare because they could tax (and conscript troops—another form of taxation) on a scale that their opponents could not match (Hui Reference Hui2005, pp. 85–87, 96–98, 141–42).
There are formal economic models that support the relationship between war and the ability to tax heavily. In the models, which were inspired by historical examples and by the inability of many developing countries to collect much tax revenue, war promotes investment in fiscal infrastructure, and the infrastructure in turn limits individuals’ ability to shield income from taxation (Besley and Persson Reference Besley and Persson2009, Reference Besley and Persson2010). Or war can teach political leaders (via learning by doing) how to cut the political costs of levying taxes and hence help them increase their tax revenue (Hoffman Reference Hoffman2015).
Reality, however, is more complicated. The connection between warfare and taxation, as Charles Tilly stressed, is shaped by domestic politics, resource endowments, and international relations (Tilly Reference Tilly1990, pp. 1–28). War does not always give rise to states in our sense of the word—in other words, polities that can impose heavy permanent taxation. Although in the simplest economic models, war always generates more tax infrastructure, in more complicated models it need not do so. That can happen, for instance, if there are valuable natural resources that domestic political groups can fight over, and the civil war that results can actually weaken the tax infrastructure (Besley and Persson Reference Besley and Persson2010). And if initial costs of setting up a fiscal system are high enough, then war may no longer bring any investment in fiscal infrastructure at all.Footnote 9
History tells us the same thing, for warlords and political leaders have been able to fight for decades without substantial permanent taxation. That is in fact what happened in western Europe during the Middle Ages, when warriors and military lords battled one another incessantly without ever establishing fiscal systems that could raise appreciable amounts of permanent tax revenue.Footnote 10 To judge from the kings and princes who led these armies, the risk of dying on the battlefield was enormous: in the eleventh century, for instance, their death rate was double that of soldiers in violent combat today, and far higher than the murder rate in the world's most dangerous cities.Footnote 11 Or to take a more recent example, consider the Turkana, a group of some one-half of a million nomadic pastoralists in East Africa. They fight defensive wars and raid other ethnic groups even though they have no centralized political or military authority and nothing like a fiscal system. The warfare is dangerous—23 percent of Turkana men die in warfare between puberty and the end of fatherhood—but no state compels them to fight and they do not seem to be motivated by ties of kinship or repeated dealings among warriors (Mathew and Boyd Reference Mathew and Boyd2011; Gray et al. Reference Gray, Beth Sundal and Wiebusch2003). And there are other contemporary groups in the Amazon, other parts of Africa, or ungoverned corners of Pakistan that also manage to wage war without permanent taxation or what we would consider a state (Barth Reference Barth1956; Lindholm Reference Lindholm1981; Beckerman et al. Reference Beckerman, Erickson and Yost2009).
By itself, therefore, warfare is not enough to create a state. It may help spur some warring groups to set up a fiscal system, and that in turn will lead to a correlation between warfare and state formation. But the warfare alone is not sufficient for state formation, or otherwise warfare would always give birth to states. Something else in addition to warfare must therefore be involved. If we look at particular examples of how significant permanent taxation was established, they do usually involve warfare and the public good of security, although other public goods (such as providing money with a stable value that would obviate the need for barter and facilitate transactions over time) may play a role too. The correlation between warfare and state formation would lead us to expect as much. But the whole process was also inseparable from politics, and the politics (so we shall see) was essential to making the leap from warfare to state formation.
French kings, for instance, gained the right to impose sizeable permanent taxes during the Hundred Years War (1337–1453), when they battled the kings of England to see who would rule France.Footnote 12 But the French monarchs did not obtain that right immediately. Initially, they could levy taxes only when war was actually being waged, as had been the case before the Hundred Years War. The fighting during the war, though, was interrupted by truces or temporary halts to the hostilities. During those lulls in the fighting, tax collection stopped, and with no money for pay, soldiers had to be furloughed. To support themselves, the troops who had been released would then plunder the countryside, leaving a trail of death, refugees, and smoking ruins.
Stopping these brigands had wide support, but when it came to pay for the effort, people dug in their heels. Suppressing the brigandage required peacetime taxation, and many feared that the royal government would pocket the tax revenue collected during a truce or divert the money toward some other goal such as paying for the expenses of the royal household. Halting the pillaging would also require shifting tax revenue from a corner of the kingdom where furloughed soldiers posed no problem to a province where they raged out of control. That too generated opposition, as did shifting taxes from regions that faced no threat in war time to regions that were in danger.
This political stalemate was not broken until a disastrous French defeat in 1356, when their King, John II, was taken prisoner by the English. In this dire and exceptional situation, the French king's subjects were willing to grant a peacetime levy to pay his ransom, and his son, who became King Charles V in 1364, managed to get these taxes increased and made permanent in the 1360s. He did so by simultaneously undertaking two critical actions. First, he fashioned a political coalition in favor of permanent taxation by tailoring taxes to suit the powerful nobility; second, he showed that he would use the money to wipe out the brigands. Those actions won him the taxation, and local evidence indicates that per capita taxes rose more than 20-fold.
The king's son, in short, had solved the free rider problem by working out the politics and demonstrating that he would indeed use the tax revenue to provide the precious public good of security. But his success was not immediate. Initially, he failed to get peacetime taxation out of regional assemblies, and a kingdom wide representative assembly in 1356 did not grant permanent taxation either (Henneman 1976, pp. 24–25, 39–50, 283, 288). The whole political process involved learning how others involved would behave—whether they too would contribute and whether the king's son would use the money collected to wipe out the brigands.
That sort of process is likely to be path dependent, or so experimental evidence suggests. The relevant experiments involve paying for a public good, and while one might have doubts that results obtained with student subjects playing for small sums of money would carry over to decisions where life and property are at stake, the experimental research does make it clear that the outcomes are path dependent and shaped by past behavior. In the experiments, the subjects do not play what would be their dominant strategy if they were concerned only about their own monetary pay off—namely, contribute nothing and free ride. The experimental evidence in fact suggests that they are also concerned about the whole group's payoff, that they dislike it when others free ride, and—most important of all—that they try out and evaluate strategies based on the recent history of play. If past play convinces them that others will contribute and that all will benefit, then they too will chip in.Footnote 13
If the same rules governed behavior by those with a political voice in the fourteenth century, then actions by a leader such as the king's son were the key to establishing permanent taxation in France. By stamping out the brigandage and reaching agreements with local elites, the future Charles V convinced each of the elites with a political voice that others would in fact contribute, that the public good of security would in fact be delivered, and that all would therefore benefit. They would in effect learn that paying the taxes was a winning strategy. Without this initial learning, the French kings might have had to wait much longer to get permanent tax revenue.
France's path to substantial permanent taxation was not the only one, for other polities took a very different route. In Brandenburg Prussia, force played a role, but a political bargain with elites was still essential. Because Brandenburg Prussia had been ravaged during the Thirty Years War (1618–1648), its ruler, the Elector Frederick William, sought enough tax revenue to establish a standing army. He began by offering concessions to the nobility—in particular, greater power over their serfs—and in return a representative assembly of nobles and towns in Brandenburg agreed to temporarily increase taxes. That funded his army and allowed him to enter a war between Sweden and Poland. He then invoked the fighting to unilaterally impose even higher taxes, and when the war was ended, his army then suppressed resistance to making the tax increases permanent. At the same time, he kept the nobles on his side by offering them employment as army officers and government officials (Carsten Reference Carsten1954; Vierhaus Reference Vierhaus1984; Volckart Reference Volckart2000).
The road to a state that could mobilize resources on a large scale was different still in China. There, two centuries of warfare led to the triumph of the first dynasty to unify China, the Qin (221–206 bc), whose leaders swallowed up rival states because they could raise more tax revenue and conscript more soldiers than their opponents. The Qin and the next dynasty, the Han (206 bc–ad 220), also took the first steps toward creating a bureaucracy that increased the resources the state could muster and at the same time had the important long run political effect of keeping elites loyal by drawing them into state service.Footnote 14
In all of these examples, the process of establishing substantial permanent taxation was path dependent; it depended on history—on the initial steps taken by rulers and elites. To analyze what happened, we therefore have to pay close attention to the history—to what was done by Charles V, Frederick William, the Qin and Han Emperors, and by the other actors with a political voice. These rulers could have easily failed to establish states, for as we know, warlords and other political leaders can fight for decades or more without ever being able to levy substantial permanent taxation. Getting the history right also demands that we seriously weigh the obstacles to establishing states: among them organizations that can provide substitutes for the public goods or services a state furnishes and so reduce that appeal of creating a state to provide them. At the end of the Roman Empire, for example, bishops in western Europe provided famine and disaster relief that today would be the task of states (Brown Reference Brown1996, p. 62). The Church—an all-encompassing religious institution—had become a substitute for a state in a world without one.Footnote 15 Similarly, local authorities (a lord in medieval Europe, for instance) could muster armed followers and provide defense in place of a state.
Understanding what happens will require scrutinizing the politics, and it may also mean that we have to look beyond economics and draw upon work by behavioral economists, political scientists, and evolutionary anthropologists.Footnote 16 Some of the behavior may simply involve imitation (such as coordinating on a particular equilibrium or copying what is widespread) and it may not be the result of optimization. But that is true of much political behavior—even voter turn out in modern democracies (Palfrey and Pogorelskiy Reference Palfrey and Pogorelskiy2014). When analyzing the politics we will have to consider how to model what happens as political leaders first create a fiscal system and then learn how to squeeze more revenue out of it, whether it is in ancient China during the rise of the Qin, Brandenburg Prussia during the reign of Frederick William, or modern democracies.Footnote 17 Their learning may require that they abandon tax farmers and set up instead a large fiscal administration staffed with bureaucratic officials. Or the learning may depend on the incentives that leaders and officials create for tax compliance.Footnote 18 All those policy choices are at least in part political and they too all merit future research.
WHAT DO STATES SPEND THEIR TAX REVENUE ON?
Suppose that a warlord, chief, or king finally has gotten his hands on substantial permanent tax revenue. What then does he use it for? In other words, when a state finally comes into existence, what do its leaders spend their tax revenue on? And when do they use their tax revenue to provide public goods and services that enhance economic growth?
Answering the first question turns out to be difficult for many parts of the world, because the origins of states lie so far back in the past that the requisite data on government spending and taxation simply do not exist. But it can be answered for parts of Europe, where states arose relatively late, at the end of the Middle Ages or the sixteenth and seventeenth centuries. There we do have enough evidence for England, France, and Prussia, and for those three states the answer to the question is clear for the years 1600–1790, for they directed the bulk of their revenue to the military, either directly, or indirectly by subsidizing allies (Table 1). Their only other major expense was also related to war: servicing debt run up in past conflicts.Footnote 19 So war dominated their expenditures, and the same was likely true of the other states in early modern Europe. And that is hardly surprising. They had created states by working out the politics of funding warfare, and we would expect them to use their newly granted permanent tax revenue to pay for the ongoing fighting.
MILITARY EXPENSES AS A PERCENT OF ANNUAL GOVERNMENT SPENDING: ENGLAND, FRANCE, PRUSSIA (1688–1790)

Notes:
Military expenses include subsidies for allies, but not debt service, even though the sole purpose of borrowing was to pay for wars. Debt repayments are also excluded to avoid double counting. Figures for England concern net public expenditures.
Source:
Mitchell and Deane Reference Mitchell and Deane1962, pp. 389–391 (England); http://esfdb.websites.bta.com (data on seventeenth-century French expenditure supplied Richard Bonney); http://esfdb.websites.bta.com/table.aspx?resourceid=11768 (data for Prussia gathered by Martin Körner).
Early modern Europe, however, may well have been exceptional, for warfare there was not simply a matter of providing the public good of defense. Rather, it was at least in part a consumption good for the kings and princes who made political decisions about peace and fighting. Throughout their childhood, they had learned that warfare was the calling of kings, and once they were adults and in power their advisers would remind them, as Machiavelli did, that they should have “no object, thought, or profession but war.” They had been raised to prize glory in war, an intangible that could only be earned on the battlefield and was impossible to divide up via peaceful bargaining.Footnote 20 Elites with a political voice shared their taste and enthusiasm for war, and both they and the kings who waged war avoided most of the costs of fighting. Although nobles did certainly die in combat, their assets and the kings’ were usually not taxed to pay for wars, and if we leave aside civil wars, the rulers of the major powers ran no risk of being dethroned after a military loss, at least in the years 1498–1789 (Hoffman Reference Hoffman2015, Table 2.2).
Incentives of that sort are a recipe for overspending on war. Indeed, if a political decision maker (a king or his chief adviser in a monarchy; in a democracy, it would be a president, prime minister, or pivotal member of a representative assembly) avoids the costs of war and reaps a disproportionate share of the benefits war brings, then warfare will be likely, and it cannot be prevented by any peaceful transfer of resources (Jackson and Morelli Reference Jackson and Morelli2007). So we would expect European kings to fight frequently and spend heavily on war. And we would expect the fighting and military spending in Europe to subside in the nineteenth century, after the Napoleonic Wars had changed the underlying rules so that even monarchs could be deposed after a loss and after decision making had passed into the hands of leaders who had not been raised to pursue the glory of war. In this new equilibrium of domestic politics and international relations, leaders had much less reason to fight (Hoffman Reference Hoffman2015; Schroeder Reference Schroeder1994).
Warfare did in fact grow less common in nineteenth-century Europe, and so did casualties on the battlefield. Brutal wars were still fought, but if we look at western Europe and compare the years 1815–1914 (the period between the Napoleonic Wars and World War I) with the preceding period 1650–1815, then the fraction of time spent fighting fell 77 percent, and battlefield casualties 78 percent.Footnote 21
But did military spending also subside in nineteenth-century Europe? And was spending on the military before the nineteenth century exceptionally high in Europe? Those questions are important, because heavy military spending would make it harder for a state to furnish growth enhancing public goods, but they are surprisingly hard to answer, because we lack the necessary data—in particular, disaggregated government spending figures that would let us measure military spending or other categories of government expenditure across time and countries, both in Europe and in other parts of the world. Before the nineteenth century, governments generally did not publish regular accounts of their expenditures or tax revenues. The seventeenth and eighteenth-century numbers for England, Prussia, and France in Table 1 are therefore unusual. And when fiscal data finally does make it into print in the nineteenth century, it often appears in obscure periodicals, and categorizing the spending is not easy. Although numbers for military spending have been gathered by the Correlates of War Project from 1816 on, and Peter Lindert has done the necessary spade work for social spending after 1880, data for other categories of nineteenth-century spending still have to be collected.Footnote 22 The task is even more complicated because much government spending was done at the local level, by municipal or provincial authorities. That was particularly true of spending on education and on infrastructure such as roads, sewers, and water systems. Categorizing total public spending therefore requires aggregating data across different layers of government.Footnote 23
So it is difficult to answer our two simple empirical questions. Still, it does seem likely that military spending was elevated in western Europe before 1800. In the eighteenth century, per-capita tax revenues among the leading military powers in western Europe dwarfed those in China and the Ottoman Empire (Karaman and Pamuk Reference Karaman and Pamuk2010; Brandt, Ma, and Rawski Reference Brandt, Ma and Rawski2014), and since it is unlikely that the military absorbed a smaller fraction of the government budget in western Europe than in China or the Ottoman Empire, per-capita military spending must have been higher in western Europe too.
As for whether military spending subsided in nineteenth-century Europe, it is clear that it did not. Despite the precipitous drop in battlefield deaths and the frequency of war, real military spending actually rose substantially, at least in Britain and France, where we can compare the late eighteenth and nineteenth centuries: It increased more than two-fold in Britain between 1780 and 1864, and more than four-fold in France during the same period. And it climbed even higher at the end of the century in Britain and France and the rest of western Europe too as an arms took hold in the build up to World War I (Hoffman Reference Hoffman2015, Table 6.4; Eloranta Reference Eloranta2007).
A simple model of the politics involved (one different from the model in Jackson and Morelli Reference Jackson and Morelli2007) can explain why military spending rose in nineteenth-century Europe despite there being far less war. With political leaders no longer pursuing glory in war, it was easier to bargain and find peaceful solution to conflicts, and the leaders had a greater incentive to find such solutions because they now faced the risk of being deposed if they actually fought and lost. But they would still need armies and navies to enforce their bargains. The result would be a cold war, with continued spending on the military but much less actual fighting (Hoffman Reference Hoffman2015).
Military spending in nineteenth-century Europe was also lifted by rising incomes as western Europe industrialized and by constitutional changes that boosted tax revenues relative to national income. Before the French Revolution, tax rates in any given country in continental Europe had varied widely across regions and social groups, with many groups (such as nobles or residents of particular regions) enjoying tax exemptions. In France, the Revolution erased these differences, creating a uniform fiscal system that the armies of the Revolution and Napoleon then imposed on territory they conquered. Countries that resisted a French invasion undertook similar reforms, either to bolster their own revenues for fighting Napoleon or as part of nineteenth-century constitutional change. The growing power of representative institutions then increased tax revenues even more (Dincecco Reference Dincecco2009, Reference Dincecco2011).
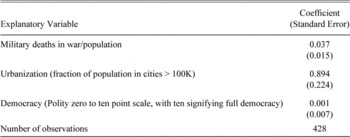
Although more powerful representative institutions could raise tax revenue and so increase military spending, one might expect that they would reduce the share of the budget that the military received, because the pivotal political decision makers in the nineteenth century (who might be a minister, a party leader, or a median member of Parliament) would prefer to shift spending away from the military and toward growth enhancing goods and services such as transportation infrastructure or clean water and sewers. But the move toward representative government and democracy did not seem to have that effect. Total government expenditure data for the nineteenth century is not yet readily available for many European countries, but we can at least analyze what happens to the ratio of military spending to tax revenue, which is a reasonable proxy for the military's budget share. And if we regress that ratio on a measure of growing democracy and add country fixed effects and controls for wars (military casualties as fraction of the population) and for growing incomes (urbanization rates as proxy for per gross domestic product (GDP)), then more democracy does not seem to be correlated with less military spending relative to taxation in Austria, Britain, France, Germany, and Italy (Table 2). One should of course not place too much weight upon such a panel regression, for too many explanatory variables are endogenous and measured with error. Still, it does seem puzzling that the military did not seem to be getting a smaller share of tax revenues as democracy advanced.
REGRESSION OF THE RATIO OF ANNUAL MILITARY SPENDING TO ANNUAL TAX REVENUE 1816–1913 (AUSTRIA-HUNGARY, BRITAIN, FRANCE, GERMANY, ITALY)

Notes:
The democracy measure combines indexes of civil liberties, constraints on the executive, and citizens’ ability to express preferences about policies and leaders. It ranges from zero (no democracy) to ten (full democracy). The panel regression also included fixed effects for the five countries involved.
Sources:
The Global Price and Income History web site (http://gpih.ucdavis.edu/Evidence.htm web site consulted 15 January 2013) for tax revenues collected by Dincecco Reference Dincecco2009; Polity IV database (http://www.systemicpeace.org/ consulted 18 January 2013) for the measure of democracy; and the Correlates of War database (http://www.correlatesofwar.org/ consulted 6 April 2012) for the other variables.
On the other hand, greater democracy does seem to have been correlated with more spending on public goods and services that contribute to economic growth—goods and services such as education, the enforcement of property rights, and public works such as transportation infrastructure, clean water, and sewers. During the years 1816–1913, spending on education and public works in France, Spain, and the Netherlands increased when representative assemblies got control of purse (Dincecco Reference Dincecco2011, pp. 110–113). And democracy did spur spending on education, not just in Europe but elsewhere in the world (Lindert Reference Lindert2004, vol. 1, pp. 24–25).
A simple model of a median voter or a pivotal decision maker would lead us to expect such a result, and so would more sophisticated models that would link steps toward democracy to both an increased ability to levy taxes and better protection of private property rights (Besley and Persson Reference Besley and Persson2009). The story is complicated, however, because much of the money for education and public works was allocated locally. Spending on schools was high in Germany, even though the national government was far from democratic, because local governments made the decisions about using taxes to pay for schooling, as in the United States (Lindert Reference Lindert2004, vol. 1, pp. 24–25). In Britain, the extension of the franchise yielded more local government spending on roads, sewers, and clean water, but the causality did not run in a simple monotonic way from more democracy to more local government expenditure on growth enhancing infrastructure. Rather, politicians used extension of the franchise as a means of getting valuable infrastructure by breaking free of a politics that had been limited to redistributing within the elite (Lizzeri and Persico Reference Lizzeri and Persico2004). The extension of the franchise was even more complicated than that because the poor actually opposed raising taxes to pay for the infrastructure (Chapman Reference Chapman2014a). Widening the franchise too far would work against getting sewers and clean water.
So if we want to understand what impels governments to spend on growth enhancing public goods and services, we have to pay close attention to the politics and to the history, as has been done for work on education (Goldin and Katz Reference Goldin and Katz2008; Lindert Reference Lindert2004). But much more remains to do. In many cases, we do not even know what total government spending was, in part because we have to measure not just national but local government expenditure. Education is again the major exception here, for educational funding has been studied, as has its economic impact. For infrastructure, work on its impact and on the politics behind it are underway (Troesken Reference Troesken2001; Ferrie and Troesken Reference Ferrie and Troesken2008; Kesztenbaum and Rosenthal Reference Kesztenbaum and Rosenthal2011; Troesken Reference Troesken2014), but that research could certainly be pushed further and extended to other countries and to time periods before the late nineteenth century. And there are other growth enhancing goods and services that cry out for study. The rule of law is one, particularly the provision of courts or other venues for settling private disputes. Historians have written a great deal about the rise of such courts, with late medieval and early modern Europe being a prime example. But an economic analysis of their impact is sorely lacking, particularly when it comes to the administrative and judicial reforms of nineteenth-century Europe, which imposed uniform rules on the fragmented legal systems of continental Europe.
We also need more work on scientific research, on its economic consequences, and on the politics behind it. The same goes for the training of scientists, engineers, and other technically skilled labor. The scientific research usually combined government and private efforts, but we know too little about the economic consequences and the politics behind what the government did. Government action here reached back much further into the past than one might expect, and it too involved local authorities. In the United States (so the late Ross Thomson has estimated), some 56 percent of technical innovators in the years between 1820 and 1941 had learned from working for federal or local governments—all well before the huge expansion of the federal support for science and technology during and after World War II (Thomson Reference Thomson2014). The economic impact of that learning was likely huge.
Any study of the impact of the research—even when it was done by private entrepreneurs—will also have to take into account the effect of government laws and regulations that complemented the researchers’ discoveries and helped resolve problems with externalities when those discoveries were put to use. The legal and administrative measures adopted to control agricultural pests in nineteenth and twentieth-century California are an excellent illustration of governmental efforts to ensure that research enhanced productivity. To take one example among many, after phylloxera had wreaked havoc in California vineyards, the California State Legislature in 1880 boosted funding for the state university's agricultural research. The state government also created a Board of Viticultural Commissioners, which did its own research on remedies against phylloxera, and the Board and the University then worked to put their research into practice.Footnote 24 As that example illustrates, the governments that acted were often local ones.
PUBLIC OR PRIVATE PROVISION
There are of course private alternatives to many of the growth enhancing goods and services governments provide. Private actors can build roads and collect tolls from users. They can also provide clean water, either by constructing the water system themselves or by operating a government build system. They can even provide security ranging from guard services to the sort of mercenary armies that were common in Europe and Asia in the early modern period. The private alternatives may of course be problematic, if the goods or services are public or involve externalities or natural monopolies.Footnote 25 But even when those problems can be solved, private provision still usually assumes that the state is strong enough to regulate markets, to remake property rights, and to resolve disputes over them. In eighteenth-century France, for instance, it would have been profitable for private entrepreneurs to drain marshes and irrigate fields, even though their private projects were plagued by externalities. The problem was that the legal system encouraged individuals to seize all the profits of any planned drainage or irrigation project, and it frustrated efforts to solve the problem via private bargaining (Rosenthal Reference Rosenthal1992). Reforming the legal system to resolve those problems was politically impossible, for it would have meant changing both property rights and fundamental political bargains between the monarchy and local elites. That sort of drastic solution required the French Revolution. Only then did the French state become strong enough to make private provision of drainage and irrigation feasible on a large scale.
Britain avoided that problem. The issue here, it should be stressed, was not protection of property rights against a predatory state in eighteenth-century France. Property rights were in fact secure in Old-Regime France—if anything, too secure. Rather, it was the political weakness of the French monarchy. The French kings not only collected much less tax revenue relative to the size of their economy than the British, but they could not tamper with the underlying political equilibrium that protected existing property rights, taxes, and the make up of the judicial system.Footnote 26
In Britain, by contrast, the state wielded far more power in the eighteenth century. Although it is well known that the Glorious Revolution constrained the king, we forget that it also boosted the taxes that were collected and made Parliament the ultimate authority over the projects that private provision would necessitate. Thanks to the Glorious Revolution, Parliament alone would henceforth have the power to authorize the projects, and it alone could rearrange property rights when that was necessary. The result was an explosion of private projects—from canals to toll roads—that enhanced economic growth. Parliament could also create new local government bodies to provide goods such as water or infrastructure, so that greater private provision could march hand in hand with more public provision too.Footnote 27
Analyzing the politics is therefore essential for understanding when private provision prevails and when it fails to make any headway. At first glance it might seem that simple theory alone could make sense of the politics and thereby explain the trends and patterns of private provision. One might imagine, for instance, that private provision would simply disappear as the scale of government increased. A simple principal agent model might suggest as much, because a risk averse agent would shun a big government project whose return was correlated with those of the agent's other assets. Although the government could break the project down into small pieces, at some point economies of scale in supervision would make it better for the government to hire multiple agents and pay them a fixed salary—or in other words, turn them into bureaucrats.Footnote 28
Unfortunately, that simple theory does not fit reality. To begin with, private provision has not vanished. It is true that large-scale military entrepreneurs did slowly disappear after 1760 in Europe, after having financed wars and mobilized armies ever since the late Middle Ages (Parrott Reference Parrott2012). The private companies that fought naval and colonial wars, such as the East India Company and the Dutch East India Company, also vanished. But after a pause from the late eighteenth to the late twentieth century, the military entrepreneurs have come back, with Blackwater being the best known recent example.
The politics suggests why, at least in democracies. Nationalism facilitated conscription, from the French Revolution through World War II and the early years of the Cold War. But once the draft and military casualties become unpopular, political leaders had an incentive to adopt a military policy that would avoid the wrath of voters. That might mean switching from conscription to a volunteer army or finding technological substitutes for ground troops, which could range from atomic weapons to drones. But it could also mean hiring modern mercenaries, as in Iraq.
In any case, we have to analyze the politics and political history to understand why mercenaries have made a comeback in modern democracies and why they were not used heavily in the West between the late eighteenth century and the late twentieth century. The same holds for explaining why private provision waxes and wanes over time. In the United States, the shift from private water companies in the nineteenth century to municipal provision in the twentieth was at least in part Progressive Era politicians’ response to problems of corruption. The move back to private water provision in the late twentieth century was a reaction to other political problems, from excessive pay for patronage employees to the deterioration of water systems brought on by low water rates that elected officials had granted to voters (Troesken Reference Troesken, Glaeser and Goldin2006).
In France, by contrast, a very different political history meant that private companies have always been much more likely to provide clean water. The root cause is that central governments in France, from before the French Revolution to the present, have made it difficult for cities to impose or increase taxes, and with no tax revenue to borrow against for capital intensive projects like water systems, the cities have turned to private companies for the provision of clean water. By contrast, the tradition of federalism in the United States made it much easier for local governments to levy taxes and borrow against future tax revenue, which paved the way for municipal provision (Hoffman, Postel-Vinay, and Rosenthal Reference Hoffman, Postel-Vinay and Rosenthal2007, p. 184).
REDISTRIBUTION
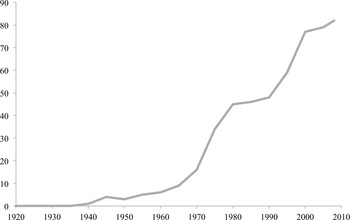
Today, economic inequality has become a salient issue. Inequality is rising in parts of the West (Goldin and Katz Reference Goldin and Katz2008; Piketty and Saez Reference Piketty2013), and it is predicted to climb even higher in the future (Piketty Reference Piketty2013). And to judge from the words that appear in books, writers think it deserves far more attention than in the past. In the English language books that Google has scanned, for example, the phrase “income inequality” crops up much more often today than it did before the 1970s (Figure 2). And English is not an exception.Footnote 29
There are a number of remedies against rising inequality, but they all require some sort of government action. Some of the treatments involve supplying more growth enhancing public goods and services, such as education or—even more important—intervention in early childhood to help kids acquire noncognitive skills (Heckman Reference Heckman2000, Reference Heckman2006). But others focus on redistribution—on taxing the rich and offering the poor more social spending. That is something only states can do.
In democracies, simple median voter models fail to account for the variations in redistributive taxation and social spending that we observe (Lindert Reference Lindert1996). To explain them, we have to examine the politics more carefully. Low voter turnout among the poor reduces redistribution (at least in the United States), and so, more generally, do differences of ethnicity and income between the poor and voters in the middle of the income distribution (Lindert Reference Lindert1996; McCarty, Poole, and Rosenthal Reference McCarty, Poole and Rosenthal2006). Political institutions, such as the separation of powers and the lack of proportional representation, help explain why European countries redistribute more today than the United States does (Alesina, Glaeser, and Sacerdote Reference Alesina, Glaeser and Sacerdote2001).
FREQUENCY OF THE EXPRESSION “INCOME INEQUALITY” IN ENGLISH BOOKS, 1920–2008 (PER MILLION WORD PAIRS)

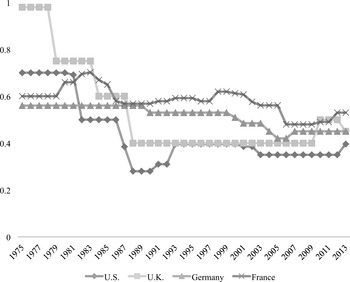
But even with those political variables taken into account, there is much that we do not understand. Consider, for example, taxes imposed on the highest incomes. Despite political institutions that would presumably discourage high tax rates on upper incomes, the United States was actually a leader of the movement to heavily tax the rich between World War I and World War II (Piketty Reference Piketty2013, pp. 802–7). The high marginal tax rates for upper incomes remained in force through the 1970s, and although it was possible to avoid them to some extent, they did have a real bite. But in the 1980s, the United States chopped the highest marginal income tax rate from 70 percent to 28 percent, and Britain did much the same, cutting its levy on the highest incomes from 98 percent in 1978 to 40 percent in 1988. France and Germany, by contrast, kept their top tax rates about the same (Figure 3).
TOP MARGINAL INCOME TAX RATES: BRITAIN, FRANCE, GERMANY, AND THE UNITED STATES, 1975–2013

Such changes in tax rates are puzzling, particularly in democracies, for rates that do not vary will bring in the same revenue and yet spare risk averse voters unnecessary shifts in their after tax income. The differences across countries are equally perplexing. Arguing that it is easy for the rich in Britain and the United States to lobby for tax cuts because they are a small group for whom the lobbying expenses are a tiny fraction of income fails as an explanation: after all, why did the rich in France and Germany fail to get lower taxes? Claiming that Britain and the United States were simply responding to slower economic growth fails too. The differences in their growth rates and growth rates in France and Germany were minimal between 1970 and 1980, and the gap in economic growth rates had actually been much larger in the 1950s and 1960s, but that did not prompt the United States and the United Kingdom to cut their tax rates then.Footnote 30
Nor is it enough to point to Ronald Reagan and Margaret Thatcher, although they certainly played a role. The politics is in fact more complex than that. In the United States, for example, it was the threat posed by a movement of political entrepreneurs that provoked the tax cuts in the 1980s. Riding the 1978 success of the popular ballot initiative that limited property taxes in California (Proposition 13), the political entrepreneurs pressured state legislatures to call for a constitutional convention to adopt an amendment that would balance the federal budget and limit federal taxes and spending. By 1979—a year before Reagan was elected—fully 30 state legislatures had voted in favor of a constitutional convention to adopt a balanced budget amendment to the United States constitution, and the threat of such a convention was getting Congress's attention. To ward off the constitutional convention, Congress responded by cutting taxes deeply—in fact, even more deeply than the Reagan administration wanted.Footnote 31
CONCLUSION
As the tax cuts in the United States illustrate, we have only scratched the surface in uncovering the politics and history behind the variation in tax rates. Again, much more remains to be done. If the United States can again serve as an example, the key actors may no longer be organized high income groups but rather legislators who can extract campaign contributions from these groups by brandishing the threat of imminent tax increases (McCaffery and Cohen Reference McCaffery and Cohen2006). And beyond variations in the tax rates, we need to analyze their impact. Do the tax cuts account for most of the rising income inequality in Britain and the United States? It has been argued that they do, by giving top executives an incentive to bargain for a greater share of corporate profits. But evidence also supports a different explanation based on changing social norms—yet another illustration of how we may have to look to other fields to explain the behavior we want to analyze.Footnote 32
We need the same sort of research for all the other things states do: We should study the impact of state actions and analyze the politics behind the decisions political leaders take. That means paying close attention to the history, because we cannot simply skim over the surface and say “it was Reagan” or “it was separation of powers.” To explain the politics, we have to consider alternatives to the state (particularly in the distant past), and ask which authorities or what level of government will act or put policies into practice—the central or local? We have to collect more data for central and local governments across the world, and we may have to look beyond our usual methods—to behavioral economics, evolutionary anthropology, political science, or fiscal sociology—to explain what actors do. Above all else, we have to leave aside the fixation on constraining the executive. Constraints on state power are certainly important, but states can also do extraordinary good.