


INTRODUCTION
Spatial processes are increasingly gaining attention in ecology (van Nes & Scheffer Reference VAN NES and SCHEFFER2005), because they can have an effect on ecosystem functioning (Rietkerk et al. Reference RIETKERK, BOERLIJST, VAN LANGEVELDE, HILLERISLAMBERS, VAN DE KOPPEL, KUMAR, PRINS and DE ROOS2002). A thorough understanding of key spatial processes as well as the effects of these processes on ecosystems is essential for developing predictive theory on patterns in ecosystems. Especially in spatially heterogeneous ecosystems, spatial processes are expected to play a key role (van Nes & Scheffer Reference VAN NES and SCHEFFER2005). Savannas are typically spatially heterogeneous because the ratio and spatial distribution of the main vegetation constituents, a continuous grass layer and a discontinuous tree layer, vary considerably (Scholes & Archer Reference SCHOLES and ARCHER1997).
In savannas, herbivory, fire and water availability play important roles in the dynamics and structure of the system (Scholes & Archer Reference SCHOLES and ARCHER1997, van Langevelde et al. Reference VAN LANGEVELDE, VAN DE VIJVER, KUMAR, VAN DE KOPPEL, DE RIDDER, VAN ANDEL, SKIDMORE, HEARNE, STROOSNIJDER, BOND, PRINS and RIETKERK2003). Herbivory and fire are typically spatial processes, as their occurrence and impact on plants largely varies over different locations in the same landscape. The level of herbivory is mostly determined by the availability and accessibility of digestible plant material (Marion et al. Reference MARION, SWAIN and HUTCHINGS2004), while fire frequency and severity are determined by the local occurrence of ignition events, the fuel load (mostly grass in the case of savannas, Shea et al. Reference SHEA, SHEA, KAUFFMAN, WARD, HASKINS and SCHOLES1996) and the possibility of the fire spreading to neighbouring areas (Berjak & Hearne Reference BERJAK and HEARNE2002). An intriguing aspect of savannas is that savanna trees are often found in a clustered fashion (Barot et al. Reference BAROT, GIGNOUX and MENAUT1999, Caylor et al. Reference CAYLOR, SHUGART, DOWTY and SMITH2003, Kennedy & Potgieter Reference KENNEDY and POTGIETER2003, Skarpe Reference SKARPE1991). Because many processes interact in savannas, it is difficult to disentangle the importance of the different processes that play a role in the origin and maintenance of this clustered pattern. However, several hypotheses exist on which spatial processes play key roles.
Mechanisms that can induce clustering of plants are the limited dispersion distances of seeds, clonal growth, or local nutrient concentration, for example by termites (Barot et al. Reference BAROT, GIGNOUX and MENAUT1999, Konaté et al. Reference KONATÉ, ROUX, TESSIER and LEPAGE1999, Pacala & Levin Reference PACALA, LEVIN, Tilman and Kareiva1997). Competition between plants is expected to disaggregate plants as plants nearby compete more strongly with each other than plants further apart for underground resources like water and nutrients (Pacala & Levin Reference PACALA, LEVIN, Tilman and Kareiva1997, Skarpe Reference SKARPE1991, Smith & Goodman Reference SMITH and GOODMAN1986). In savannas the most likely resource that plants are competing for is water (Scholes & Archer Reference SCHOLES and ARCHER1997, Walker & Noy-Meir Reference WALKER, NOY-MEIR, Huntley and Walker1982), and therefore factors that influence soil water availability are likely to affect the clustering of trees as well. Clayey soils retain water better than sandy soils, and have therefore a positive effect on the water availability for trees and grasses in the upper soil layers (de Ridder & van Keulen Reference DE RIDDER and VAN KEULEN1995). This reduces competition for water, and therefore might positively affect the clustering of trees. Also herbivores can play a role in the spatial organisation of plants. Accumulation of seeds in herbivore droppings might cause a clustering of trees, while the disruption of tree clusters by herbivores (e.g. the uprooting of trees by elephants) might cause a randomization of the spatial tree pattern.
Apart from the above-mentioned processes, fire could also affect the spatial patterning of trees in savannas (Gignoux et al. Reference GIGNOUX, MENAUT, NOBLE, DAVIES, Newbery, Prins and Brown1998, Jeltsch et al. Reference JELTSCH, MILTON, DEAN and ROOYEN1996, Reference JELTSCH, MILTON, DEAN, VAN ROOYEN and MOLONEY1998). Modelling studies suggest that when fires occur frequently, this increases clustering among trees (Gignoux et al. Reference GIGNOUX, NOBLE, MENAUT, Bellan-Santini, Bonin and Emig1995, Jeltsch et al. Reference JELTSCH, MILTON, DEAN and ROOYEN1996), because clustered trees are less affected by fire through their combined suppressing effect on grass biomass, and thus fuel load, than evenly spaced trees. However, little empirical evidence is available to support this hypothesis (Kennedy & Potgieter Reference KENNEDY and POTGIETER2003, Skarpe Reference SKARPE1991).
In this paper, we investigate which mechanisms determine tree clustering in savannas. If limited seed dispersal or clonal growth are the processes that form tree clusters, we would expect most trees in a cluster to be of the same species. In that case the nearest neighbours of trees should be more frequently of the same species instead of from a different species. We define this as ‘active clustering’. If other processes like fire or locally higher nutrient concentrations are determining the clustering of trees, we would expect a positive correlation between these factors and the clustering of trees. We define this as ‘passive clustering’. We then expect that the nearest neighbours of trees can be of any species, including the same species.
Given the same density, clustered trees have shorter nearest-neighbour distances than trees that are randomly or evenly spaced. The distance to nearest neighbours has an effect on the competition between individuals (Carrick Reference CARRICK2003, Pacala & Levin Reference PACALA, LEVIN, Tilman and Kareiva1997). Competition can reduce plant growth, with adverse implications for plant size, like canopy diameter. This means that trees that are close to each other may have smaller canopy diameters than trees further away. Plotting the distance of trees to their nearest neighbouring tree against their canopy diameters can give an indication of the strength of this competition (Smith & Goodman Reference SMITH and GOODMAN1986). A positive, steep trend would suggest that competition between these trees affects their performance (Figure 1). Fire can also reduce the height of small trees, while its impact on larger trees is minimal (de Ronde et al. Reference DE RONDE, TROLLOPE, PARR, BROCKETT, GELDENHUYS, Goldhammer and De Ronde2004). Because of a strong correlation between tree height and canopy diameter, the canopy diameter of savanna trees can be expected to be smaller with fire than without fire (Figure 1). The difference in canopy diameter with fire and without indicates the impact of fire on trees. If larger trees experience a less negative effect from fire than smaller trees, their canopy diameter is hardly affected by fire (compare X1 with X2 in Figure 1a). However, if trees in clusters are better protected from fire than solitary trees, we expect that trees closer together experience a smaller negative impact from fire than trees that are further apart (compare X1 with X2 in Figure 1b). When the effect of fire on trees is not influenced by the height of trees or the distance to nearest neighbours, or when these two processes are equally strong in modifying the effect of fire and compensate each other, the effect of fire should be similar at short nearest-neighbour distances as well as long nearest-neighbour distances (compare X1 with X2 in Figure 1c).
Hypothetical relationships between nearest-neighbour distances and canopy diameters, and the effect of fire. Bold lines represent the potential positive relationship between nearest-neighbour distances and canopy diameters if no burning takes place. Thin lines represent the potential positive relationship if burning does take place. If large trees experience a smaller negative effect from fire than small trees, canopy diameter is hardly affected by fire (compare X1 with X2) (a). If trees in clusters are better protected from fire than solitary trees, we expect that trees closer together experience a smaller negative impact from fire than trees that are further away from each other (b). When the effect of fire on canopy diameter of trees is not influenced by the height of trees or distance to nearest neighbours, or when these two processes are equally strong and compensate each other, the effect of fire should be similar at short nearest-neighbour distances as well as long nearest-neighbour distances (c).
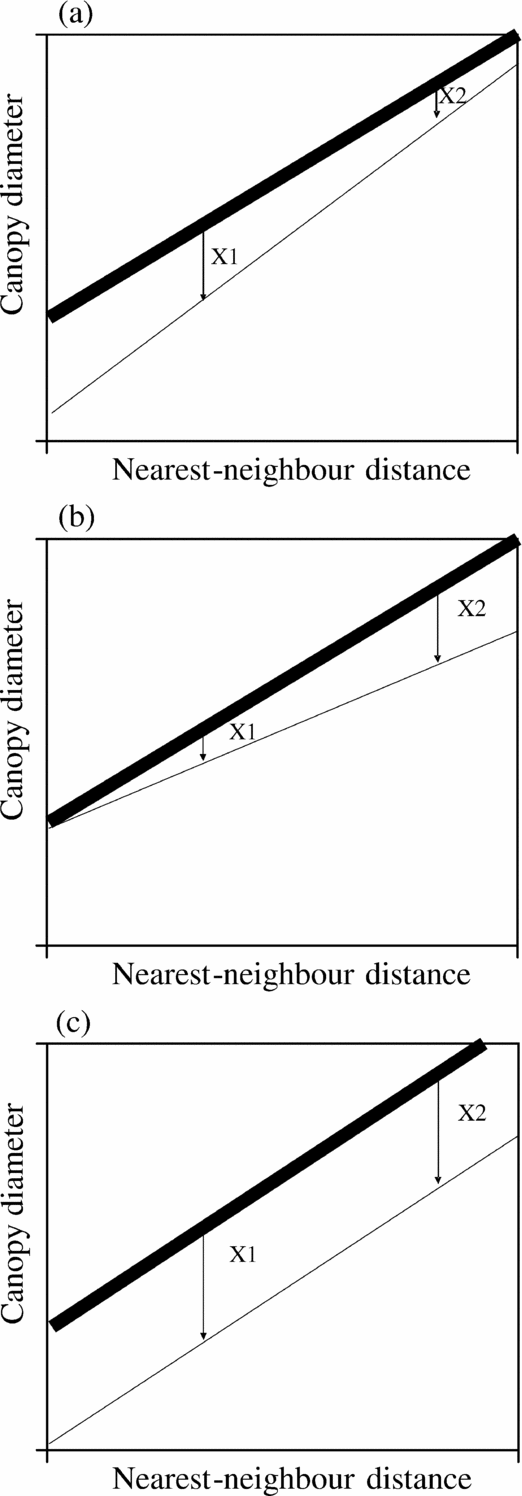
To investigate the degree to which processes like fire or seed dispersal (which is directly correlated with seedling establishment) contribute to tree clustering in savannas, we conducted a field study where we measured the clustering of savanna trees over a range of fire frequencies, and other environmental variables. We statistically tested which environmental variables determined clustering. We have two hypotheses to explain tree clustering: (1) increasing fire frequency leads to increasing tree clustering, because protection against fire damage acts as a clustering mechanism (i.e. passive clustering), and (2) tree clusters are of the same species as seed dispersal is limited (i.e. active clustering). In the analysis, we distinguish tree species with high and low abundance because we expect that trees that are abundant are better adapted to the prevailing conditions and therefore are less susceptible to fire than less abundant species. Therefore highly abundant trees might have less need to adopt clustering strategies to survive fires compared with rare tree species. By analysing the relationship between the distance of a tree to its nearest neighbour and its canopy diameter, we also tested the effect of clustering on the impact of fire on canopy diameter as formulated in Figure 1.
METHODS
Study site
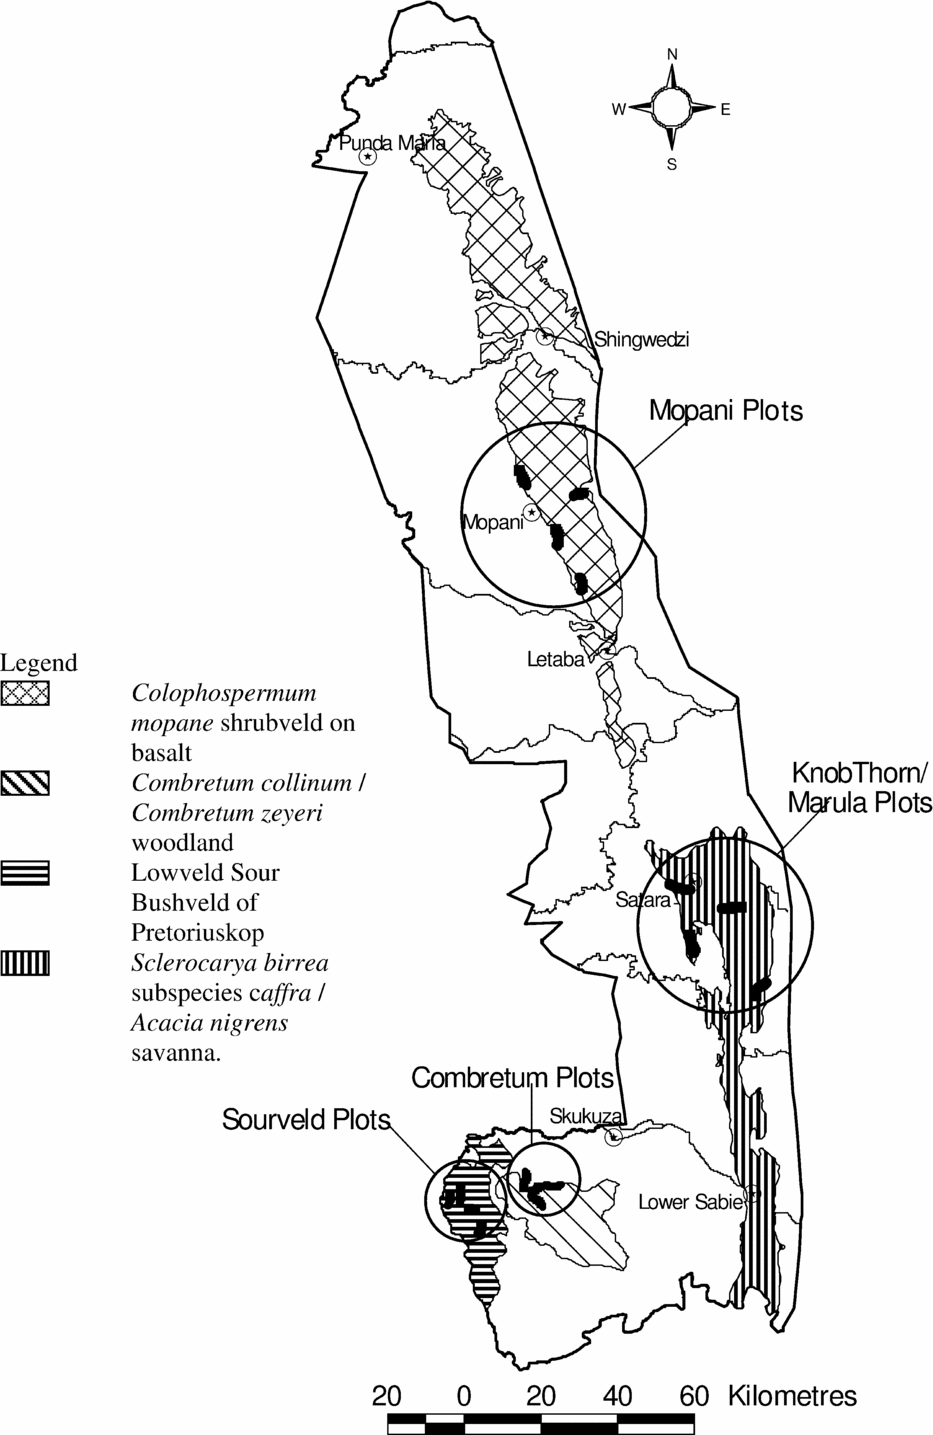
The study was performed in the experimental burning programme of the Kruger National Park in South Africa (Biggs et al. Reference BIGGS, BIGGS, DUNNE, GOVENDER and POTGIETER2003). The programme was initiated in 1954 and consists of 7–10-ha plots that are burned at varying intervals ranging from total fire exclusion to annual fires. Each treatment is repeated in all four major landscape types of the park (Gertenbach Reference GERTENBACH1983). The major landscape types are roughly positioned in a north–south gradient (Figure 2), which coincides with a dry–wet rainfall gradient. The long-term average annual rainfall is 496 mm at Mopane in the north and 746 mm at Pretoriuskop in the south (http://www.sanparks.org/parks/kruger/conservation/scientific/faq/KNP_Seasons.pdf; Table 1). Each burning treatment in each landscape type is replicated four times. For this study, the annual, triennial and no fire (control) treatments in each landscape type were used as study plots. This yielded a total of 48 different plots divided over three treatments, four landscapes and four replications.
Map showing the locations of the experimental burning plots of the Kruger National Park in South Africa (after Biggs et al. Reference BIGGS, BIGGS, DUNNE, GOVENDER and POTGIETER2003). Black shapes indicate location of the experimental burning plots.
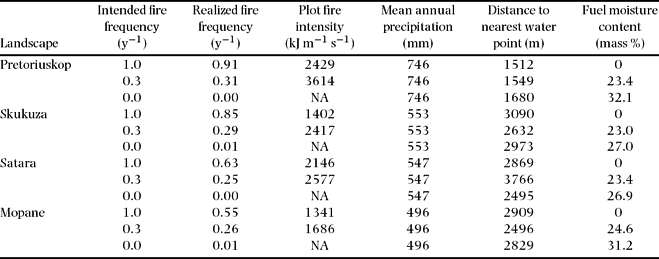
Average of predictor variables, used in the analysis, specified per landscape and burn treatment. Variables after Govender et al. (Reference GOVENDER, TROLLOPE and VAN WILGEN2006) except for precipitation (KNP Scientific Services, http://www.sanparks.org/parks/kruger/conservation/scientific/faq/KNP_Seasons.pdf), realized fire frequency (Biggs et al. Reference BIGGS, BIGGS, DUNNE, GOVENDER and POTGIETER2003) and distance to nearest water point (KNP Scientific Services, unpublished data). Plot fire intensity indicates the average heat emitted per metre fire front per second, and is calculated using Byram's equation where fire intensity is the product of the heat yields of fuels, the amount of fuel consumed and the rate of spread of fire (Byram Reference BYRAM and Davies1959).
The most northern plots are dominated by Colophospermum mopane (J.Kirk ex Benth.) J.Léonard and occur on clay basaltic soils (Mopane plots). Further south are the Satara plots, also on clay basaltic soils. The woody component of these Satara plots is dominated by Sclerocarya birrea (A.Rich.) Hochst. and Acacia nigrescens Oliv. Further south again is the Combretum spp. landscape type (Skukuza plots), on sandy granitic soils. The woody component in these plots is mainly dominated by Combretum collinum Fresen. and Combretum zeyheri Sond. The most southern plots occur on sandy granitic soils (Pretoriuskop plots). The vegetation is dominated by dense, tall Terminalia sericea Burch. ex DC. stands.
Sampling
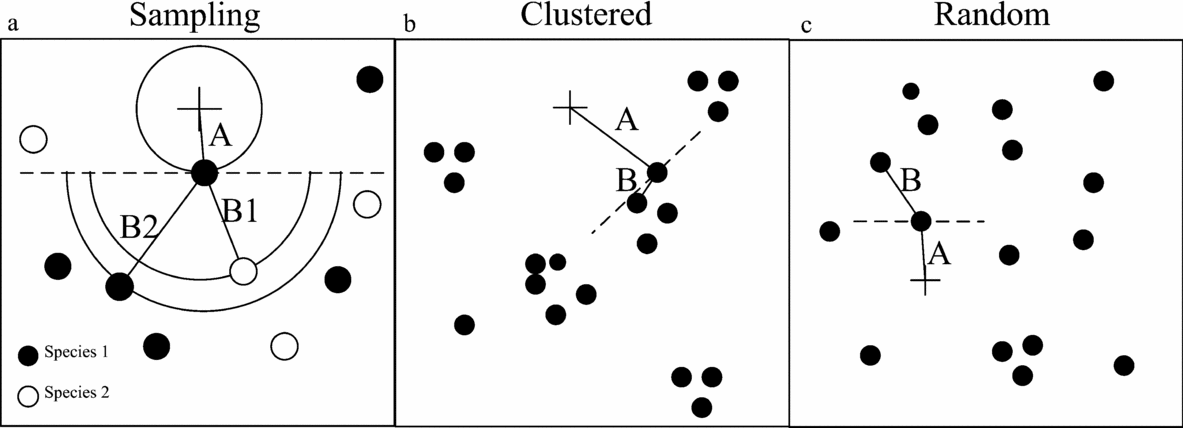
We measured the clustering of savanna trees using the T-squared sampling method (Hines & Hines Reference HINES and HINES1979). This method measures two distances: the distance from a random sample point (+ in Figure 3a and b) to the closest tree (distance A, Figure 3a), and the distance from that tree to its nearest neighbour (distance B, Figure 3a), with the restriction that the angle between distances A and B is minimally 90°. To distinguish whether trees are actively or passively clustered, we created two datasets. For each dataset, distance B was measured differently. For passive clustering, an any-species dataset was created where distance B was measured to the nearest neighbour of the tree without consideration of the species of this nearest neighbouring tree. For active clustering, a same-species dataset was created where distance B was measured to the nearest neighbour of the tree of the same species. These distances can be the same when the nearest neighbouring tree is of the same species; otherwise, the distance for the any-species dataset will always be shorter than the distance for the same-species dataset.
Examples how T-squared sampling works in the field. The measuring of distance A and distance B to the same species and any species (a). When trees are clustered (b), distance A is on average longer than distance B, when trees are randomly distributed (c), distance A is on average equal to distance B.
Of all three trees that were included in each sample using the T-squared sampling method, tree species, height, canopy diameter, dominant grass species under the canopy and whether the tree was on a termite mount was recorded. Also, as an indicator of herbivore effects, the presence of damage from browsing (e.g. minor bark damage) or elephants (e.g. uprooting and breaking off of high branches) on the trees was recorded for each tree. Because we tested the effect of clustering of established trees, only trees of 1.5 m in height or taller were incorporated in the sampling. In each plot 40 sample points were taken, resulting in 120 measured trees per plot. Furthermore, a soil sample was taken at each sample point and manually classified as sand, loam or clay (Euroconsult 1989). Distance between the sample points was 20 m on average, but varied according to the density of trees in the plots. In total, 2350 points were sampled in 48 plots, distributed over three different fire regimes and four different landscape types.
Clustering index
If trees have a random distribution, then on average distance A should be similar to distance B, while in a clustered environment distance A should be larger than distance B (Figure 3b). Therefore, we used the ratio of distance A and distance B as a proxy for the clustering of trees. Larger values of this ratio indicate a more clustered distribution. This ratio was calculated for both the any-species dataset and the same-species dataset. To prevent a skewed distribution, the natural logarithm of the ratio was used and subsequently the average of this value for each plot was calculated, yielding 48 data points. This clustering index at the plot level will be further referred to as C. There is a bias in our method as the distance A for the same-species dataset will always be longer or equally long as distance A for the any-species dataset. However we are only using the relative differences in clustering found within one dataset to reduce the effect of this bias.
We divided our same-species dataset into two different subsets. One subset contained only the same-species nearest neighbour data for the most dominant species of each plot, and the other subset contained the same-species nearest-neighbour data for the less abundant species in a plot. Only subsets for plots that contained more than 20 samples were included in the analysis. For example, when a plot was completely dominated by C. mopane, then only the dominant-species subset was included in the analysis, but the subset for less abundant species was excluded from the analysis.
To test the suitability of our T-squared sampling method to detect clustering in different densities of trees we performed computer simulations. In these simulations, we applied the sampling method on nine different levels of clustering (from random to highly clustered), each level repeated 20 times. The clustering in the landscapes was generated making use of a Matérn process (Picard et al. Reference PICARD, KOUYATÉ and DESSARD2005). In a Matérn process three parameters are needed: the density of parent points, the number of offspring per parent point, and the radius over which offspring are distributed. In our simulated landscape only the radius over which offspring were distributed was varied. A large radius resulted in random point distributions, whereas short radii yielded clustered point distributions.
Variables
Whether fire affects clustering of savanna trees is largely dependent on its intensity and flame height, determined by grass biomass as fuel load and local weather conditions. However, the grass composition can also play a role. A grass species that should be specifically mentioned for the Kruger National Park is guinea grass (Panicum maximum Jacq.), which is considered to reduce fire intensity (Grice & Slatter Reference GRICE and SLATTER1996, Wallmer Reference WALLMER and Van Cuyenberg1994). It grows abundantly under tree canopies, while being relatively scarce outside tree canopies (Gibbs Russel et al. Reference GIBBS RUSSEL, WATSON, KOEKEMOER, SMOOK, BARKER, ANDERSON and DALLWITZ1990, Tainton Reference TAINTON1999). The frequency of times that P. maximum was the dominant grass species was calculated per plot.
Termite mounds were also included in the analyses, because they are known to provide a different micro-habitat, with for example a higher nitrogen content than the surrounding soil (Joquet et al. Reference JOQUET, TAVERNIER, ABBADIE and LEPAGE2005), or with less grass biomass. We calculated the frequency of trees in a plot that were situated on a termite mound.
A tree species that is important to mention separately is the mopane tree (Colophospermum mopane), which occurs in dense monospecific stands as result of clonal growth and regeneration. Because of its dominance in some parts of the research area, it can obscure overall trends, and therefore it was included in the analyses. To do so, we calculated the frequency of the occurrence of C. mopane in each plot.
For each burning treatment, long-term (±20 y) data are available on fire frequency, grass biomass (fuel load) and distance to waterholes (Table 1). However, deviations from the intended fire frequencies have occurred. Sometimes plots were accidentally burnt by runaway fires or, contrastingly, burning could not take place because the vegetation was too wet or not abundant enough. For our analysis, we used the actual fire frequency, which is the total number of burns in a plot since 1954 divided by the number of years that the experimental burning programme was running (i.e. 52 y). Data on actual fire frequencies were retrieved from Biggs et al. (Reference BIGGS, BIGGS, DUNNE, GOVENDER and POTGIETER2003). Additionally, data on the moisture content of the biomass during burning events and the average intensity of fires – both averaged over all burning events – were included in the analyses as indicators of the severity of the fire history.
Data on distance to water points were used as a proxy for grazing pressure, complemented with the data on browsing and elephant damage. For the presence of browsing damage and elephant damage the frequency of occurrence for each plot was calculated. For each plot, the average clay content and average tree height was calculated. Finally, mean annual precipitation was included the analyses.
For the same-species dataset, the species richness and the evenness of species distribution in the plot can affect the level of clustering that is measured for a species. For rare species, distance B will always be larger, than for dominant species. To control for a possible effect of species richness in each plot, as well as the evenness of the species distribution, we included the Shannon index for each plot. The Shannon index is calculated as

where s is the number of species recorded in each plot, N is the total number of trees sampled in each plot, and ni is the number of trees of species i among the sampled individuals in each plot. This index takes both the evenness and the number of species into account.
Analyses
We used linear regression to test the relation between the distribution radius of the Matérn process and C from the computer simulations to test the suitability of our T-squared sampling method. To investigate what determines clustering of savanna trees, we performed a backward stepwise linear regression with C as dependent variable on both the any-species dataset and the same-species dataset. We included both the main effects of possible processes affecting clustering of trees as well as their interaction with fire.
To test whether fire or clay content in the soil might also have an indirect effect on clustering within the same-species dataset by affecting the species abundance and evenness, the correlation between fire frequency and the Shannon index was tested.
The effect of distance between nearest neighbours on the impact of fire was tested by applying linear regression to the distance between nearest neighbours and canopy diameter (Smith & Goodman Reference SMITH and GOODMAN1986). Regression was performed separately on data from the plots that never burnt, plots with annual burning and plots with triennial burning. Regression coefficients (i.e. slope and intercept) were tested for significant differences among burning regimes, using the Tukey test as described in Zar (Reference ZAR1996).
RESULTS
The regression between C and the distribution radius of the Matérn process yielded a significant negative relation (n = 180, P < 0.001, R2adj = 0.66), confirming that our T-squared sampling method indeed provided us with a measure for clustering of trees.
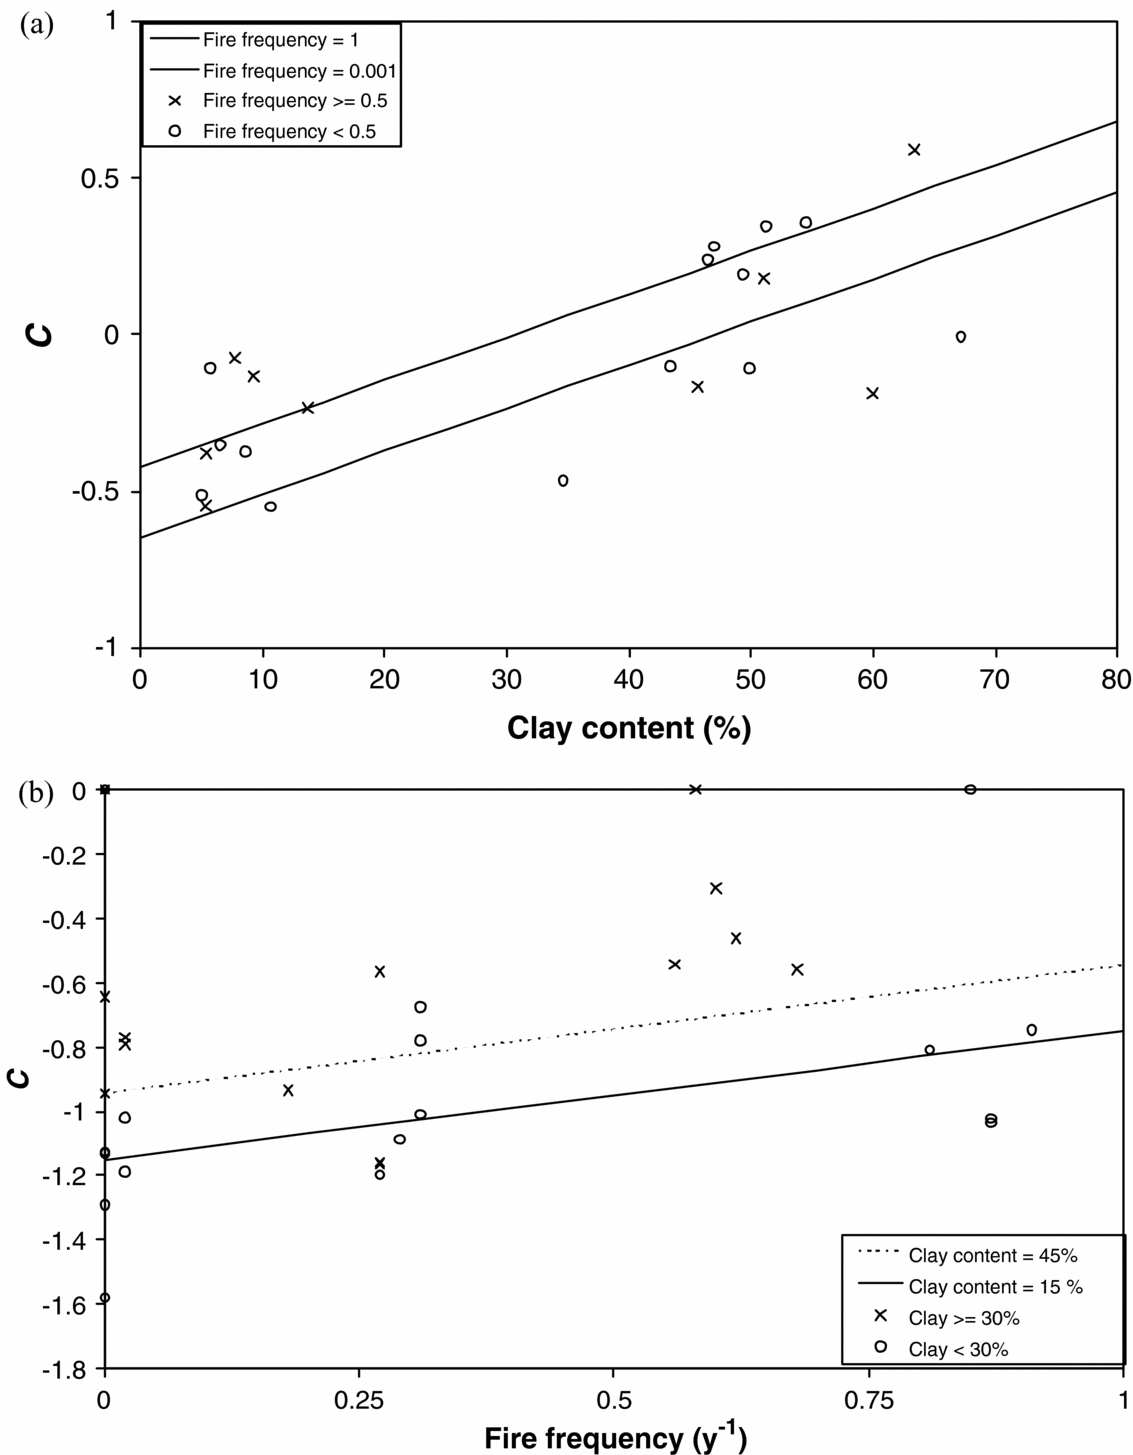
For the any-species dataset, we found a positive effect of the soil clay content on the clustering of trees (P < 0.001, n = 48, R2adj = 0.318). The clustering in the most abundant tree species in the same-species dataset was found to be positively affected by soil clay content (P < 0.001), affected by the interaction between soil clay content and fire frequency (negative sign, P > 0.05), affected by the interaction between distance to water points and fire frequency (positive sign, P > 0.05), and negatively affected by the height of trees (P > 0.05; n = 23, R2adj = 0.591, P < 0.001 for the full model). Clay content of the soil alone explained part of the variation (P < 0.001, R2adj = 0.22). The clustering of the less abundant tree species in the same-species dataset was positively affected by both soil clay content (P < 0.001) and fire frequency (P < 0.01; n = 31, R2adj = 0.45, P < 0.001 for the full model). The other measured explanatory variables could not be significantly included in the models. The relationships for the most abundant and less abundant species in the same-species dataset are shown in Figure 4. We found no significant correlation between fire frequency and the Shannon index (P = 0.56, N = 48), or between clay content in the soil and the Shannon index (P = 0.10, N = 48). This shows that fire frequency and clay content have no effect on the species richness or evenness, and therefore no indirect effect on clustering.
Effect of average clay content on same-species clustering for the dominant-species subset (a) and the interaction between clay content and fire frequency for the remaining-species subset (b). Points show field data and lines show the estimated models. For the remaining-species subset, the average distance to water points was used to draw the modelled relationship.
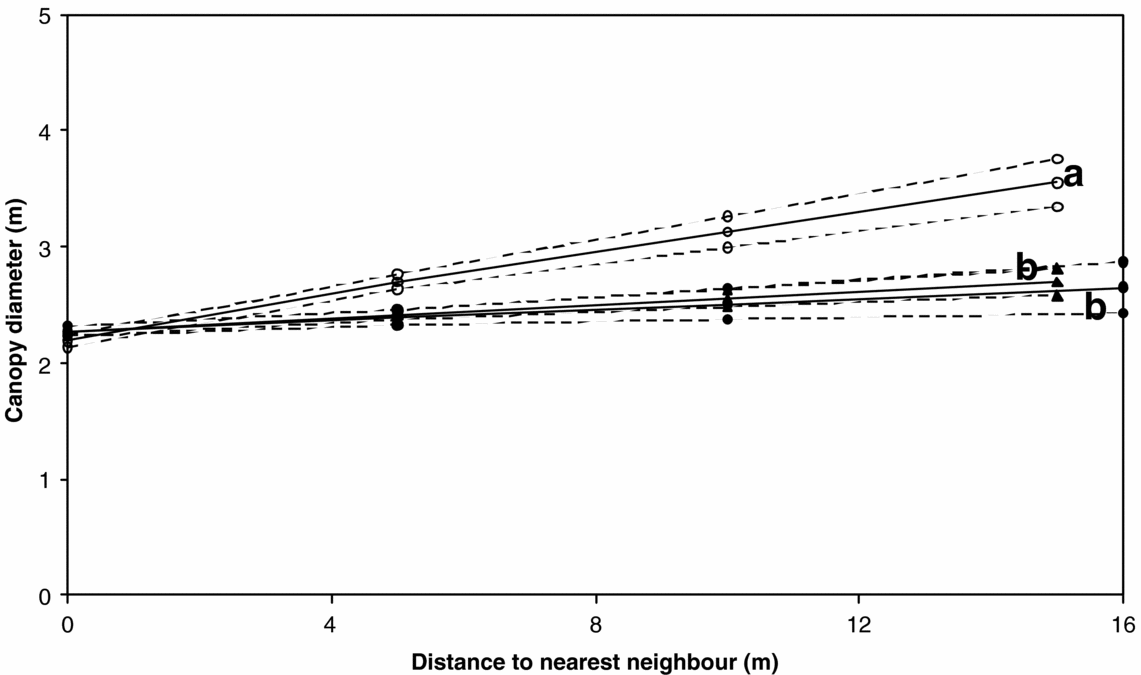
We found relationships for the distance between nearest neighbours and canopy diameters for three different fire management regimes (Figure 5). Estimated slopes were significantly different between the control plots and the plots with annual or triennial burning (P < 0.05 and P < 0.001 respectively), but not between the annual and triennial regimes (0.2 < P < 0.5).
Fitted regression model (solid lines) and the 95% confidence limits (dashed lines) for the relationship between nearest-neighbour distance and canopy diameter. Open circles indicate fire frequency = 0, closed circles indicate fire frequency = 0.3 y−1 and closed triangles indicate fire frequency = 1 y−1. Letters (a & b) indicate significantly (P < 0.05) different slopes.
DISCUSSION
Determinants of tree clustering
In this paper, we show that soil clay content has a positive effect on tree clustering, irrespective of the species involved. When looking at the most abundant tree species, clay content in the soil is important in explaining the variance. It is likely that plots with a high dominance of one tree species (like the Mopane plots in the northern part of the Kruger National Park) yield a similar sample when either sampling for the any-species dataset, or for the most abundant tree species in the same-species dataset. Therefore the similar models found for the any-species dataset and the most abundant tree species in the same-species dataset suggest that the experimental burning plots are often dominated by one species. Indeed many of the plots in the Kruger National Park are dominated by a single species. The Mopane plots are a very clear example (84% of all samples in the Mopane plots contained C. mopane), but also in the Pretoriuskop and Satara plots Dichrostachys cynera (L.) Wight & Arn. was found in 45% and 24% of the samples respectively, and in the Skukuza plots Combretum apiculatum Sond. was recorded in 23% of the samples.
The significant positive effect of soil clay content on the clustering of trees could be due to the higher water retention capacity of clayey soils. With sufficient rainfall, higher clay content results in higher water availability in the top layer of the soil. With high water availability at the surface, tree seedlings will establish more easily near mother trees that are at the same time competing for water. This suggests that clustering occurs through the active dispersion of plants (Pacala & Levin Reference PACALA, LEVIN, Tilman and Kareiva1997). Clay content might also be related to nutrient content of the soil. However, we did not analyse soil samples for nutrients, and therefore can not infer any further relations on nutrient status of the soils, in relation to clay content.
For the less abundant species in the same-species dataset we found a significant positive effect of fires on clustering. This was also found when the whole same-species subset was analysed (data not shown). This suggests that the most abundant tree species in savannas might be relatively insensitive to fire, and therefore do not respond to fire with a clustering strategy. Less fire-resistant species might be able to survive due to clustering. For the less abundant tree species in the same-species dataset also the interaction between distance to the nearest water point and fire frequency could be significantly included in the model, which has a negative effect on the clustering of trees. We assume that with increasing distance to water the impact of herbivores on the vegetation diminishes. It is possible that through disturbance of herbivores, e.g. uprooting of trees by elephants, the impact of burning becomes more effective because the area is kept open and fires are less hampered by shrubs. The impact of herbivores has been investigated in other studies (Goheen et al. Reference GOHEEN, YOUNG, KEESING and PALMER2007, Prins & van der Jeugd Reference PRINS and VAN DER JEUGD1993, van de Vijver et al. Reference VAN DE VIJVER, FOLEY and OLFF1999), showing strong significant effects on the structure of woody plant communities. Also the interaction between herbivory and fire has been shown in previous studies (Archibald et al. Reference ARCHIBALD, BOND, STOCK and FAIRBANKS2004, van Langevelde et al. Reference VAN LANGEVELDE, VAN DE VIJVER, KUMAR, VAN DE KOPPEL, DE RIDDER, VAN ANDEL, SKIDMORE, HEARNE, STROOSNIJDER, BOND, PRINS and RIETKERK2003). This study shows that the interaction between fire and herbivory does not only determine the tree-grass balance, but also the spatial configuration of the trees.
Clustering of trees has been the subject of previous field studies (Barot et al. Reference BAROT, GIGNOUX and MENAUT1999, Caylor et al. Reference CAYLOR, SHUGART, DOWTY and SMITH2003, Kennedy & Potgieter Reference KENNEDY and POTGIETER2003, Skarpe Reference SKARPE1991). Most studies found significant effects of plant size on clustering (Barot et al. Reference BAROT, GIGNOUX and MENAUT1999, Caylor et al. Reference CAYLOR, SHUGART, DOWTY and SMITH2003, Skarpe Reference SKARPE1991). Small plants were distributed in a clustered fashion, while larger trees were distributed randomly or even regularly. We also included tree canopy diameter in our analysis, but no significant effect of tree canopy diameter on clustering was found. In contrast to the before-mentioned studies we only included trees larger than 1.5 m in our study. Moreover we applied the T-squared sampling method, while these other studies mapped all the trees in each sampling plot. The latter sampling method allows analysing the point pattern for deviation from randomness by making use of F-, G- or K-functions (Diggle Reference DIGGLE2003). These methods might be more powerful in assessing aggregation of regularity in point patterns, although the collection of data for these methods is more labour intensive. Making use of the T-squared sampling method we were able to asses a wide range of environmental conditions. This allowed us to find the overriding effect of soil type on the clustering of trees. In a previous study covering the Kalahari transect, in which a rainfall gradient of 200 to 1000 mm y−1 exists, Caylor et al. (Reference CAYLOR, SHUGART, DOWTY and SMITH2003) found no significant effect of rainfall on clustering. Our study suggests that soil type, not rainfall, is the determining factor that influences tree clustering. Also our study showed that fire has an effect on clustering of less abundant tree species. These tree species are probably sensitive to fire damage. Previous empirical studies have suggested this relation before (Kennedy & Potgieter Reference KENNEDY and POTGIETER2003, Skarpe Reference SKARPE1991) but these were unable to statistically test this relation due to limited replication of fire frequencies.
In previous studies also the effect of termites on clustering has been suggested (Barot et al. 2003). Indeed termites tend to have a positive effect on tree growth. Konaté et al. (Reference KONATÉ, ROUX, TESSIER and LEPAGE1999) found that termite mounds increase water availability, while Ndiaye et al. (Reference NDIAYE, LENSI, LEPAGE and BRAUMAN2004) found that the mounds of the termites were hotspots for mineral nitrogen, with ammonium and nitrate concentrations that were 50 to 100 times higher than the concentrations in the surrounding soil. Barot et al. (2003) found a positive spatial correlation between the location of termite mounds and clustering of trees and savanna palms in the Lamto reserve in Ivory Coast. We also included the occurrence of termite mounds in the plots, but these were not retained in the backward selection as a significant effect on clustering. The reason might be that the sizes of termite mounds in the Kruger Park are much smaller (c. 1 m) than the mounds found in the Lamto reserve (2–20 m).
Because tree density affects distances between trees, the clustering measure used in this study could be expected to correlate with density, thereby affecting the interpretation of the results. When correlating tree density and the clustering of trees, we found, however, that our measure for the clustering of trees is not correlated with tree density (P > 0.05).
Effects of nearest-neighbour distances on impact of fire
We found that fire has a pronounced effect on the relationship between distance to the nearest trees and their canopy diameter (Figure 5). The relationship agrees with the hypothesis as formulated in Figure 1b. Fire reduces the size of individual tree canopies more when they are further apart than when they are close together. This suggests that trees protect each other from the effects of fire, and that as distance increases, the protective effect of surrounding trees diminishes. These findings complement those of Smith & Goodman (Reference SMITH and GOODMAN1986), who found that an increase in either soil nutrients or water resulted in an increase in the slope of the relationship between the nearest-neighbour distance and canopy diameter. In our study, an increase in fire resulted in a decrease of this slope.
CONCLUSIONS
This study has shown that clustering of savanna trees can be attributed to soil clay content and fire frequency. The availability of water and effects of competition on seedling establishment seem to be important factors determining whether trees occur in clustered patterns. Our results suggest that clustering is most likely an active process where competition for water in the upper soil layer by juveniles is regulated by the soil type and its clay content. For trees that are probably less resistant to fire, frequent burning seems to increase their clustering. The results have shown that trees can protect each other from the negative effects of fire.
These results contribute to our understanding of savanna functioning in that they show which processes are relevant in the distribution of trees in savannas. This distribution, in turn, can influence the impact of spatial processes such as fire, as suggested by our results which showed that shorter distances to nearest-neighbour trees lowered the damaging effect of fire.
ACKNOWLEDGEMENTS
This study was partially financed by donations from a WOTRO travel fund and the Schure Beijerinck Popping Fund to T. Groen. We would like to express our gratitude to KNP Scientific Services for logistic support, J. Baloy, T. Mabasa and T. Keswick for field assistance, and R. Grant and H. Biggs for useful input on the set-up of the research. G. Hengeveld was helpful on the statistics. Comments from three anonymous reviewers greatly improved the statistical analysis as well as the overall manuscript, for which we are grateful. Finally we would like to thank Elizabeth Tynan for reviewing the English of the manuscript.



