Introduction
Most modern dairy cattle breeding programs are based on the progeny test scheme, and genetic evaluations are generally derived by application of the ‘animal model’ (AM). Estimated breeding values (EBV) are derived for each animal, based on the production records of females and the relationship matrix including both breeding males and females. Genetic gains of ~0.1 phenotypic standard deviations per year can be obtained in modern progeny test schemes for a trait with a heritability of 0.25 (Nicholas and Smith, Reference Nicholas and Smith1983). In trait-based selection programs, only additive genetic variance is utilized, and selection is based only on animals that express the economic traits or their relatives. Trait-based selection is inefficient for low heritability traits or for traits with negative genetic correlations.
Marker-assisted selection (MAS) within a breed can increase genetic progress by increasing the accuracy of genetic evaluations, increasing the selection intensity, or decreasing the generation interval. Once a segregating quantitative trait locus (QTL) has been detected via linkage to genetic markers, application is difficult, because the QTL-marker phase varies among individuals; only a small fraction of the population is genotyped; and to correctly rank candidates for selection, it is necessary to correctly weigh marker, pedigree, and trait information.
Fernando and Grossman (Reference Fernando and Grossman1989) proposed a ‘gametic’ model extension to the AM that assumes that the two QTL alleles of each individual are random effects sampled from a distribution with a known variance. Breeding values are estimated for all individuals in a population, including QTL effects via linkage to genetic markers. This method is suitable for any population structure, accommodates the fact that the QTL-marker phase is generally unknown, and also can incorporate non-linked polygenic effects and other ‘nuisance’ effects, such as herd or block. The disadvantages are that the method assumes that all animals have been genotyped, and that both recombination frequency and the variance due to the QTL are known a priori. Two additional equations are added to the mixed-model equations for each animal for each QTL included in the analysis. Furthermore, each individual with unknown parents is assumed to have two unique alleles, and the prediction error variances of the effects for any individual are quite large. Finally, the assumption of a normal distribution of possible QTL allele effects may not be realistic. Meuwissen and Goddard (Reference Meuwissen and Goddard1999) proposed methods to estimate breeding values by this approach for individuals that were not genotyped, but only for specific population structures. Recombination frequency and the variance due to the QTL can be estimated by REML for multiple linked markers.
Unlike the model of Fernando and Grossman (Reference Fernando and Grossman1989), the model of Israel and Weller (Reference Israel and Weller1998) assumes complete linkage between the QTL and a single marker, and only two QTL alleles segregate in the population. The model further assumes that either a daughter or granddaughter design has been applied to determine QTL genotypes of the family ancestors. The QTL effect is then included in the complete AM analysis as a fixed effect. For individuals that are not genotyped, probabilities of receiving either allele are included as regression constants. These probabilities can be readily computed for the entire population using the segregation analysis method of Kerr and Kinghorn (Reference Kerr and Kinghorn1996). Israel and Weller (Reference Israel and Weller2002) extended this method to a situation of a QTL bracketed by two genetic markers, based on the regression analysis method of Whittaker et al. (Reference Whittaker, Thompson and Visscher1996).
The method of Israel and Weller (Reference Israel and Weller1998 and Reference Israel and Weller2002) has been tested extensively on simulated populations, and was able to yield virtually unbiased estimates of QTL effect and location, even though only 25% of the individuals were genotyped. Two- and three-generation populations were analyzed. However, when this model was applied to actual data from the Israeli Holstein population for the DGAT1 locus segregating QTL on chromosome 14 that affected milk production traits (Grisart et al., Reference Grisart, Coppieters, Farnir, Karim, Ford, Berzi, Cambisano, Mni, Reid, Simon, Spelman, Georges and Snell2002), the QTL effect was strongly underestimated relative to alternative estimation methods (Weller et al., Reference Weller, Golik, Seroussi, Ezra and Ron2003). Reasons for this discrepancy may be due to differences between the actual and simulated data sets. The actual data set differed from the simulated data sets in three aspects. A much smaller fraction of the total population was genotyped in the actual data, <1% of the total population; frequency of one allele was very low, ~10%, in the actual data; and the actual data included approximately eight generations, while the simulated data included only two to three generations.
The objectives of the current study were to determine the reasons for the discrepancy between the results on simulated and actual data, to modify the method of Israel and Weller (Reference Israel and Weller1998), so that unbiased QTL estimates are obtained, to develop a practical algorithm for MAS in which all sources of information are correctly weighted, and to test this method on simulated populations and real data.
Material and methods
Dairy cattle populations under selection for a single trait with heritability of ~0.375 were simulated. The founder population included 40 bulls and 2000 cows. Inseminations and calvings occurred at the beginning of each year, and lactation records were available for analysis at the end of each year. The interval from insemination to calving and the interval between calvings were both assumed to be 1 year. Each cow could produce up to five lactations, with a probability of 0.6 for each additional lactation after the first. For each cow, the probability of male or female offspring at each calving was 0.5. All female progeny became milking cows, and all male progeny were potential mating bulls. All animals were assumed to reach sexual maturity at the age of 1 year, and first calving of cows occurred at the age of 2 years.
Until year 6, bulls to mate cows were selected at random among the founder bulls and all other bull calves produced that reached sexual maturity. At this point, the daughters of the founder bulls completed their second lactations, and AM genetic evaluations were computed for the first time. Based on these evaluations, the five best bulls were mated to the 80 best cows to produce potential bull calves. The remaining cows were mated to the 20 best bulls including the five best. In both cases bulls were selected from those bulls selected previously as mating bulls and all 1-year-old bull calves, including the sons of the non-elite cows. Thus this scheme differs from a traditional progeny test scheme in which only bulls that have been progeny tested on a sample of test daughters are mated to the general cow population.
Bull calves not selected for breeding at the age of 1 year were culled. Genetic evaluations of the year-old calves were based on pedigree. In simulations that utilized QTL information, these data was also used to rank bull calves, as described below. Mating between bulls and cows were randomly determined within the elite and regular cow groups. Thus, except for the five best bulls, all bulls selected for breeding would produce approximately the same number of offspring each year. After year 6, genetic evaluations were computed yearly until the end of the simulation. Bulls selected for mating were not culled, and could potentially be used for mating as long as their evaluations remained among the top 20 for the general population or top 5 for elite cows.
Production records were simulated as follows:

where Yijk = lactation record for cow i in herd–year–season j, of parity k; ai = random additive genetic effect of cow i; pi = random permanent environmental effect of cow i; hj = fixed effect of herd–year–season j; q = fixed regression effect of inferred QTL genotype for cow i; and eijk = random residual. All effects other than q were simulated by selection from a normal distribution with a mean of zero. Variances were 0.25 for the polygenic effect, 0.125 for the permanent environmental effect, 0.25 for the herd–year–season effect and 0.5 for the residual. For the QTL, we assumed that only two alleles were segregating in the population, and that the effect was codominant. Thus the variance due to the QTL = 2p(1−p)a 2, where p = the frequency of one of the QTL alleles and a = 0.5 = the QTL substitution effect. Therefore for p = 0.5, the variance due to the QTL is 0.125; the total phenotypic variance, excluding the herd–year–season effect, is 1; and heritability is 0.375. For the founders, a polygenetic effect was generated by sampling from a normal distribution with a variance of 0.25. For all other animals, polygenetic effects were generated as the sum of half the sire and half the dam genetic effects plus a ‘Mendelian sampling’ effect generated by sampling from a normal distribution with a variance of 0.125. Thus the variance of the polygenetic effect was 0.25 for all animals. For founders, QTL genotype was determined by sampling twice (for each allele) from a uniform distribution. If a value smaller than the initial allele frequency was obtained, then the individual was assumed to receive a positive allele, and otherwise the individual received the negative allele. For all other individuals, QTL genotype was determined by randomly selecting one allele from each parent with a frequency of 0.5.
The first group of simulations was continued for 25 years or approximately five generations, and the total number of animals included in each simulated population was ~200 bulls and ~18 000 cows. Selection after year 6 was by a standard AM. These simulations were used to compare analysis models 1 and 2 described below. For estimation of QTL effects, only genotypes of bulls and 1-year-old bull calves were assumed to be known. Genotypes of cows were inferred from the genotypes of their sires, as described by Israel and Weller (Reference Israel and Weller1998). The initial frequency of the positive QTL allele was varied from 0.1 to 0.9, but changed during the simulation due to selection on this allele. Ten simulations were computed for each value of the initial QTL allelic frequency. The second set of simulations was continued to year 30, and included ~270 bulls and ~37 000 cows. These simulations were used to compare traditional selection and the proposed MAS algorithm. Ten populations were generated for each selection scheme.
Two models for estimation of QTL effects were compared. ‘Model 1’ was the same as Israel and Weller (Reference Israel and Weller1998), except that a fixed parity effect was included even though no parity effect was simulated. This effect was included because this is generally the case for analysis of commercial populations. The mixed model included the inverse of the numerator relationship matrix for the polygenic effect. All ancestors, including males without records, were included in computation of the relationship matrix. The assumed value for the polygenic additive genetic variance was 0.25, because the QTL was considered a fixed effect, and the assumed values for the other variance components were equal to the simulated values.
The following ‘cow model’ was denoted as ‘Model 2’:

where ci = random effect of cow i; mk = the fixed parity effect, and the other terms are as described previously. This model differs from the model of Israel and Weller (Reference Israel and Weller1998) in that only cows with production records are included, and covariances among cow effects are assumed to be zero. That is, the relationship matrix is not included. The assumed value for the cow variance was 0.375 (sum of additive polygenic and permanent environmental variances), because the QTL was considered a fixed effect; and the assumed values for the residual variance was 0.5, as simulated. Standard errors (s.e.) for estimates of the QTL were then computed as the standard deviation (s.d.) among the 10 simulations divided by the square root of 10. Difference between the simulated value and the mean of the estimates was then tested for significance by a t-test.
Although Model 2 can be used to obtain unbiased estimate of QTL effects (as will be shown), it cannot be used for routine genetic evaluation, which requires incorporation of the relationship matrix. We therefore propose the following algorithm for MAS in dairy cattle:
(a) For animals with unknown genotypes for the QTL infer genotypes based on the algorithm of Kerr and Kinghorn (Reference Kerr and Kinghorn1996).
(b) Estimate QTL effects by Model 2, as described previously.
(c) Subtract the known or inferred QTL genotype effect, based on the Model 2 estimated QTL effect, from the cows’ production records.
(d) Compute AM breeding values for all animals from the adjusted cow records. These EBV are now based only on the polygenic effect.
(e) Derive adjusted breeding values (ABV) by summing the EBV with the inferred or known QTL effect of each animal.
(f) Use the ABV to rank candidates for selection.
Standard AM and ‘adjusted’ EBV computed by the proposed algorithm were compared on the second set of simulated populations as described previously. The QTL was assumed to an initial frequency of 0.3 for the positive allele. Beginning in year 6, the simulated populations were analyzed by a standard AM and the proposed MAS algorithm was applied. In the standard breeding scheme, bull calves without progeny were ranked on the mean of their sire and dam EBV. In the MAS scheme, ABV for bull calves were computed as follows:

where PBV = polygenic breeding value, that is the sire and dam EBV without the QTL effects. QTL genotypes of all bull calves were assumed known. EBV of bulls, cows, and young sires were compared to the simulated values and EBV from a standard AM. Polygenetic variance was assumed to be 0.25 in the MAS breeding scheme, and additive genetic variance was assumed to be 0.375 in the standard AM breeding scheme. Overall genetic trends and genetic trends for the polygenic and QTL effects were compared for the two selection schemes. Correlations between simulated genetic values and genetic evaluations, and regressions of simulated values on genetic evaluations were computed for both selection schemes. Deviations of the regressions from the expected values of unity were tested by t-tests, with s.e. derived from the s.d. among each set of 10 simulations. Significance at the 5% level was determined for mean estimates outside the range of ±2 s.e.
Two QTL affecting milk production traits have been identified in dairy cattle, DGAT1 on chromosome 14 (Grisart et al., Reference Grisart, Coppieters, Farnir, Karim, Ford, Berzi, Cambisano, Mni, Reid, Simon, Spelman, Georges and Snell2002) and ABCG2 on chromosome 6 (Cohen-Zinder et al., Reference Cohen-Zinder, Seroussi, Larkin, Loor, Everts-van der Wind, Lee, Drackley, Band, Hernandez, Shani, Lewin, Weller and Ron2005). Both affect all five milk production traits (milk, fat, and protein yield, and fat and protein concentration). Effects of these QTL on production traits in the Israeli Holstein population were also estimated by Model 2. Model 1 estimate for DGAT1 was computed previously by Weller et al. (Reference Weller, Golik, Seroussi, Ezra and Ron2003). A total of 646 120 cows and 1786 bulls were included in the analyses. Of these, 341 bulls were genotyped for ABCG2, and 1985 cows and 433 bulls were genotyped for DGAT1. Genotype probabilities for all other animals were inferred by the algorithm of Kerr and Kinghorn (Reference Kerr and Kinghorn1996). Mean frequencies of the economically positive alleles, on the Israeli breeding index were 0.81 for ABCG2 and 0.10 for DGAT1. The two QTL were analyzed separately and jointly. In the latter case, two QTL effects were included in Model 2. QTL effects on milk, fat, and protein yield were computed separately for each trait. The cow and residual variances were both assumed to equal 0.5 for all three milk production traits. Effects for fat percentage were derived as follows:

where Q FP, Q F, and Q M are the QTL substitution effects for fat percentage, fat yield, and milk; and M F, M M, and M FP are mean adjusted first parity fat yield, milk, and fat percentage of cows born in 2000. QTL effects for protein percentage were computed similarly with protein yield and percentage, instead of fat yield and percentage.
Results
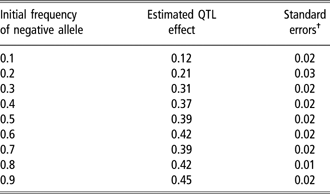
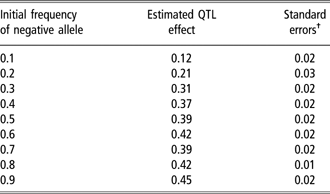
Model 1 QTL effect estimates are given in Table 1. The QTL effect was underestimated in all simulations, and was significantly different from the simulated value of 0.5, based on a t-test. Since there is selection for the ‘positive’ allele, the frequencies of the two alleles in the population after five generations of selection are closest to equality when the initial frequency of the negative allele is high. Bias is greatest when the initial frequency of the negative allele is low. In this case after five generations of selection the frequency of the negative allele is reduced to nearly zero. Since the negative allele becomes very rare in the population due to selection, it is difficult to accurately estimate the QTL effect. This is also reflected in the higher s.e. among the simulations in this case.
Effect of allele frequencies on the estimate of QTL substitution effectFootnote *
QTL=quantitative trait locus.
* The simulated QTL effect = 0.5.
† Standard errors were computed from the standard deviations among the 10 simulations for each set of initial values.
Bias also increased with the number of generations included in the simulations (data not shown). These results conform to the results of Weller et al. (Reference Weller, Golik, Seroussi, Ezra and Ron2003) for analysis of DGAT1. Thus, bias increases as a function of the deviation of the allelic frequencies from equality, and as a function of the number of generations included in the analyses. These results are in accordance with the hypothesis that bias is due to confounding between the inferred QTL genotype and the relationship matrix. Apparently, as the fraction of animals with inferred genotypes increases, the genotype probabilities computed for these individuals tend to ‘mimic’ the effect of relationships. In the extreme case of no known genotypes, the genotypes of all individuals would be inferred by the same principles used to construct the relationship matrix.
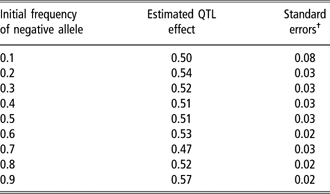
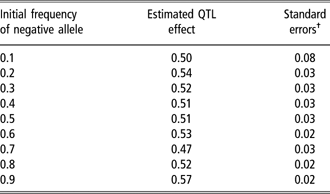
Results of the Model 2 QTL effect estimates as a function of initial QTL allelic frequencies, and their s.e. are presented in Table 2. Estimates of the QTL effect were nearly unbiased for all initial QTL frequencies. The mean estimate was not significantly different from the simulated value of 0.5 by t-test for all initial frequencies of the negative allele, except for 0.9. As expected, the s.e. increased with reduction of the initial frequency of the negative allele, the allele whose frequency decreases during selection.
Estimation of QTL substitution effects from the cow modelFootnote *
QTL=quantitative trait locus.
* The simulated QTL effect = 0.5.
† Standard errors were computed from the standard deviations among the 10 simulations for each set of initial values.
Correlations between ‘adjusted’ and standard EBV for cows with records and their sires were very close to unity, but regression of adjusted EBV on the standard AM EBV was greater than unity. Correlations between simulated genetic values and genetic evaluations, and regressions of simulated values on genetic evaluations are given in Table 3, and s.e. are also presented. Although the regressions of simulated genetic values on evaluations were close to the expected value of unity for both models for both bulls and cows, all the regressions were significantly different from this value based on the s.e. values, except for the bulls in the adjusted model. In this model, the regression for the cow evaluations were slightly greater than unity, while the regression from the standard model was slightly less than unity.
Correlations (±standard errors) between simulated genetic values and genetic evaluations, and regressions (±standard errors) of simulated values on genetic evaluationsFootnote *

AM=animal model.
* Means of 10 simulations. Standard errors were computed from the standard deviations among the 10 simulations.
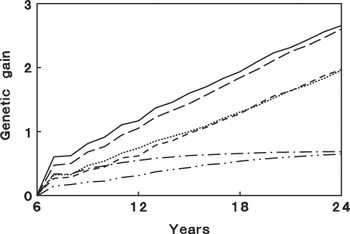
Genetic trends for total genetic gain, polygenic gain, and gain in the QTL effect from year 6 to year 24, approximately five generations of selection are presented in Figure 1. Values prior to year 6, in which the first genetic evaluations are computed, are not presented, because there was no genetic gain until then. The curves represent the means of all 10 simulations for each selection scheme. The trends in the simulated values are given, although the EBV trends are nearly identical. The mean annual genetic gain from year 10 through 30 was ~0.1 s.d. for both schemes, similar to values found in previous simulations (Nicholas and Smith, Reference Nicholas and Smith1983). As expected, slightly greater genetic progress is obtained by traditional selection for the polygenic effect until year 15, because less selection intensity is applied to the QTL effect. The QTL and the polygenic effects can be considered a two-trait breeding objective. If greater selection pressure is applied to the QTL in the MAS scheme, then selection for the polygenic effect should be slightly less. After year 20, greater genetic progress is obtained by MAS, apparently because from this point onward the assumed variance components for the standard AM selection scheme are no longer correct. This scheme assumed an additive genetic variance of 0.375 throughout. Greater genetic progress for the QTL effect is obtained for the MAS scheme. Since the initial frequency of the positive QTL allele is 0.3, maximum obtainable progress for the QTL is 0.7, and this value is approached for the MAS scheme by year 24. Therefore the figures were truncated at this point. Total genetic gain was greater for the MAS scheme. The difference in genetic trends increased until year 11 and then decreased. At year 10, total genetic gain was 0.15 s.d. greater by MAS, but was only 0.05 by year 24. Even at year 30 the MAS scheme is still higher than the traditional scheme. Thus genetic gain with trait-based selection did not surpass MAS over the long-term as noted by Gibson (1994). The ‘Gibson effect’ was also not detected by de Koning and Weller (Reference de Koning and Weller1994) in a series of long-term MAS simulations. The gain of 0.15 by MAS at year 10 represents an increase of nearly 20% over the traditional scheme. Alternatively, we note that the s.d. for milk production of Israeli Holsteins is 1400 kg. Thus, advantage of the MAS scheme is 210 kg at year 10.
Total and polygenic genetic gain and genetic gain in mean quantitative trait locus (QTL) value as a function of year of simulation. Total genetic gain: ——, standard animal model (AM); ——, modified AM. Polygenic genetic gain: ···, standard AM; - - -, modified AM. QTL genetic gain: — · · —, standard AM; — · —, modified AM.

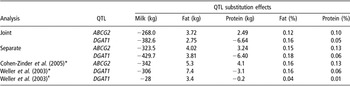
Results for analysis of actual data in the Israel Holstein population with respect to QTL effects are presented in Table 4. Results obtained for both QTL were similar to the estimates derived from the analysis of bulls’ AM breeding values, which can be considered nearly unbiased (Weller et al., Reference Weller, Golik, Seroussi, Ezra and Ron2003; Cohen-Zinder et al., Reference Cohen-Zinder, Seroussi, Larkin, Loor, Everts-van der Wind, Lee, Drackley, Band, Hernandez, Shani, Lewin, Weller and Ron2005), even though frequencies of one allele were very low, and only a miniscule fraction of the population was genotyped. The Model 1 estimates for DGAT1 derived by Weller et al. (Reference Weller, Golik, Seroussi, Ezra and Ron2003) are also listed, and these values are much lower than either the Model 2 estimates or the estimates derived by the regression of the bulls’ EBV on their DGAT1 genotypes. Model 2 effects were slightly greater when each locus was analyzed separately.
Results for analysis of actual data in Israeli Holstein population

QTL=quantitative trait locus.
*Effects on bulls’ breeding values, ~350 bulls.
†Effects derived by the method of Israel and Weller (Reference Israel and Weller1998).
Discussion
The following dairy cattle breeding schemes that incorporate MAS have been proposed in the literature:
(a) A standard progeny test system, with information from genetic markers used to increase the accuracy of sire evaluations in addition to phenotypic information from daughter records (Meuwissen and van Arendonk, Reference Meuwissen and Van Arendonk1992).
(b) A multiple ovulation and embryo transfer (MOET) nucleus breeding scheme in which marker information is used to select sires for service in the MOET population, in addition to phenotypic information on half-sisters (Meuwissen and van Arendonk, Reference Meuwissen and Van Arendonk1992).
(c) Progeny test schemes, in which information on genetic markers is used to preselect young sires for entrance into the progeny test (Kashi et al., Reference Kashi, Hallerman and Soller1990; Mackinnon and Georges, Reference Mackinnon and Georges1998).
(d) Selection of bull sires without a progeny test, based on half-sib records and genetic markers (Spelman et al., Reference Spelman, Garrick and van Arendonk1999).
(e) Selection of sires in a half-sib scheme, based on half-sib records and genetic markers (Spelman et al., Reference Spelman, Garrick and van Arendonk1999).
The current study is similar to the last scheme, but differs in that both young sires and sires with progeny tests are selected as sires, based on their total EBV, including the QTL effect. This scheme should therefore be the most efficient scheme within the context of the assumed biological constraints. The expected gain of 20% in the rate of genetic increase can justify a very large expense in genotyping costs. Genetic gains are cumulative and permanent, while costs are not. Therefore with a profit horizon of 20 years, and a discount rate of 8%, a MAS breeding program will be economically viable even if nominal genotyping costs are three times the nominal value of the added genetic gain (Weller, Reference Weller1994).
Meuwissen and VanArendonk (Reference Meuwissen and Van Arendonk1992) found that inclusion of marker information to increase the accuracy of sire evaluations increased the rate of genetic gain by only 5% when the markers explained 25% of the genetic variance. This result is not surprising, considering that the accuracy of sire evaluations based on a progeny test of 50 to 100 daughters is already quite high. In ‘open’ and ‘closed’ nucleus breeding schemes, rates of genetic gain were increased by 26% and 22%, respectively. The advantage of MAS in this case is greater, because young sires are not progeny tested, and their reliabilities based only on half-sib information are much lower.
Mackinnon and Georges (Reference Mackinnon and Georges1998) proposed the ‘top-down’ and ‘bottom-up’ strategies to apply preselection of young sires prior to the progeny test. This study and Kashi et al. (Reference Kashi, Hallerman and Soller1990) assumed that preselection of young sires was based only on genotypic information. Thus only sires with the desired genotypes were selected regardless of their breeding values for the remainder of the genome. Kashi et al. (Reference Kashi, Hallerman and Soller1990) estimated that rates of genetic gain could be increased up to 30% by a similar scheme. However, Brascamp et al. (Reference Brascamp, van Arendonk and Groen1993) noted that Kashi et al. (Reference Kashi, Hallerman and Soller1990) did not account for the expected differences among the polygenic component of the EBV of candidate bulls. Furthermore, Kashi et al. (Reference Kashi, Hallerman and Soller1990) did not account for the reduction in selection intensity expected along the dam-to-son path if many more bulls are considered as candidates a priori. As shown by Mackinnon and Georges (Reference Mackinnon and Georges1998), this reduction is significant.
Spelman et al. (Reference Spelman, Garrick and van Arendonk1999) assumed that only bulls were genotyped, but once genotyped, the information on QTL genotype and effect was known without error. It was then possible to conduct a completely deterministic analysis. Even without MAS, a slight gain is obtained by allowing young sires to be used as bull sires, and a genetic gain of 9% is obtained if young sires with superior evaluations are also used directly as both sires of sires and in general service. If young sires are selected for general service based on known QTL, the rate of genetic progress can be doubled. The maximum rate of genetic gain that can be obtained in an ‘all bulls’ scheme is 2.2 times the rate of genetic gain in a standard progeny test.
Two ongoing MAS programs in dairy cattle have been reported so far, in German and French Holsteins (Bennewitz et al., 2003 and Reference Bennewitz, Reinsch, Reinhardt, Liu and Kalm2004; Guillaume et al., Reference Guillaume, Fritz, Boichard and Druet2008). In both schemes, only bulls and bull dams are genotyped. Genetic evaluations computed by a modification of the method of Fernando and Grossman (Reference Fernando and Grossman1989) are distributed to the Holstein breeders, who can use these evaluations for selection of bull dams and preselection of sires for progeny testing. The evaluation algorithms only include equations for bulls and bull dams, and the dependent variable is the bull’s daughter yield deviation. Thus genetic evaluations are not computed for young sires without daughter records.
The proposed method for QTL estimation is the only method shown by simulation to yield unbiased estimates of QTL effects. Israel and Weller (Reference Israel and Weller1998) demonstrated that estimates of QTL effects derived by analysis of EBV, daughter yield deviations of sires, or yield deviations of cows all result in biased estimates. Furthermore, the proposed method is the only one that can use both genotypes of cows and sires to estimate QTL effects.
The proposed method is easy to apply, and all required software are ‘on the shelf.’ It is only necessary to genotype males, which are a very small fraction of the entire population. In the simulated populations it was assumed that all young bulls were genotyped for the QTL, but in practice it will only be necessary to genotype those bulls with high EBV for the polygenic component, i.e. progeny of elite cows. The method is flexible with respect to the model for general genetic evaluation, single-trait AM, multitrait AM, etc. Unlike the model of Fernando and Grossman (Reference Fernando and Grossman1989) any number of genetic markers can be easily incorporated into the algorithm. Similarly, unlike the proposed algorithms of Mackinnon and Georges (Reference Mackinnon and Georges1998) this algorithm does not require selecting young bulls with the positive genotype for all markers, and QTL and polygenic effects are weighted in accordance with the selection index theory.
The method was tested for a QTL with a substitution effect of 0.5. The genome scans that have been completed demonstrate that numerous QTL of this magnitude or greater are segregating in commercial dairy cattle populations (Weller, Reference Weller2007), although most QTL that have been detected are apparently of smaller magnitude (Weller et al., Reference Weller, Shlezinger and Ron2005). As noted previously, the variance due to a segregating QTL with two alleles can be computed as 2pq(a)2, with all terms as defined previously. Thus, if the allelic frequency of the less-frequent allele is <0.3, a QTL of this magnitude will account for no more than 10% of the phenotypic variance. New results demonstrate that the ‘cow model’ was also able to accurately estimate the effect of a QTL with a substitution effect of 0.32 standard deviations (Baruch and Weller, Reference Baruch and Weller2008).
Recently, whole-genome scans with dense single nucleotide polymorphism (SNP) maps have been completed for cattle populations in Australia (MacLeod et al., 2006) and the US and Canada (Schnabel et al., 2008), and methods have been proposed to select bulls directly on SNP genotypes without progeny testing (reviewed by Goddard and Hayes, Reference Goddard and Hayes2007). They propose that the ideal method to estimate the breeding value from genomic data is to calculate the conditional means of breeding values given the genotype of the animal at each QTL. The major difficulty is that, for the near future at least, the amount of marker data available on each animal will be highly variable, with most animals having none. They suggest three methods to calculate genetic evaluations in this case.
(a) To calculate traditional EBV and genomic EBV from markers separately, and then combine the two by the selection index theory.
(b) To infer marker genotypes for all animals and use these to calculate genomic EBV.
(c) To absorb the equations for animals that were not genotyped.
The method proposed in this study is an extension of the second method that accounts for the fact that genetic evaluations based on inferred genotypes will be biased, if a model similar to Israel and Weller (Reference Israel and Weller1998) is used.
MAS algorithms based on insemination of all cows by young sires without progeny tests may meet farmer opposition, although this problem can be overcome by farmer education. For example, in April, 2008, the Animal Improvement Programs Laboratory released genomic predictions of genetic merit of bull calves based on the DNA of 5285 proven Holstein bulls (VanRaden et al., 2008).
In the current study, only single-trait selection was simulated. Further studies will consider the application of the proposed method to multiple QTL, QTL of smaller magnitudes, and selection for a multitrait selection index.
Conclusions
Estimates of QTL effects derived from the model of Israel and Weller (Reference Israel and Weller1998) are biased, apparently due to confounding between the inferred genotypes and the relationship matrix. Unbiased estimates of QTL effects were derived by a ‘cow model’ without relationships even though only a small fraction of the population was genotyped. An efficient algorithm for MAS in dairy cattle is presented, and tested for a QTL with a substitution effect of 0.5 phenotypic standard deviations. At year 10, total genetic gain was 20% greater by MAS as compared to standard AM. The proposed method is easy to apply, and all required software are ‘on the shelf.’ It is only necessary to genotype males, which are a very small fraction of the entire population. The method is flexible with respect to the model for general genetic evaluation, single-trait AM, multitrait AM, etc. Any number of genetic markers can be easily incorporated into the algorithm.
Acknowledgments
This research was supported by grants from the Israel milk marketing board and the European Sixth Research and Technological Development Framework Programme, Proposal no. 016250-2 SABRE. We thank M. Golik and M. Cohen-Zinder for providing the DGAT1 and ABCG2 data analyzed.