INTRODUCTION
Differences in fitness maximizing strategies of the sexes follow from fundamental asymmetry in allocation of resources to reproduction, thus conflicts of interest concerning mating decisions are unavoidable (Chapman et al., Reference Chapman, Arnqvist, Bangham and Rowe2003; Fricke et al., Reference Fricke, Perry, Chapman and Rowe2009). As a result of interactions characterized by conflict, males and females are expected to evolve suites of sexually antagonistic adaptations that favour their own interests (Rice & Holland, Reference Rice and Holland1997; Holland & Rice, Reference Holland and Rice1998; Chapman et al., Reference Chapman, Arnqvist, Bangham and Rowe2003).
Intersexual antagonistic coevolution is thought to be particularly strong in sexual organisms with a promiscuous mating system and internal fertilization (Rice, Reference Rice, Howard and Berlocher1998). Thus a three-way interaction is expected with male insistence, female resistance and male defence by limiting or inhibiting female remating (Eberhard, Reference Eberhard1996; Rice & Holland, Reference Rice and Holland1997; Rice, Reference Rice, Howard and Berlocher1998). Conflict then might influence mate choice, resistance, mating duration, mating rate, pre-copulatory or post-copulatory guarding and fertilization processes across a wide range of taxa (Arnqvist & Rowe, Reference Arnqvist and Rowe2005) including molluscs (Michiels, Reference Michiels, Birkhead and Möller1998; Chase, Reference Chase2002).
In the Neptune whelk, Neptunea arthritica (Bernardi), reproduction presumably imposes high costs to females due to reduced feeding opportunities, differential investment in gametes, egg capsules and embryonic allotments alongside predation risk during oviposition (Parker, Reference Parker, Krebs and Davies1978; Martel et al., Reference Martel, Larrivée and Himmelman1986; Rowe, Reference Rowe1992; Rowe et al., Reference Rowe, Arnqvist, Sih and Kruppa1994; Brokordt et al., Reference Brokordt, Guderley, Guay, Gaymer and Himmelman2003; Ilano et al., Reference Ilano, Fujinaga and Nakao2004). Males force mating, while females exhibit resistance by escape, pushing, biting and/or body swinging against copulation attempts as well as during intromission (Miranda et al., Reference Miranda, Lombardo and Goshima2008a).
Conflict can arise when male and female optimal copula duration and frequency do not coincide (Arnqvist & Rowe, Reference Arnqvist and Rowe2005). Although, the functional role of female resistance is difficult to establish (Arnqvist, Reference Arnqvist1992; Anderson, Reference Anderson1994; Gavrilets et al., Reference Gavrilets, Arnqvist and Friberg2001; Arnqvist & Rowe, Reference Arnqvist and Rowe2005), in Neptunea arthritica, resistance might be an indicator of such disparity. Since during copula females are restrained by males, lengthy interactions might be costly for females (Parker, Reference Parker, Krebs and Davies1978; Martel et al., Reference Martel, Larrivée and Himmelman1986; Rowe, Reference Rowe1992; Jivoff, Reference Jivoff1997; Jormalainen, Reference Jormalainen1998; Brokordt et al., Reference Brokordt, Guderley, Guay, Gaymer and Himmelman2003; Ilano et al., Reference Ilano, Fujinaga and Nakao2004). Thus, conflict may possibly stem from a ‘power asymmetry’ in which individuals of one sex could sequester control over some aspects of mating to the detriment of the opposite sex.
Body size is broadly correlated with mating success (Trivers, Reference Trivers and Campbell1972; Parker, Reference Parker and Bateson1983) and it is an easily measured character which can influence the physical interaction of insistence–resistance–defence in the conflict over reproductive decisions. Thus, the aim of this study was to revisit the mating behaviour of Neptunea arthritica and analyse the outcome of copula trials with regards to size differences between the sexes and the effect of female resistance in the context of intersexual conflict.
MATERIALS AND METHODS
Individuals above the size at first sexual maturation, 60 and 75 mm in shell length for males and females, respectively (Fujinaga, Reference Fujinaga1985; Miranda et al., Reference Miranda, Fujinaga and Nakao2008b) were selected and sexed at Kikonai, Hokkaido in February and October 2008. Indelible ink was used to mark the shell of all whelks according to sex and assigned an identity number while simultaneously measuring shell length (SL) with a digital calliper (accuracy 0.1 mm). Male and female whelks were kept separately in tanks with running seawater and fed (ad libitum) once every week with a mixed diet of fish (Cololabis saira Brevoort and Paralichthys olivaceus Temminck & Schlegel), mussels (Mytilus galloprovincialis Lamarck) and scallops (Mizuhopecten yessoensis Jay).
The mating behaviour of Neptunea arthritica was recorded during May to July 2008 and 2009 at Hokkaido Corporation for Aquaculture Promotion, ‘Shikabe Branch’ and Usujiri Marine Research Station, ‘Hokkaido University’, respectively. Male and female body size, female resistance, copulatory status and mating rate were manipulated in a series of copula trials, where males and females interacted inside 18 l plastic tanks with slow circulating seawater flow. Intact and active whelks were selected to participate in all trials to avoid low motivation confounding effects.
Body size
Male and female body size was manipulated in three combinations. First trials consisted of two large females (X ± SD = 86.4 ± 6.3 mm SL) and a small male (79.3 ± 6.3 mm SL) ((F > M); two-sample t-test: t 97 = 5.46, P < 0.001). Second, large male (89.1 ± 7.3 mm SL) and two small females (79.7 ± 2.7 mm SL) ((M > F); two-sample t-test: t 61 = 8.63, P < 0.001) and the third combination consisted of all similar size whelks, one male (80.4 ± 2.8 mm SL) and two females (80.2 ± 3.4 mm SL) ((M = F); two-sample t-test: t 94 = 0.27, P = 0.785). Two females per trial were used to increase the chances of copula. When copula occurred, the other female in the pair was removed and re-tested in separate trials. If copulation did not occur, whelks were re-tested once more after three days in subsequent trials and distributed to avoid repeated interactions.
The beginning of copula was determined after the male achieved intromission and duration was measured with a chronometer until penis withdrawal. Copula trials were run for three hours. Once a pair had engaged copula it was never interrupted and if copula continued over the time limit, it was allowed to carry on aiming to document any post-copulatory interaction. When a male copulated within the time limit, observations continued until the end of the three-hour trial. The objective of this experiment was to determine the effect of male body size on the ability to overcome resistance and copula extension. Female size and resistance ability were also analysed.
We predict a large body size advantage for extended copulas in males. Large females are expected to be in advantage to reject males or condense copula duration. Intermediate duration is anticipated in a similar size group. Rejected (R) to non-rejected (NR) male proportion was recorded. Following Miranda et al. (Reference Miranda, Lombardo and Goshima2008a), male whelks were considered as R while attempting copula, aborting further approach or withdrawing into its shell after mounting and/or during intromission, a product of female resistance. Males that could overcome resistance and finish intromission by their own timing were recorded as NR. For the sake of simplicity, in the following sections, we focused on biting as the main resistance response by females.
Additionally a test for male mate size preference was performed using copulated females (CF) from previous trials to eliminate confounding effects of male mating bias towards CF (Miranda et al., Reference Miranda, Lombardo and Goshima2008a) or pheromone mediated attractiveness (Martel et al., Reference Martel, Larrivée and Himmelman1986; Chase, Reference Chase2002; Ilano et al., Reference Ilano, Fujinaga and Nakao2004). Trials consisted of one non-copulated male (NCM) with a pair of CF. Size differences between CF with equivalent number of copulas and duration were manipulated so that, in each trial, one of the CF in the pair was larger (81.0 ± 3.9 mm SL small and 91.1 ± 6.7 mm SL large; two-sample t-test: t 37 = 6.39, P < 0.001). The male (82.7 ± 2.3 mm SL) and smaller female were roughly similar in SL (two-sample t-test: t 37 = 1.82, P = 0.076). Male mate choice was scored taking into account approach followed by mounting and/or failed intromission attempts as well as successful copula as male choice criteria for a particular female within each trial. After copula, whelks were excluded from further testing.
Differences in morphometry and copula duration between groups were tested using the t-test or ANOVA when appropriate along with Tukey's multiple comparison tests to identify differences among groups. The relationship between copula duration and individual size was explored with the simple linear regression. The proportion of R and NR males through copulation trials and male size was evaluated with the Chi-square test (χ2) of independence. Male preference on female size was examined with the binomial test.
Female resistance
We foresee an increase of resistance or rejection of males with increasing amount of copulas. On the other hand, if males are able to overcome resistance, then, a drop in resistance could be expected with increasing copula duration. We predict that ‘natural’ copula trials will result in contrasting duration differences compared to ‘intervened’ trials.
NATURAL TRIALS
The effect of female whelk copulatory status on resistance expression was analysed in trials where the number of copulas by females increased. The first trials incorporated one large NCM (93.0 ± 5.3 mm SL) along with two size matched non-copulated females (86.7 ± 7.6 mm SL). Two females were used to increase the chances of copula, however after the male had made its choice, the other was removed and reused in subsequent trials. When females copulated, they were re-tested in consecutive trials organized correspondingly towards second and third copula with a resting period of one hour between each copula. For each trial females were paired with one NCM without previous interaction. Trials continued until each female had copulated three times with different males. Copula duration, resistance-time intervals, their frequency and R to NR male proportion were recorded and analysed with one-way ANOVA using the number of consecutive copulas as categories. The Tukey's multiple comparison test was performed to analyse among group differences. The proportion of R and NR males through copula trials was evaluated with the Chi-square test (χ2) of independence.
INTERVENED TRIALS
Each female was allowed a resting period of three days, after which, the same female whelks participated in trials toward their fourth copula. Resistance was removed successfully by gently pricking the foot and/or proboscis of females, using fine plastic forceps during critical stages of interaction (approach, mounting and intromission) allowing males to end copulas at their timing. Females responded by withdrawing, halting resistance temporarily, while males were not significantly disturbed by the practice.
Non-copulated males (82.3 ± 3.8 mm SL) without previous participation were used and pairing was random by size. Copula duration and resistance frequency were recorded. Copula duration between natural and intervened trials was assessed with one-way ANOVA and Tukey's test. Frequency was categorized depending on occurrence within copulas (first half and second half) to test for change in resistance during extended copula with a paired t-test.
RESULTS
Body size
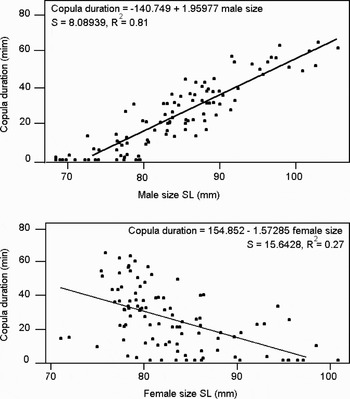
The proportion of R to NR males (44/6, F > M), (3/47, M > F) and (40/10, M = F), indicated that male size and their ability to overcome resistance were associated (χ2 = 83.9, df = 2, P < 0.05). In general, an increase in copula duration was detected as males were increasingly larger than females (F 1,89 = 408.5, P < 0.005, R 2 = 0.81), while the opposite occurred with increasing female size (F 1,89 = 37.45, P < 0.005, R 2 = 0.27) (Figure 1).
Neptunea arthritica male and female copula duration and body size regression plots.

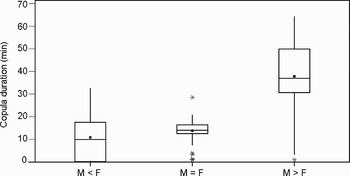
Whelk size had a significant effect in copula duration (one-way ANOVA: F 2,147 = 100.98, P < 0.005). When copulation trials were dominated by largest males, they were able to extend copulas (37.79 ± 14.35 minutes), whereas if females had size advantage, copulas resulted shorter (10.73 ± 9.83 minutes). However, when size asymmetry was neutralized, males were not able to copulate significantly longer (13.66 ± 5.01 minutes, Tukey's test: P > 0.05) (Figure 2).
Box plot of copula duration and categorized (M, male and F, female) body size difference combinations (x axis). Whiskers represent each 25% of data and box accounts for 50%. Solid dot is the mean, and horizontal line across the box is the median. Asterisks correspond to outliner points.

When given the option, males choose large females in a significantly higher frequency (38/45 trials) over small ones (binomial test, N = 45, z = 4.62, P < 0.005). Copula duration did not differ considerably (13.13 ± 7.33 minutes) from the previous trials where females had body size advantage (two-sample t-test: t 94 = 1.52, P = 0.132).
Female resistance
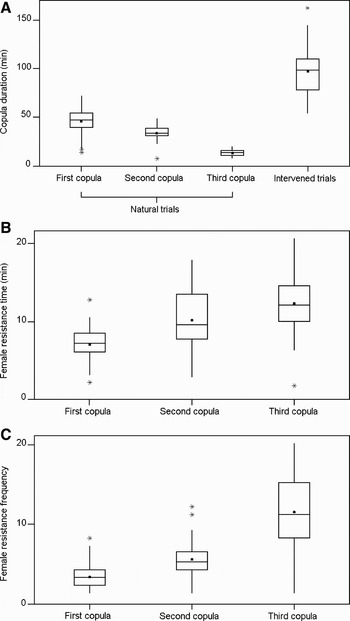
In natural settings, female whelk copulatory status had a significant effect on copula duration (one-way ANOVA: F 2,135 = 167, P < 0.05) (Figure 3A). The first copula reached 43.81 ± 12.78 minutes, second, 31.50 ± 7.23 minutes and the third copula duration had a drastic reduction extending 11.03 ± 3.19 minutes (all three comparisons, Tukey's test: P < 0.05). Female copulatory status had an effect on resistance expression (one-way ANOVA: F 2,135 = 30.95, P < 0.005). A general increased trend in resistance was found when females employed 6.69 ± 2.12 minutes in resisting during first copula, 9.81 ± 3.84 minutes in the second and 11.97 ± 3.49 minutes in the third copula (Figure 3B). The total increase in resistance was notable since females in their third copula resisted nearly throughout the interaction even after intromission ended (first versus third copula Tukey's test: P < 0.05). The frequency of resistance bouts showed a parallel increase (one-way ANOVA: F 2,135 = 89.45, P < 0.05), particularly for females in the third copula (11 ± 4 bouts) (all three comparisons, Tukey's test: P < 0.05) (Figure 3C). The proportion of increase in R to NR males in first (7/39), second (31/15) and third trials (37/9) was also associated with female copulatory status (χ2 = 44.16, df = 2, P < 0.05).
Box plot of copula duration in consecutive copulas of Neptunea arthritica from natural and intervened trials (A); female resistance time length (B); female resistance frequency as biting bouts per copula (C) from females in natural trials. Each whisker represents 25% of data and box accounts for 50%. The solid dot is the mean, and horizontal lines across the box represent the median. Asterisks correspond to outliner points.

When resistance was removed in the same group of females, copula duration augmented (95.7 ± 23.4 minutes) in contrast with all three previous copulas from natural trials (one-way ANOVA: F 3,180 = 308.87, P < 0.05) (Figure 3A). During the first half of matings 16 ± 5 resistance bouts were observed against 6 ± 4 towards the end of such long copulas (paired t-test: 95% CI for mean difference = 7.62–11.17, t = 10.66, P < 0.005). Finally, postcopulatory guarding was observed in 63% of trials, sometimes extending for as long as 8 hours. Male whelks remained on top and/or flipped the female shell, exposing the aperture and biting in response to female attempts to resume normal activity.
DISCUSSION
Size asymmetry predicted the outcome of copula duration to favour the largest sex in the trials where body size was manipulated. The proportion of R to NR males indicated that male size and ability to overcome resistance were associated. Conversely, with increasing female size, copula duration decreased suggesting a link between female size and their overall resistance ability (Weigensberg & Fairbairn, Reference Weigensberg and Fairbairn1996). However, when males and females were similar in size, copula duration did not change significantly, pointing to the possibility that female size and their ability to resist mating or condense copula duration is not strictly dependent on body size. Furthermore, large male body size predicts, for example, a male's fighting ability during male–male contests and leads to a higher mating success or mating frequency in many species (Johnstone, Reference Johnstone1995). In addition, mating duration for males is an important determinant of sperm competition success as fertilization success increases with copula duration (Parker, Reference Parker, Krebs and Davies1978, Reference Parker and Smith1984, Reference Parker, Birkhead and Möller1998). Thus it is not surprising to see a strict relationship between copula duration and body size in Neptunea arthritica males.
Males chose large females in a significantly higher frequency over small ones indicating male capacity to discriminate female size and a benefit from attempting copula with large females (Erlandsson & Johannesson, Reference Erlandsson and Johannesson1994; Tomiyama, Reference Tomiyama1994, Reference Tomiyama1996; Zahradnik et al., Reference Zahradnik, Lemay and Boulding2008), even though large females represented a higher rejection risk for males in this study. This suggests that the benefits from mating with large females (e.g. the opportunity to fertilize more eggs, higher quality eggs or both) might offset the risk of failure against resistance. A significant relationship has been reported between female shell length, egg mass height, egg capsule length and hatchling length in Buccinum isaotakii and Neptunea arthritica (Ilano et al., Reference Ilano, Fujinaga and Nakao2004; Miranda, Reference Miranda2008). Thus overall higher fertility seems to explain male preference for large females.
In Neptunea arthritica, female reluctance to copulate suggests intense sexual conflict. In this study, female whelks showed resistance in all trials independent of male size, prior to and during copula. Once size advantage was in favour of males, copula duration increased, and when resistance was removed, copula duration augmented in contrast with all three previous copulas from natural trials suggesting conflict over copula duration and frequency. Females in consecutive copulas (natural trials) progressively reduced mating duration, which was accompanied by a dramatic increase in female resistance intensity and frequency. Since females terminated mating, male effects from mating bias due to sperm competition risk or overall female condition (Zahradnik et al., Reference Zahradnik, Lemay and Boulding2008) can be excluded as a causative factor for such trend. All the above is indicative that perhaps, copula duration tends to the female optima through resistance expression.
Furthermore, female resistance is known to be condition dependent and may vary with copulatory status, where virgin or male deprived females are less choosy than mated ones, whereas already mated females resist mating vigorously (Halliday, Reference Halliday and Bateson1983; Gabor & Halliday, Reference Gabor and Halliday1997; Ortigosa & Rowe, Reference Ortigosa and Rowe2003; Arnqvist & Rowe, Reference Arnqvist and Rowe2005). In our study, female copulatory status had a significant effect on copula duration (decrease), resistance expression (increase), frequency of resistance bouts (increase) and proportion of R to NR males (increase) through first, second and third copula trials. This supports the hypothesis that female resistance is reflective of conflict. Moreover, it is likely that females avoid sperm depletion and also avoid costs stemming from excessive mating beyond optima through increasing resistance expression (Rowe et al., Reference Rowe, Arnqvist, Sih and Kruppa1994; Weall & Gilburn, Reference Weall and Gilburn2000; Schäfer & Uhl, Reference Schäfer and Uhl2002; Wedell et al., Reference Wedell, Gage and Parker2002; Ortigosa & Rowe, Reference Ortigosa and Rowe2003).
Resistance has potential to generate non-random mating and might contribute to variance in male mating success imposing sexual selection on male traits (Westneat et al., Reference Westneat, Sherman and Morton1990; Wiley & Poston, Reference Wiley and Poston1996; Jormalainen, Reference Jormalainen1998; Gavrilets et al., Reference Gavrilets, Arnqvist and Friberg2001; Cothran, Reference Cothran2004). However, in the light of current theoretical and empirical evidence (Arnqvist, Reference Arnqvist1992; Arnqvist & Rowe, Reference Arnqvist and Rowe2005), ‘mate screening’ or ‘selective resistance’ seem unlikely to explain female resistance to mating. In our observations, large and small males experienced resistance equally and copula duration was a function of male ability to overcome such resistance, which varied with male body size. When resistance was manipulated, male traits important for overcoming resistance might have been exaggerated, thus females could not terminate or condense copulas, in which case further resistance might have been ineffective or costly against large or insistent males (Weall & Gilburn, Reference Weall and Gilburn2000; Thiel & Hinojosa, Reference Thiel and Hinojosa2003; Wedell et al., Reference Wedell, Kvarnemo, Lessells and Tregenza2006), and indeed a reduction in resistance frequency was observed. In the same line, a uniform increase in female resistance through consecutive copulas (natural trials) indicated no mate sampling. Therefore, sexual conflict in copula duration and frequency, derived from inherent cost asymmetries to reproduction (Rowe, Reference Rowe1992; Fricke et al., Reference Fricke, Perry, Chapman and Rowe2009; Perry et al., Reference Perry, Sharpe and Rowe2009), seem more plausible explanations for female Neptunea arthritica generalized resistance to mating. The possibility that female Neptune whelks invest more resources in reproduction than males as found in related species (Martel et al., Reference Martel, Larrivée and Himmelman1986; Brokordt et al., Reference Brokordt, Guderley, Guay, Gaymer and Himmelman2003; Ilano et al., Reference Ilano, Fujinaga and Nakao2004) further supports this notion. In such a scenario, females could obtain direct benefits from resistance by minimizing costs from mating for too long or with all encountered males and collaterally obtain indirect benefits from inheritable body size or insistence from those males capable of overcoming struggle (Rowe, Reference Rowe1992; Wiley & Poston, Reference Wiley and Poston1996; Weall & Gilburn, Reference Weall and Gilburn2000; Kokko et al., Reference Kokko, Brooks, Jennions and Morley2003; Perry et al., Reference Perry, Sharpe and Rowe2009).
Intersexual conflicts over mating decisions may have important impacts on the evolution of mating strategies (Trivers, Reference Trivers and Campbell1972; Parker, Reference Parker and Bateson1983, Reference Parker and Smith1984, Reference Parker, Birkhead and Möller1998). Male imposed costs to reproduction in Neptunea arthritica are yet to be formally studied, however it is suspected that such costs might come from sequestration of time budgets from increased mating frequency (male biased sex-ratio) and post-copulatory guarding. Male post-copulatory guarding was observed, sometimes extending for as long as 8 hours, restraining females from resuming normal activity, which may cause escalation of the conflict over duration of reproductive interactions. In Neptunea arthritica, multiple mating generates potential for sperm competition (Parker, Reference Parker, Birkhead and Möller1998; Wedell et al., Reference Wedell, Gage and Parker2002) and is probably related to the observed post-copulatory guarding behaviour (Dewsbury, Reference Dewsbury1982; Jivoff, Reference Jivoff1997; Wedell et al., Reference Wedell, Gage and Parker2002). Further studies of male imposed costs to females, sperm competition as well as paternity outcomes from controlled copula trials in Neptunea arthritica will contribute to better understand how intersexual conflict affects the evolution of mating strategies.
ACKNOWLEDGEMENTS
Our gratitude goes to the staff of Hokkaido Corporation for Aquaculture Promotion, Shikabe Branch and Usujiri Marine Research Station, Hokkaido University for hosting our project and also Dr Wada Satoshi and Dr Takeshita Fumio for their constructive critique and interesting discussions. We also thank the anonymous referees for their comments which helped to improve the manuscript.