INTRODUCTION
The structure of fish communities is dependent on resource partitioning (Ross, Reference Ross1986). Within a system, the coexisting species share available resources, such as food and habitat (Pianka, Reference Pianka1969). Trophic segregation can play an important role in structuring and partitioning fish assemblages, as food availability is a major regulator of the system (Ross, Reference Ross1986). An improved knowledge of the feeding habits (diet and behaviour), trophic relationships (niche definition and predator/prey interactions) and species functional roles is, therefore, important to describe or model marine ecosystems (e.g. Macpherson, Reference Macpherson1981; Elliott et al., Reference Elliott, Hemingway, Costello, Duhamel, Hostens, Labropoulou, Marshall, Winkler, Elliot and Hemingway2002; Metcalf et al., Reference Metcalf, Dambacher, Hobday and Lyle2008).
Awareness of the limitations of a single-species approach to fisheries management has led to global acceptance of the need to adopt a wider ecosystem approach to fisheries (EAF) assessment and management (Garcia et al., Reference Garcia, Zerbi, Aliaume, Do Chi and Lasserre2003). In order to achieve these objectives a good understanding of marine ecosystems must be obtained, especially in relation to community interactions, including predator–prey relationships in an integrated food web (Morishita, Reference Morishita2008). The implementation of the Marine Strategy Framework Directive (MSFD – 2008/56/EC) requires that important elements of marine food webs are considered in order to ensure the long-term viability of ecosystem structure. Hence, information on trophic relationships may help with implementing the MSFD.
Studies on the trophic ecology of coastal fish assemblages in Portuguese waters are limited (Cabral et al., Reference Cabral, Lopes and Loeper2002) and in most cases focused on single species research (e.g. Morato et al., Reference Morato, Santos and Andrade2000; França et al., Reference França, Vinagre, Costa and Cabral2004), with more emphasis on commercially important species (e.g. Vinagre et al., Reference Vinagre, França, Costa and Cabral2005; Garrido et al., Reference Garrido, Ben-Hamadou, Oliveira, Cunha, Chícharo and van der Lingen2008). Since data on trophic interactions are limited, the trophic structure of coastal fish assemblages is poorly understood. Studies on this subject are therefore valuable despite being, sometimes, of limited temporal and spatial coverage.
A diverse fish assemblage is present in the coastal area off Aveiro (north-western Portugal) and some species, such as Trachurus trachurus (Linnaeus, 1758) and Trisopterus luscus (Linnaeus, 1758), are very abundant, particularly during the spring/summer period, when the region is used as a nursery (Jorge et al., Reference Jorge, Siborro and Sobral2002). These species, along with Engraulis encrasicolus (Linnaeus, 1758), Sardina pilchardus (Walbaum, 1792), Scomber colias Gmelin, 1789 and Scomber scombrus Linnaeus, 1758, are targeted by beach seiners, purse seiners and trawlers that operate locally, supporting the regional economy (Jorge et al., Reference Jorge, Siborro and Sobral2002; Sobral, Reference Sobral2007).
The present work provides information on the trophic ecology of the fish assemblages in the coastal area off Aveiro and also on the feeding interactions over these nursery grounds during summer. This study was conducted to meet three objectives: (1) to describe the diet of the dominant coastal fish species during the summer; (2) to analyse ontogenic variations in diet composition; and (3) to investigate trophic relationships and niche overlap between the dominant species.
MATERIALS AND METHODS
Study area
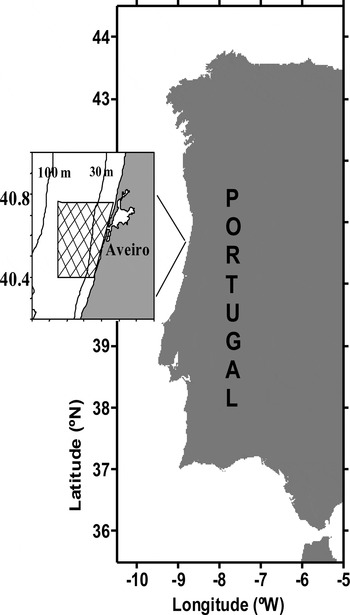
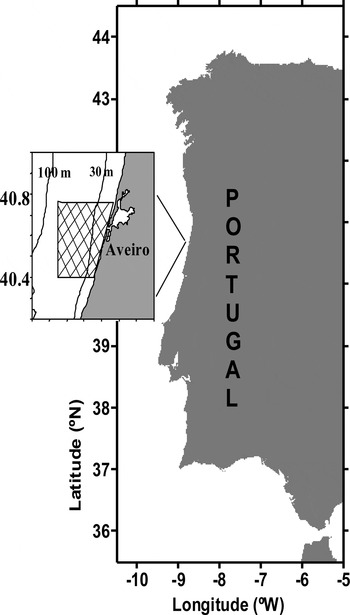
This study was carried out off Aveiro lagoon, Portugal, in an area inshore to the 100 m isobath (Figure 1). In this region, the continental shelf is relatively wide (~60 km), gently sloping with an edge defined by the 200 m contour. The sea bottom is dominated by sandy substrates with fine sand on the inner shelf (<30 m), and coarse sand and gravel on the mid-shelf (30–80 m) (Abrantes et al., Reference Abrantes, Rocha, Vidinha and Dias2005). The western coastline of the Iberian Peninsula is characterized by upwelling events during the summer months (June to October). For the remainder of the year, other processes such as a slope poleward flow and a buoyant plume become more relevant in structuring the ocean over the shelf. The coastal region is also subject to strong hydrodynamic variability associated with mesoscale structures (eddies and meanders) and transient, alongshore currents (Peliz et al., Reference Peliz, Rosa, Santos and Pissara2002, Reference Peliz, Dubert, Santos, Oliveira and Le Cann2005).
Location of the sampling area in the A veiro coastal region.
Sampling and laboratory procedures
The present study was part of a multidisciplinary campaign (NeoMAv07), including surveys for hydrology, plankton and fish. Fish sampling was conducted from 2–7 July 2007, during the morning period, using two research vessels, RV ‘Noruega’ and RV ‘Tellina’, the latter operating in shallow waters only. Fishing was carried out to better understand the distribution and trophic ecology of the dominant fish. The summer season was selected to coincide with the recruitment period for the main fish species. A total of 14 hauls were made at depths between 10 m and 70 m, nine by RV ‘Noruega’ and five by RV ‘Tellina’ using bottom trawls with ~25 mm mesh size at the cod end. All fishes were sorted by species, weighed and grouped by size-class. The most abundant and/or the economically important fish species were selected for dietary studies. However, given their strictly planktonic diet, S. pilchardus, S. colias and S. scombrus were considered in a different study (Castro, Reference Castro2008). For the selected species a random sub-sample was taken from each haul and frozen for subsequent laboratory analyses, with a maximum of 150 individuals per species. Fishes were defrosted, the total length measured to the nearest millimetre, and the stomachs and intestines were removed. Prey items were identified, using a stereomicroscope (80×), counted and weighed to the nearest 0.0001 g.
Data analysis
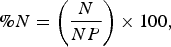
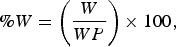
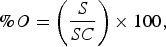
For dietary analyses, food items identified were grouped into 26 major taxonomic groups and the diet quantified using numerical (%N) and gravimetric indices (%W) and the frequency of occurrence (%O) (Hyslop, Reference Hyslop1980) defined as:
 $$ % N=\left({\displaystyle{N \over {NP}}} \right)\times 100\comma \;$$
 $$ % W=\left({\displaystyle{W \over {WP}}} \right)\times 100\comma \;$$
 $$ % O=\left({\displaystyle{S \over {SC}}} \right)\times 100\comma \;$$
where N and NP are the number of prey per group and the total number of prey, W and WP are the weight of each prey group and the total weight of prey, and S and SC are the number of stomachs and intestines with each prey group and the total number of stomachs and intestines with contents, respectively. These three indices were computed for the whole assemblage and also for each species in order to obtain a general overview of the trophic relationships in the study area. However, for simplicity, the subsequent analyses were made considering exclusively the frequency of occurrence (%O). This type of index is an adequate measurement when dealing with heterogeneous diets (Moreira et al., Reference Moreira, Assis, Almeida, Costa and Costa1992).
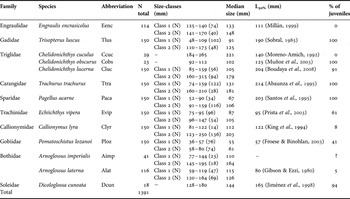
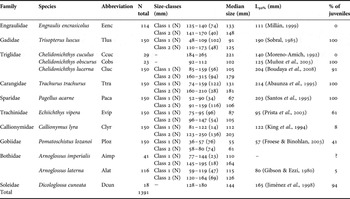
To assess diet variation with ontogeny, different size-classes were established according to the length distributions observed for each species taking into consideration the presence of different cohorts and their size at maturation (L50%), the latter obtained from the literature (Table 1). Only the 10 species with more than 40 individuals were used in this analysis: Arnoglossus imperialis (Rafinesque, 1810), Arnoglossus laterna (Walbaum, 1792), Callionymus lyra (Linnaeus, 1758), Chelidonichthys lucernus (Linnaeus, 1758), Echiichthys vipera (Cuvier, 1829), E. encrasicolus, Pagellus acarne (Risso, 1827), Pomatoschistus lozanoi (de Buen, 1923), T. trachurus and T. luscus. In the present work the nomenclature Species1 and Species2 was used to identify different size-classes, in length, in ascending order. The Spearman correlation rank test (Siegel & Castellan, Reference Siegel and Castellan1988) was used to compare diets between different size-classes, within each species.
Number of stomachs analysed, size-classes and respective sample size and median size of individuals, size at maturation (L50%) according to the literature and percentage of juveniles.
Correspondence analysis (CA) (Ter Braak & Prentice, Reference Ter Braak and Prentice1988) was applied to evaluate the trophic structure of the fish assemblage considering the untransformed prey data of all different species/size-classes. Differences in the trophic groups identified by the CA were tested using a permutation multivariate analysis of variance (PERMANOVA; Anderson, Reference Anderson2001). The PERMANOVA analyses were performed using Bray–Curtis similarity on square-root transformed data. The main test and pair-wise comparisons were conducted with unrestricted permutations of the raw data.
To measure the dietary overlap among species/size-classes, the Horn index (R) was employed according to the following formula (Krebs, Reference Krebs1989):
 $$R = {\Sigma \lpar p_{ij} + p_{ik}\rpar \ln \lpar p_{ij} + p_{ik}\rpar - \Sigma p_{ij} \ln p_{ij} - \Sigma p_{ik} \ln p_{ik} \over 2 \ln 2}$$
where p ij and p ik represent the proportion of each prey group (standardized frequency of occurrence as defined by Gunn & Milward, Reference Gunn and Milward1985) in species/size-classes j and k, respectively. This index ranges between 0 and 1 and significant dietary overlap is considered to occur when values are higher than 0.6 (Wallace & Ramsey, Reference Wallace and Ramsey1983).
RESULTS
Dominant prey
A total of 53 fish species belonging to 30 families were caught in the study. Thirteen of these species were chosen for trophic analyses, with a total of 1391 fishes examined (Table 1). The majority of the individuals were juvenile.
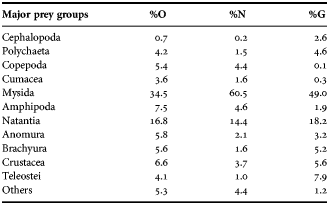
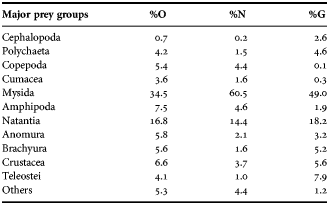
Mysids were clearly the dominant prey for the whole fish assemblage (Table 2). Mysids were present in 34.5% of the stomachs and intestines (%O), representing 60.5% of the total prey (%N) and 49.0% of the total gut contents by weight (%W). Natantids were also important prey, especially in terms of weight and occurrence (%W = 18.2%; %O = 16.8%; %N = 14.4%). Brachyurans and teleosts represented 5.2% and 7.9% of the food by weight (%W), respectively.
Importance of each major prey group for the fish assemblage total sample, considering the frequency of occurrence and the numeric and gravimetric indices (%).
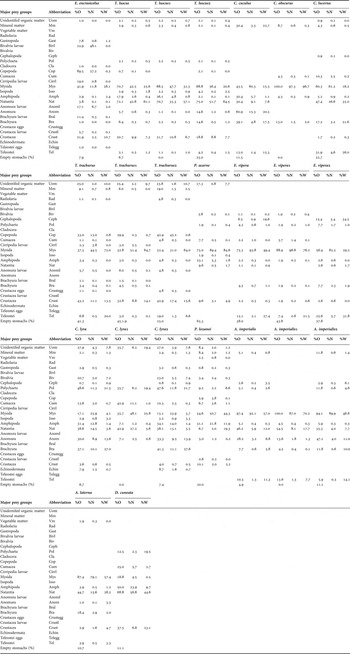
Mysids were the most important prey for A. imperialis, A. laterna, C. cuculus, C. lucerna, C. obscurus, E. vipera, P. acarne, P. lozanoi and T. trachurus (Table 3). These suprabenthic organisms were even important in the diets of E. encrasicolus and T. luscus. Natantids were the primary food item for T. luscus and Dicologlossa cuneata (Moreau, 1881), and also contributed in a large proportion to the diet of A. laterna, A. imperialis, C. lyra and C. lucerna. Infaunal and epibenthic prey, including polychaetes, amphipods, anomurans and brachyurans, played an important role in the feeding of C. cuculus, C. lyra, P. lozanoi and D. cuneata. Copepods and other pelagic prey prevailed in the stomach contents of E. encrasicolus and T. trachurus.
Diet quantitative analysis of the species and respective size-classes according to the frequency of occurrence (%O) and numeric (%N) and gravimetric (%W) indices. Reference also to the percentage of empty stomachs.
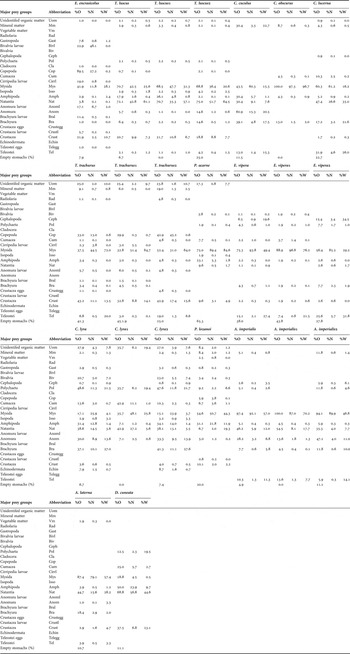
Overall, the piscivory observed in this fish assemblage was relatively low. Chelidonichthys lucerna was the species that consumed the highest proportion of teleosts, followed by E. vipera and C. cuculus. Gobies, Pomastochistus spp., were the most preyed upon fish in this assemblage.
Ontogenic changes
Five species (A. imperialis, C. lyra, E. vipera, T. trachurus and T. luscus) showed significant differences in the diet between the size-classes considered (Spearman rank correlations, P > 0.05). All the individuals of T. trachurus and T. luscus sampled were juveniles as was the case for the majority of E. vipera (61%), while adult C. lyra predominated (only 8% were juvenile) (Table 1). For A. imperialis no references to the size at maturation were found in the literature and so they were not classified accordingly.
For T. trachurus the major differences in the diet amongst size-classes were related to an increase in prey size, as well as a greater variety of food in larger juveniles. Copepods and mysids were the most important components in the diet of smaller individuals, and although these prey were still important for individuals larger than 159 mm, larger fish showed an increased predation on teleosts (Table 3). An increased size of prey in larger specimens was also found for T. luscus and E. vipera. Mysids and natantids were present in ~70% of the stomachs of both size-classes of T. luscus, but amphipods, important food for individuals smaller than 110 mm, were replaced by brachyurans and anomurans in the diet of larger juveniles. In E. vipera, the reduced consumption of mysids from juvenile to the adult phase was balanced by a higher predation on cephalopods and teleosts by the latter. Mysids were the major prey for all sizes of A. imperialis, but as fish increased in size the diet showed a reduced proportion of other suprabenthic prey, like natantids and teleosts, and more infaunal and epibenthic organisms, such as polychaetes, anomurans and brachyurans. The major differences in the diet of C. lyra of different size-classes were likely due to an increase in prey size, and in the proportion of infaunal and epibenthic organisms, ingested by adults. Natantids were important in the diet of this species throughout life. However, for larger fishes, smaller suprabenthic prey, such as cumaceans and mysids, became less important whilst infaunal and epibenthic prey (including polychaetes, amphipods, echinoderms, bivalves, anomurans and brachyurans) became important prey taxa.
Community trophic structure
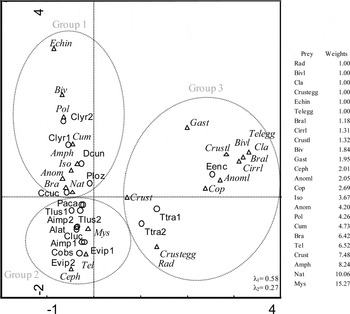
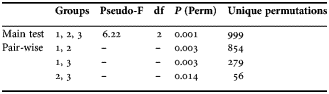
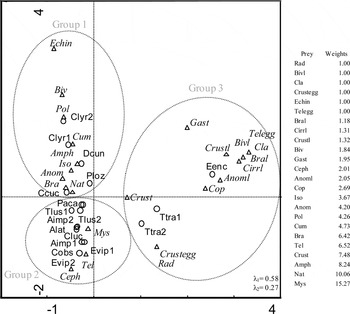
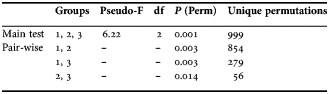
The correspondence analysis showed the presence of three distinct trophic groups in the coastal fish assemblage during this study (Figure 2). Group 1 included fish that preyed upon a large proportion of infaunal and epibenthic prey (e.g. polychaetes and amphipods), namely C. cuculus, C. lyra (C. lyra1 and C. lyra2), P. lozanoi and D. cuneata. Mysids and teleosts were less important prey for this group. Group 2 comprised A. imperialis (A. imperialis1 and A. imperialis2), A. laterna, C. obscurus, C. lucernus, E. vipera (E. vipera1 and E. vipera2), P. acarne and T. luscus (T. luscus1 and T. luscus2). These species had diets composed mainly of suprabenthic prey, especially mysids. Group 3 contained E. encrasicolus and T. trachurus (T. trachurus1 and T. trachurus2), that fed mostly on pelagic organisms (copepods and diverse meroplanktonic organisms). The PERMANOVA main test and the subsequent pair-wise tests revealed the existence of significant differences (P < 0.05) between the three groups identified by the CA (Table 4).
Diagram of the correspondence analysis performed using the frequency of occurrence of the several species/size-classes to identify major trophic groups. Δ, prey groups; ○, species and/or size-classes (see Table 1 for the size-class details and species abbreviations and Table 3 for prey abbreviations). Eigenvalues of the first two axes (λ1 and λ2), groups formed in the diagram (Groups 1–3) and the relative weight of each prey group in the analysis are also indicated.
Results of the PERMANOVA tests performed to compare the diet (index of occurrence) of the trophic groups (1, 2 and 3) identified in the correspondence analysis.
Diet overlap
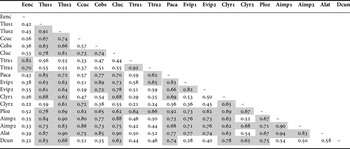
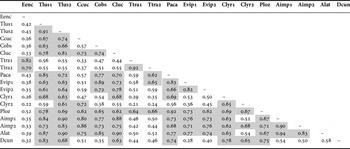
The Horn index evidenced a high dietary overlap amongst the species/size-classes, and even between fish living at different water column strata (Table 5). The high consumption of mysids was a major contributor for this high dietary overlap. Callionymus lyra, D. cuneata, E. encrasicolus and T. trachurus showed the lowest trophic overlap in the assemblage. The first two species exhibited the diets with most infaunal and epibenthic organisms of the whole assemblage while the other two were the main pelagic feeders.
Results of the Horn index measuring the diet overlap among the different fish species/size-classes, using the standardized frequency of occurrence of each prey group. Values higher than 0.6 are highlighted because dietary overlap is considered to be significant above this limit (see Table 1 for size-class details and species abbreviations).
DISCUSSION
The importance of mysids
Mysids played a very important role in the diet of the fish assemblages in the coastal area off Aveiro, occurring in the gut contents of all species. These findings are consistent with the results obtained by Cunha et al. (Reference Cunha, Sorbe and Bernardes1997), who studied the suprabenthic communities off Aveiro (also during a summer period), and concluded that mysids were one of the most abundant organisms in the assemblage. According to Mauchline (Reference Mauchline1980), mysids are an important part of the suprabenthic community of several coastal habitats, and their daily vertical migration through the water column makes them available for several fish species that occupy different niches. Lasiak & MacLachlan (Reference Lasiak and McLachlan1987) stated that mysids usually form dense aggregations, making them a very important prey for fish inhabiting highly dynamic environments, as is the case of this study area. The importance of mysids in coastal food webs was also observed by Hostens & Mees (Reference Hostens and Mees1999).
Although overlap in diets is more likely to occur when the prey identification is not undertaken to species level, the high dietary overlap observed between the fish species analysed in the Aveiro coastal area is very likely a consequence of the high abundance of mysids, their availability through the water column, and value as energetic resource (Mauchline, Reference Mauchline1980), which makes this group highly predated on by all the fish species studied.
Piscivory
Piscivory was not common in the present study and occurred with low incidence on the species with major commercial interest. In this assemblage, Pomastochistus spp. were the most preyed upon fish, due to their small size and high abundance, compared to other species. The low levels of piscivory observed may have been influenced by the high abundance of mysids and also by the size of the fishes studied, as many of them were juveniles.
Trophic structure
The trophic structure of the fish assemblage of the Aveiro coastal area revealed three distinct groups. Group 1, including C. cuculus, C. lyra, P. lozanoi and D. cuneata, were fishes with benthic diets that comprised polychaetes, amphipods, anomurans and brachyurans, even though mysids were also an important food resource. These findings support earlier published studies for C. lyra (van der Veer et al., Reference van der Veer, Creutzberg, Dapper, Duineveld, Fond, Kuipers, van Noort and Witte1990; King et al., Reference King, Fives and McGrath1994), D. cuneata (Belghyti et al., Reference Belghyti, Aguesse and Gabrion1993; Cabral et al., Reference Cabral, Lopes and Loeper2002) and C. cuculus (Moreno-Amich, Reference Moreno-Amich1992). Mysids have been considered the most important prey for P. lozanoi (Laffaille et al., Reference Laffaille, Feunteun and Lefeuvre1999), which was the smallest fish in the assemblage sampled and their preference for infaunal and epibenthic items may be related to competition with the other fishes (Costa et al., Reference Costa, Domingos, Almeida, Feunteun and Costa2008).
Group 2 included A. imperialis, A. laterna, C. obscurus, C. lucernus, E. vipera, P. acarne and T. luscus. These species fed mainly on suprabenthic prey, including mysids. Arnoglossus imperialis and A. laterna are known to use visual stimuli to detect prey and are expected to consume more mobile organisms (Braber & de Groot, Reference Braber and de Groot1973). The high abundance of mysids in the diet of A. imperialis was also shown by Cabral et al. (Reference Cabral, Lopes and Loeper2002), although this study also indicated that amphipods were the main prey for A. laterna, in contrast to the present study. It may be that the locally high abundance of mysids in the coastal area off Aveiro allows these two species to have more similar trophic preferences. Triglids such as C. obscurus and C. lucerna are active bottom dwellers and feed mostly on suprabenthic prey (Moreno-Amich, Reference Moreno-Amich1992; Reference Moreno-Amich1996; Amorim & Hawkins, Reference Amorim and Hawkins2000). Specimens of E. vipera preyed on several species, some of which inhabit the sediment but also others associated with the water column as observed in other Portuguese coastal areas (Vasconcelos et al., Reference Vasconcelos, Prista, Cabral and Costa2004). This mixed feeding strategy may explain the species inclusion in Group 2. Creutzberg & Witte (Reference Creutzberg and Witte1989), studying E. vipera in the North Sea, reported a broadly similar diet composition, but teleosts were the predominant prey. These differences may be related to prey availability on the study sites, with the high abundance of mysids off the Aveiro coast probably resulting in a lower consumption of teleosts. Pagellus acarne and T. luscus, which are more fusiform fish less associated with the sea floor, could be expected to potentially have a broader diet and capture organisms with higher mobility. However, some dependence on suprabenthic prey, as reported here, has been noted elsewhere (e.g. Hostens & Mees, Reference Hostens and Mees1999; Fehri-Bedoui et al., Reference Fehri-Bedoui, Mokrani and Hassine2009).
Species in Group 3 (E. encrasicolus and T. trachurus), consumed a high proportion of pelagic organisms. Although mysids were an important food item for E. encrasicolus, the majority of their prey were planktonic organisms. Copepods were dominant in a diet that also included the larvae of bivalves, barnacles and decapod crustaceans. The importance of copepods in the diet of E. encrasicolus is consistent with previous studies (Tudela & Palomera, Reference Tudela and Palomera1997; Plounevez & Champalbert, Reference Plounevez and Champalbert1999). The highest prey diversity in the present study was observed for this species, which comprised 14 major prey groups, possibly because its feeding strategy can shift from filter feeding for smaller zooplanktonic prey to particulate feeding for larger items such as mysids (Tudela & Palomera, Reference Tudela and Palomera1997). Trachurus trachurus preyed mostly upon mysids, unidentified crustaceans, copepods, and other zooplanktonic organisms. In studies conducted in deeper waters, Cabral & Murta (Reference Cabral and Murta2002) concluded that the main items in the diet of T. trachurus from the Portuguese coast were copepods and euphausiids, while in the Adriatic Sea, Jardas et al. (Reference Jardas, Šantić and Pallaoro2004) reported a diet comprising euphausiids, mysids, decapod crustaceans, cephalopods and teleosts. The works cited above were generally carried out in waters deeper than the present observations, and depth may account for the absence of euphausiids in the area studied, as adult euphausiids occur mainly in deeper waters (Cunha et al., Reference Cunha, Sorbe and Bernardes1997). Additionally, the sample of T. trachurus in the present study comprised juveniles, in contrast to the references quoted above.
Ontogenic changes
Larger T. trachurus, T. luscus and E. vipera fed on larger organisms, while smaller fish predated on smaller prey, as observed elsewhere (Santos, Reference Santos1989; Hamerlynck & Hostens, Reference Hamerlynck and Hostens1993; Cabral & Murta, Reference Cabral and Murta2002; Vasconcelos et al., Reference Vasconcelos, Prista, Cabral and Costa2004). For these species the consumption of fish and in some cases decapod crustaceans, increased as fish got larger. On the contrary, dietary ontogenic changes for A. imperialis seemed to reflect niche shift rather than the ability to capture different sized prey. The change from large suprabenthic prey to infaunal and epibenthic organisms is, however, not in agreement with Deniel (Reference Deniel1975), who observed that small prey like mysids decreased as fish size increased. For adult C. lyra, besides the change in prey size, a niche shift from a pelagic to a benthic diet was observed, in accordance with other studies (Wheeler, Reference Wheeler1978; King et al., Reference King, Fives and McGrath1994).
Dietary ontogenic shifts may be explained by morphological changes that occur with fish growth (e.g. Castro & Hernández-Garcia, Reference Castro and Hernández-García1995). Additionally, within a geographical area, individuals of the same species but of different size-classes can occupy diverse trophic niches, feeding either on the water column or near the bottom to seek for the appropriate prey and/or to reduce predation risk (Werner & Mittelbach, Reference Werner and Mittelbach1981).
In conclusion, the present work highlighted important results concerning the coastal fish assemblage off Aveiro during summer, namely the strategies used by fish to optimize the use of resources. It also contributes to a better understanding of the marine food webs as required by the MSFD and EAF.
ACKNOWLEDGEMENTS
The authors thank the crew, technicians and researchers who took part in the survey aboard RV ‘Noruega’ and RV ‘Tellina’. They are particularly grateful to Isabel Meneses, Alexandra Silva and Cristina Nunes for their contributions in setting up and carrying out the survey, Pedro Cunha and Fátima Quintela for their assistance on P. lozanoi and zooplankton identification, to Lurdes Dias who helped in various laboratory tasks and to Tadeu Pereira for his contribution in the artwork. The authors also express their gratitude to Dr Jim Ellis and the anonymous referees for the improvement of the manuscript. This study was undertaken within the project NeoMAv, co-financed by FEDER and the EU.