

Introduction
The metaphor of contagion has been used by social scientists to describe a variety of phenomena that diffuse in space.Footnote 1 Technological innovations, policy adoption, norms and ideas, political regimes, conflict, criminal behaviours and political preferences are some of the numerous examples of issues that spread across geographic space and networks. In its conciseness, this list not only illustrates how spatial interdependence is ubiquitous to social phenomena, but also how spatial diffusion can occur among different subjects or nodes in a network. Policies diffuse across countries and innovations across firms; norms are spread via international organizations or non-governmental organizations; crime and violence travel across regions; and political opinions spread through personal networks. It is important to point out that diffusion processes are not simply the clustering of similarity (or dissimilarity) among proximate units; rather, interdependence is the key feature of all diffusion processes. As we will see in a moment, this is the fundamental difference between spatial autocorrelation and spatial interdependence (or, the Galton problem).
Suppose, for example, that a group of individuals in a survey report similar levels of religiosity. It turns out that these individuals are friends. We would wonder whether their religiosity is independent of each others' or if there is a peer-group effect at play. One could conclude that the clustering of preference within this group is the result of a diffusion process, where each individual's preference has influenced that of another friend, ultimately leading to convergent attitudes towards religion. However, alternative explanations that do not imply interdependent decisions are equally plausible. For example, individuals can self-select into groups that share similar views a priori. Alternatively, friends may share similar views because they have been exposed to similar external stimuli (e.g. they all had religious parents) or because they just grew up in the same neighbourhood or village where all had the same religious attitude. Homophily and common exposure would then explain the observed clustering, rather than any spatial interdependence underpinning diffusion processes.
But let us suppose what we see is true interdependence and the attitudes of these friends are simultaneously affecting each other. Even if we were able to show that the similarity in attitudes was not merely due to clustering but to diffusion, we would not yet know what mechanism led to that diffusion. Hence, we could pursue this even further and start wondering whether the mechanism behind this diffusion process was one of emulation or one of learning. Are individuals changing their views in response to each other to intentionally become closer to their friends? Or are they adapting their attitudes because, after observing their friends, they see that religiosity brings some benefits, for instance that going to church every Sunday reinforces ties with the community? Finally, and more importantly, the same clustering could be detected among citizens living in the same neighbourhood, beyond the group of friends on whom we initially focused. All the above questions and necessary reflections would also apply to this case. Notice, however, that one key difference would concern how individuals are spatially connected. In the case of friends, connections are based, by definition, on existing friendship ties. In the case of neighbours, connected individuals are geographically proximate and live in the same neighbourhood, without being necessarily part of the same friends' network.
This introduction illustrates how complex spatial interdependence can be, and why it is not just a simple inferential problem that needs to be fixed in a statistical model. Spatial interdependence offers nuance and insights into the theories we formulate to explain social phenomena. First, not all spatial clustering is spatial interdependence. Spatial interdependence implies that an outcome in a unit directly affects the same outcome in another unit. Second, geographic proximity is only one way to define the web of connections through which diffusion processes unfold. Third, once spatial interdependence has been detected, different plausible underlying mechanisms could explain such interdependence, such as spillover, mimicry, or learning.Footnote 2 This paper cannot comprehensively discuss all three issues, and therefore only focuses on the first two. It begins by discussing what spatial data are and the broad notion of proximity, which is used to define connections among units (i.e. the spatial weights matrix). We then discuss spatial autocorrelation and the distinction between clustering and interdependence. We present a stepwise strategy based on commonly used statistical tests (and software)Footnote 3 to distinguish between the two different data generating processes. Finally, we present the main modelling strategies in the presence of spatial interdependence. Overall, this paper should be understood more as a teaser than as an introduction (Darmofal, Reference Darmofal2015; Ward and Gleditsch, Reference Ward and Gleditsch2018).Footnote 4 It puts forward a way to think about spatial interdependence as a norm rather than as an exception. This does not mean all our models should also be spatial; on the contrary, it invites a more thorough reflection about the theoretical needs behind spatial models that presume a non-trivial knowledge of the data generating process. In its attempt to provide an overview of types of spatial data, of exploratory spatial analysis and of some spatial models, this paper – in a special issue on methods in political science – differs from other excellent work on space in social sciences.Footnote 5 This paper is intended as a practical guide for political scientists who want a sense of where to get started with spatial data, who want to explore the frontier of spatial analysis and who want to identify the methodological opportunities it can offer. Hence, this is a short introduction for non-yet-experts in spatial analysis, and we hope it will provide a stepping stone for their future research based on spatial analysis.
What are the core elements of spatial analysis?
Political scientists work with two main data structures: cross-sectional and time-series cross-sectional observational data. Hence, our datasets often focus on several units of observation (e.g. countries), which we can sometimes observe at time intervals (e.g. yearly). In most introductory courses to quantitative methods, dealing with temporal dependencies (i.e. serial autocorrelation) is a standard learning objective. Rarely, however, the relational nature of the observations across space is addressed, possibly with the exception of considering each unit within a larger spatial unit (e.g. province, regions, and continents). In other words, at best, spatial relations and interdependence are modelled as nuisance and left to corrections of the standard errors (Franzese and Hays, Reference Franzese and Hays2008). In order to start approaching the possible spatial interdependence in our data, we need to present the building blocks of spatial data and spatial relationships. We first discuss different spatial data formats, and we then explain how to define and declare the spatial interdependence between observations using a so-called spatial matrix (also referred to as a W matrix).
Spatial data come in two main formats: vector and raster data. The key difference between vector and raster data is that the former is used for discrete representations of spatial data (e.g. the population in a country), while the latter is used for continuous representations (e.g. terrain elevation or surface temperature). Vector data include three types of features: points, lines, or polygons. These features are part of the so-called shapefile. Notice that a shapefile can only contain one of these three types of features at a time. Although the unit of a vector can be a point, a polygon, or a line, in raster data a unit is represented by pixels. As we will discuss later, neither vector features nor raster pixels are necessarily the observational units of our analysis, but it is necessary to know of their existence and their differences in order to link these spatial data to our observational unit.
In general, event data usually come as point shapefiles, while information on administrative units (e.g. the population of a district or the GDP of a country) is available as polygon shapefiles. Starting from vectors, points are the most basic form of spatial data, and often these types of data are those we tend to deal the most. Points are defined by pairs of coordinates, x and y, and can represent events (e.g. protests and conflict events), buildings (e.g. military barracks and pooling stations), individuals (e.g. respondents in a survey), towns, or any other discrete object defined in space. To provide a more concrete example, if you want to study the local onset of conflict and the presence of natural resources (such as diamonds), you will need data points on where the conflicts are (Eck, Reference Eck2012) but also the location of diamond mines (Gilmore et al., Reference Gilmore, Gleditsch, Lujala and Rod2005). Hence these data will come with data points and relative coordinates, but also with information, for instance, on the intensity of the conflict (e.g. the number of killed soldiers) or the types of diamonds at that specific location. Notice, also, that temporal information is often attached to a spatial data point, especially when we deal with data events (Ruggeri et al., Reference Ruggeri, Gizelis and Dorussen2011). Important to note here is that spatial points are often available as lists of coordinates (i.e. in Excel formats rather than shapefiles) that can easily be imported in statistical software and transformed into actual spatial data.Footnote 6
Lines and polygons can be thought of as sequences of connected points where the first point is the same as the last for the polygons, whereas lines are open polygons where the sequence of points does not result in a closed shape with a defined area. As they are based on points, lines and polygons are also ultimately based on groups of coordinates. Lines may represent roads (Zhukov, Reference Zhukov2012), railroads (Ferwerda and Miller, Reference Ferwerda and Miller2014; Kocher and Monteiro, Reference Kocher and Monteiro2016), rivers (Toset et al., Reference Toset, Gleditsch and Hegre2000), or other physical barriers (e.g. checkpoints). Line data will be useful to provide, for instance, information on infrastructures or demarcations between our analytical units. Polygons are a widely used spatial feature as well. Countries in the world can be represented spatially as a polygon, or geographic space can be represented using fixed polygon units. For instance, the PRIO-grid project (Tollefsen et al., Reference Tollefsen, Strand and Buhaug2012) provides a standardized spatial grid structure with global coverage at a resolution of 0.5 × 0.5 decimal degrees (approximately 50 × 50 km at the equator).
Finally, the raster data represent continuous surfaces, such as forests or mountains. Raster data are created dividing an entire space into equal-sized cells, often represented by pixels, and the value of the variable of interest is measured for each of these cells. An increasingly popular example of raster data among political scientists is nightlight emissions, gathered via satellite imagery and used as a proxy to measure state reach or local-level economic activity (Harbers, Reference Harbers2015; Weidmann and Schutte, Reference Weidmann and Schutte2017). Interestingly, it is possible to transform digital images into raster data. Software such as ArcGIS allows the importation of images and georeferencing them by assigning geographical information to them (i.e. linking points in an image to their actual position on the globe). This function is particularly useful for extracting information from historical maps that are usually not already available as spatial data formats.Footnote 7
An issue that often arises among those who are taking their first steps in spatial analysis is the fact that spatial data points, lines, and raster data rarely represent the unit of observation of our dataset. In fact, among geographers, data point analysis is common (Bivand et al., Reference Bivand, Pebesma, Gomez-Rubio and Pebesma2008), but political scientists more often merge information from data points into their analytical units (e.g. provinces and countries) spatially. For example, it is possible to assign the characteristics of a data point (e.g. a conflict event) to a country in the world if the point is spatially contained in the polygon defining the country.Footnote 8 This operation is called spatial merge (or spatial join). The issue of the match between analytical vs. geographic units would deserve a longer discussion (see e.g. Harbers and Ingram, Reference Harbers and Ingram2017; Arjona, Reference Arjona2019), and we cannot fully address it in this paper. Ultimately, the answer is not methodological but theoretical. In most cases, researchers need to combine different types of data and transform them to make it consistent with the most theoretically meaningful unit of analysis. For example, Daxecker et al. (Reference Daxecker, Di Salvatore and Ruggeri2019) were interested in individual perceptions of fraudulent elections; hence they used respondents as units of analysis that were spatially represented as data points within Nigerian states. They then linked state characteristics to each respondent spatially and calculated the distance from each individual to polling stations reporting electoral irregularities. In another study, Costalli and Ruggeri (Reference Costalli and Ruggeri2015a) opted for geographically fixed units (e.g. grid-cells) to study the effect of violence on voting preferences because administrative units changed over time and, more importantly, were possibly endogenous to the previous regime and conflict. Exactly because grid-cells might be too arbitrary, the authors also evaluated the robustness of their findings using grid-cells with alternative sizes.Footnote 9
We now move on to the discussion of one of the most critical choices we make when we analyse spatial data: which units are close (or connected) to other units?
How are things connected?
Once our data contain spatial information, we can start thinking about how units in our data are connected. The final output of this is a spatial connectivity matrix that is usually defined as a weight matrix W. The spatial weight matrix W is an N × N matrix representing the connections between all units in the data and is used for any type of spatial analysis, from exploratory analysis to statistical modelling and tests of spatial autocorrelation. Anselin et al. (Reference Anselin, Le Gallo and Jayet2008: 627) define spatial autocorrelation as being present ‘whenever correlation across cross-sectional units is non-zero, and the pattern of non-zero correlations follows a certain spatial ordering’. Of course, the first element of intuition about the structure of the spatial connections in our data is geographic and physical space. In fact, as Tobler's first law of geography suggests, ‘all places are related but nearby places are more related than distant places’ (Tobler, Reference Tobler1970: 236). However, we will discuss how cross-unit connections can be defined in different ways and, moreover, how spatial linkages are not uniquely a geographic matter (Beck et al., Reference Beck, Gleditsch and Beardsley2006).
How, therefore, do we define a unit's neighbourhood? How many neighbours do we need to include, and should this be based on distance? Neighbourhoods can be defined in a number of ways, such as contiguity (i.e. units sharing a boundary), distance, or using a certain number of closest units (k-nearest neighbours' criteria).
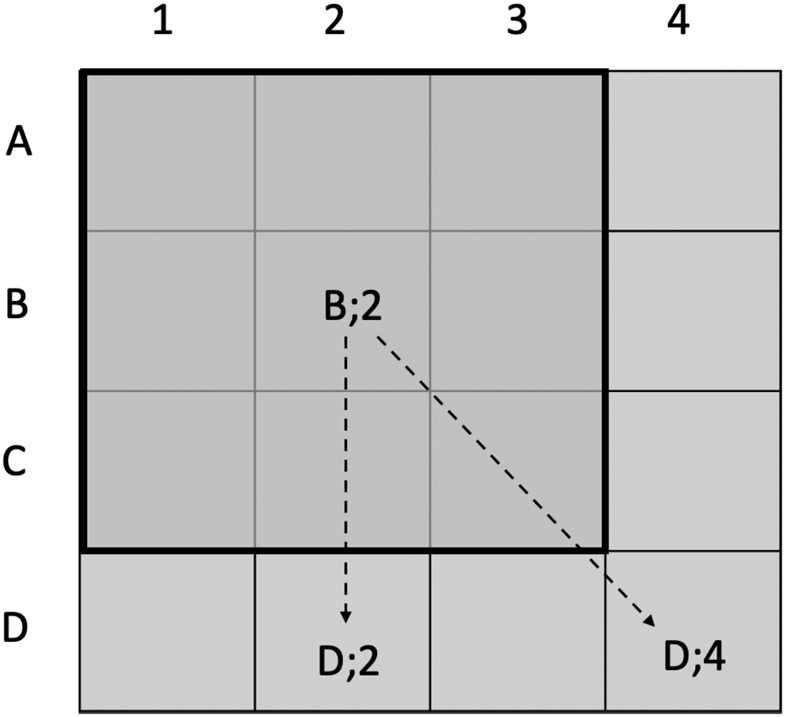
In Figure 1, we show different ways to represent proximity and, therefore, possible channels of spatial interdependence. Let us suppose we are analysing an area, and this is composed of 16 squares (they could be polygons of different shapes, of course). Each square can be defined by a combination of a letter and a number. Let us focus on square {B; 2}. If we ask which squares {B; 2} is connected to, our answer depends on how we have defined proximity. Suppose we want to use the contiguity criteria. Contiguity-wise, we could think about first-order proximity; that is, the eight squares immediately surrounding {B; 2} will be its neighbours. This is usually defined as Queen-based contiguity, because in the game of chess the Queen can move in all directions. Rook or Bishop-based contiguity criteria will identify only four neighbours: only those squares that share a full boundary or a corner, respectively. But we could also decide that we need to account for second-order proximity as well – in other words, not just those squares directly at the borders, but also the immediate neighbours' neighbours. In this case, {B; 2} would be connected to all squares in Figure 1.
Contiguities and distances.

The elements of connectivity matrices are usually binary (two units are either connected or they are not). However, we can define the connectivity matrix based on distance rather than binary contiguity. For instance, for {B; 2}, the squares {D; 2} and {D; 4} – if proximity has been defined in terms of first-order proximity – are not connected, but if we consider second-order they are equally connected to {B; 2}. However, if we were to use the distance from the centre of {B; 2} to the other squares as the connectivity rule, then {D; 2} would be closer than {D; 4}. Distance-based connectives can also be transformed into binary values by defining a distance threshold (e.g. 100 km) beyond which units are not considered as neighbouring (Ward and Gleditsch, Reference Ward and Gleditsch2018).
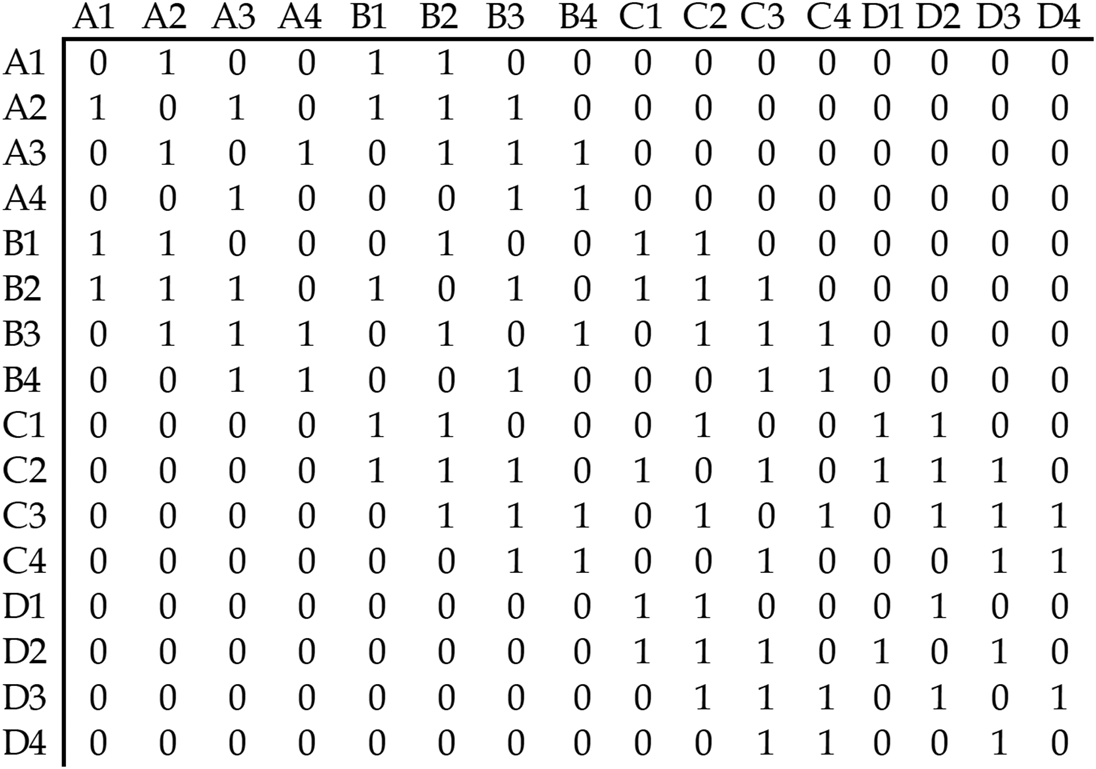
As is clear, defining a connectivity matrix is not a trivial task and involves several operational decisions.Footnote 10 Once we have decided on our definition of proximity, what does a W matrix look like? Figure 2 provides an example of a connectivity matrix based on our Figure 1. In this case, W is defined as a Queen-based first-order binary contiguity matrix. As there are 16 units in the data, W is a 16 × 16 matrix based on the possible connection of the 16 units. Since it is binary and based on contiguity, if a square is connected to another – for instance {B; 2} and {A; 2} – the value is 1. Notice that the diagonal elements of W (from top right to bottom left) in the matrix are always a zero diagonal. This is because the spatial matrix excludes the connection of a unit with itself. On top of all the possible choices to define W, row-standardization should also be considered. A row-standardized W transforms the element in the matrix so that each row sums up to a 1 (this is not the case for our example in Figure 2). If a unit has two contiguous neighbours, a row-standardized matrix will assign 0.5 to each rather than 1. Intuitively, this may make sense if we believe all units in the neighbourhood j to have the same influence over the unit i. However, it has been argued that this assumption may contradict most theories of spatial dependence: ‘unless homogenous exposure is theoretically warranted, W should not be row-standardized. If researchers are uncertain, the assumption of homogenous exposure can be tested against the assumption of heterogeneous exposure’ (Neumayer and Plümper, Reference Neumayer and Plümper2016: 191).
Example of binary spatial matrix W.

Moreover, as thoroughly explained by Beck and co-authors, space is more than geography. If we believe that the outcomes in a certain unit are affected by outcomes in other units, those other units may be the geographic neighbours – or something else. Interconnected units may be units with dense trade relationships, units with shared membership in regional organizations or even units with similar political institutions. Beck et al. (Reference Beck, Gleditsch and Beardsley2006) look into how trade interdependencies could define a W other than a mere W based on geographic distance. Another example can be found in Böhmelt and co-authors (Reference Böhmelt, Ruggeri and Pilster2017), where they show how leaders adjust their anti-coup polices based on what other countries with a history of similar coups have implemented, hence conceptualizing and operationalizing the W as shared history rather than as shared geography.
Concluding this section on the W matrix, we want to recall some central questions a researcher should consider when defining and creating a W: (i) Is the main criterion for defining the W merely geographic, or should another form of interdependence be considered? (ii) Is proximity defined on contiguity or distance? and (iii) What is the order of proximity? Should the neighbours’ neighbours be considered?
Neumayer and Plümper (Reference Neumayer and Plümper2016), in a paper succinctly titled ‘W’, elaborate some further points that should be considered. First, W needs to capture the causal mechanism through which spatial dependence works. Hence, theory is the essence for defining connectivity. Second, W determines whether total exposure to spatial dependence is specified as homogeneous or not (thinking critically, therefore, about row-standardization). Third, researchers specify the dimensionality of spatial dependence – whether there is a unique causal channel or multiple ones – hence deciding whether there are different Ws at play.
Do we need to model spatial feature?
The growing availability of spatial data and increasing awareness of the risks that interdependence poses for statistical inferences has pushed researchers to test and model spatial interdependence. In some cases, spatial interdependence is an empirical nuisance researcher want to account for or get rid of. For example, Griffith's eigenvector spatial filtering (Griffith, Reference Griffith2003) can be used to remove the spatially interdependent component of a variable by splitting it into spatial and non-spatial components; the latter is filtered out of the original variable by regressing some linear combination of different connectivity matrices on the variable (Griffith, Reference Griffith2003; Thayn, Reference Thayn2017). In many other cases, however, we do want to model spatial interdependence: we want to see whether and how it explains variations in the outcome of interest. Any theoretical account that involves interdependent actors is also interested in empirically modelling and estimating that interdependence. It can be the case, however, that the spatial dynamics of some social phenomena are negligible and ultimately do not require either sophisticated modelling or filtering. How do we know whether we need to model spatial interdependence? What if our data present some hotspots (i.e. localized clustering) but overall do not exhibit spatial interdependence? In other words, how do we know that spatial clustering is due to interdependence rather than due to exposure to common shocks?
In this section, we illustrate a stepwise approach to spatial analysis. We first highlight the value of mapping spatial data, then introduce the two main statistics for global and local for spatial autocorrelation, that is, Moran's I and Geary's G. Although these tests can tell whether a variable is spatially autocorrelated, they do not imply we should model that interdependence. We illustrate two ways of detecting interdependence: checking for autocorrelation in the residual of a simple ordinary least squares (OLS) and the use of LaGrange multiplier (LM) tests.
Detecting spatial autocorrelation: map it and test it
In their seminal paper on ‘Contagion or Confusion?’, Buhaug and Gleditsch (Reference Buhaug and Gleditsch2008) start from a very simple observation. If you map armed conflict around the world (they focus on the years 2001–2005), you will see how violence clusters in space. Countries experiencing armed conflict are often surrounded by other countries having the same experience. It is enough to think about countries in the Sahel region and the Middle East. This pattern of similarity among neighbouring countries would suggest that conflict spreads across national boundaries; in other words, violence is contagious. Buhaug and Gleditsch, however, also show a map of GDP per capita in 2000, which seems to describe a very similar pattern in the same regions. Now, the association between civil war onset and poverty is probably one of the most robust findings of civil war literature, and the two maps certainly corroborate this finding. This preliminary mapping exercise is very helpful, of course, as most of us are unable mentally to map data and identify clusters of values. Mapping gives us the first quick glance into the spatial structure of the data we use, as we can immediately see geographic variation. Notably, mapping data to detect clusters implies that we expect spatial structure to be geographic. This is often the most intuitive structure exhibited by country-level data, although (as we have discussed) it is by no means the only one. An alternative mapping of a non-geographical structure would require a network where connections can be defined in different ways. For simplicity, we will assume we are sure that the only relevant spatial connection in our data is geographic.
The maps presented by Buhaug and Gleditsch raise two important questions. The first concerns our own ability to spot clusters. It is clear that some countries with armed conflict are close to each other in some regions, but does this mean the data are globally spatially autocorrelated? Second, if conflict and GDP both cluster in the same regions and GDP is a plausible cause of armed conflict, is GDP explaining the spatial autocorrelation rather than the spread of conflict across countries? Put differently, is y i (i.e. conflict in a country i) caused by y j (i.e. conflict in neighbouring countries) or by x i (i.e. GDP in country i, independent of j), which just happen to cluster in space? Notice that, in the first instance, we have spatial interdependence, and therefore an issue of endogeneity; in the second instance, the spatial autocorrelation does not introduce interdependence in the observations and is usually solved by controlling for x i. But we now begin addressing the first question, namely, how to test for spatial autocorrelation.
Tests of spatial autocorrelation aim at detecting non-randomness in the spatial distribution of a variable. Data may exhibit positive or negative spatial autocorrelation. Positive spatial autocorrelation implies that similar values cluster in space. For example, rich countries are close to other rich countries, while poor countries are close to other poor countries. Notice that positive autocorrelation is only concerned with the similarity of neighbouring units and can be driven by either high–high or low–low clustering. Negative spatial autocorrelation, on the contrary, describes a pattern in the data where nearby values are systematically dissimilar, such as a democratic country surrounded by mostly autocratic countries. In this case, the pattern is of high–low or low–high clustering. Although we can spot these patterns by looking at maps, we are bad at assessing how serious autocorrelation is; sometimes, we might simply not be able to spot any autocorrelation even when it is present. There are two types of indicators that can help us identify statistically significant spatial autocorrelation: global indicators and local indicators. The main difference between the two is that global indicators provide one single statistic for spatial autocorrelation across observations; local indicators will produce one score for each observation, allowing us to identify exactly where the spatial clustering occurs.
The most used global test for spatial autocorrelation is Moran's I. Intuitively, Moran's I calculates the correlation between the values of a variable in unit i and the values of the variable in all other locations. Notice, however, that Moran's I is not exactly a correlation coefficient, as we will see. The formula of Moran's I is:
 $$I = \displaystyle{N \over {S_0}}\;\displaystyle{{\mathop \sum \nolimits_{i = 1}^N \mathop \sum \nolimits_{\,j = 1}^N w_{i, j}\;( {y_i-\bar{Y}} ) ( {y_j-\bar{Y}} ) } \over {\mathop \sum \nolimits_{i = 1}^N {( y_i-\;\bar{Y}) }^2\;}}$$
The numerator is the covariance between the values in y i and y j. Notice that y j is the ‘neighbourhood’ of y i as defined by the spatial matrix w i,j. S 0 is the sum of all w i,j. It is sometimes erroneously believed that Moran's I ranges from −1 to 1, as other correlation coefficients. In fact, this is a key difference, as I does not equal 0 under the null hypothesis. The null hypothesis of Moran's I test is that, in the absence of spatial autocorrelation, the expected value I 0 = −1/(N − 1). If the observed value of  $\hat{I} > I_0$, the data exhibit positive spatial autocorrelation; on the contrary, an observed
 $\hat{I} < I_0$ indicates negative spatial autocorrelation. Statistical software (R and Stata) report the expected and observed value I, the correspondent z-score and its P-value that allows us to reject (or not) the null hypothesis of random spatial distribution. There are two important points to keep in mind when using Moran's test. First, the test will report different results depending on how we define the spatial matrix w ij; as w ij changes, y i will be compared to different y j. It is useful to explore how Moran's I changes as the number of spatial lags or distance vary. Correlograms are helpful for this purpose as they plot the estimated Moran's score as a function of distance or lags on the x-axis.
Second, Moran's test works under the assumption that the variable of interest is normally distributed. This assumption usually holds when continuous variables are used. When dealing with count variables, it is often possible to transform them into ratios, for example by dividing the count by population or area. In turn, such a transformed variable can be used for Moran's test. When the variable under scrutiny is not continuous, however, spatial autocorrelation can be tested using join counts. In the presence of a binary variable 0/1, y i and y j can either take the value (0, 0), (1, 1), or (0, 1). Clustering of similar values (0, 0 or 1, 1) would indicate positive autocorrelation, while a higher number of dissimilar combinations (0, 1) would indicate negative autocorrelation.
Suppose we have performed a Moran's test for global spatial autocorrelation and have failed to reject the null hypothesis, that is, there is no evidence of global spatial interdependence in our variable of interest. Does this mean we can be confident that there is no spatial interdependence in our data? It is possible, in fact, that Moran's test does not report a significant test statistic even if some local clustering exists in the data. This is because such clustering may be not significant enough to be picked up by the global statistics. As pointed out by Anselin, ‘it is quite possible that the local pattern is an aberration that the global indicator would not pick up, or it may be that a few local patterns run in the opposite direction of the global spatial trend’ (Anselin, Reference Anselin1995: 97). Local indexes of spatial autocorrelations (LISAs) can be used to detect such clusters of similar or dissimilar values. Notice that LISAs are not only worth exploring when the Moran's global statistic is not significant; even when we do detect global autocorrelation, LISAs help detect exactly where the correlation may be occurring among our units.
As with global statistics, there are several available tests. Here, we will keep our focus on Moran's statistics and illustrate the local version of Moran's I. The formula for the local Moran's I can be written as:
 $$I_i = \displaystyle{{\;( {y_i-\bar{Y}} ) \;\mathop \sum \nolimits_{\,j = 1}^N w_{i, j}( {y_j-\bar{Y}} ) } \over {( 1/N) \mathop \sum \nolimits_{i = 1}^N {( y_i-\;\bar{Y}) }^2\;}}$$
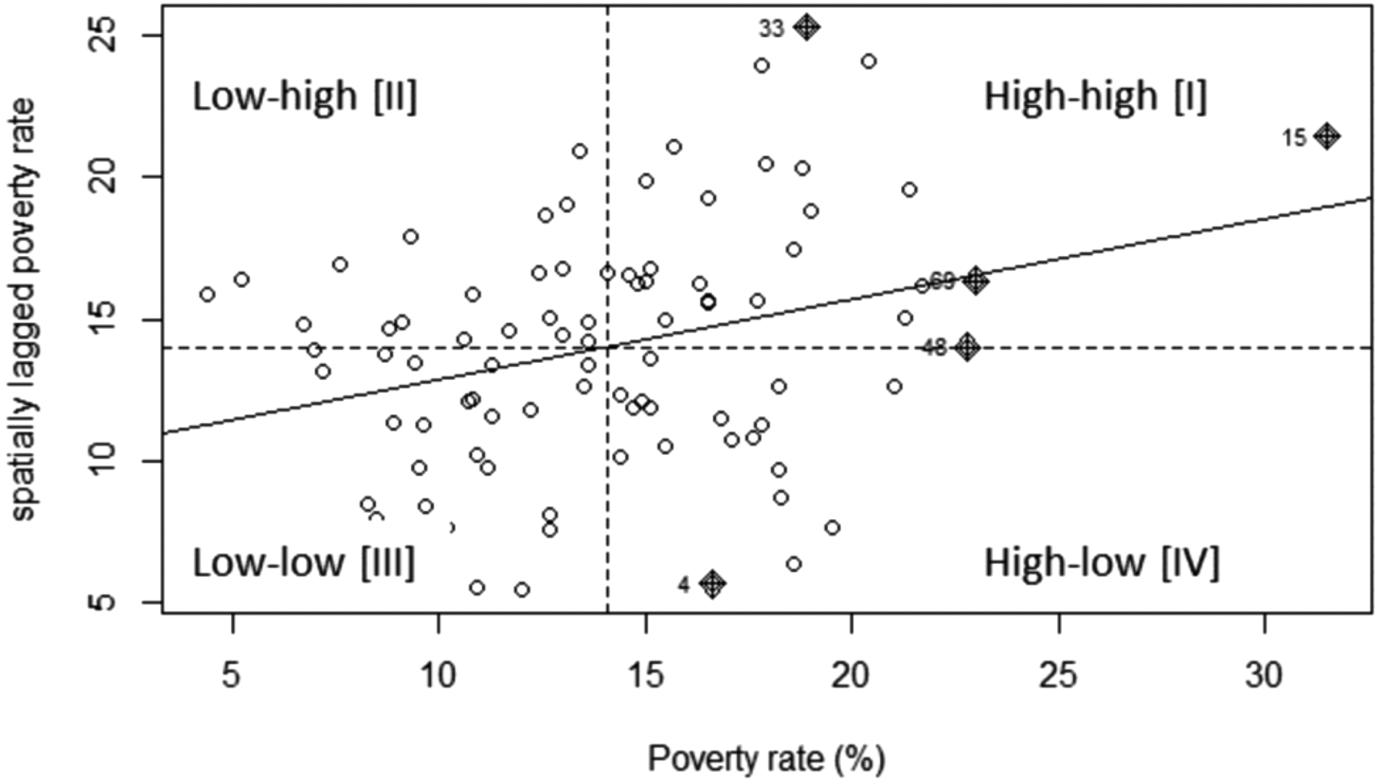
Local Moran's statistics are estimated for each unit i, in contrast to the global statistics that return one single statistic for the entire sample. Thus, for each unit, we can obtain the observed local statistics of spatial autocorrelation, its expected value, its z-score and its P-value. In fact, it is also possible to map the z-scores for each unit to visualize the location of clusters and hotspots that are statistically significant. The interpretation is not dissimilar to the global test, so that an observed statistic greater than the expected statistic in a unit is suggestive of local clustering (i.e. the unit is surrounded by similar units), and vice versa for a smaller observed statistic. The Moran's scatterplot is an extremely useful visualization tool summarizing both global and local Moran's tests. Figure 3 shows the Moran's scatterplot using data on poverty rates in Ohio's counties in 2015. The scatterplot visualizes the poverty rate in each county against the poverty rate in the county's neighbourhood. In the first and third quadrants (high–high and low–low), there are counties surrounded by counties with similar levels of poverty; in quadrants two and four (low–high and high–low), on the contrary, there are counties that are dissimilar from their neighbours. Most observations fall in quadrants one and three, thus suggesting an overall positive spatial autocorrelation summarized by the positive slope of the linear fit. In fact, the slope of the linear trend corresponds to the global Moran's I with row-standardized spatial matrix.
Moran's scatterplot on poverty rates (source: Wu and Kemp, Reference Wu, Kemp and Wilson2019).

Importantly, neither global indicators nor LISAs can ascertain whether spatial association is due to the clustering of other factors associated with y i or to the interdependence between y i and y j. Once we find evidence for spatial autocorrelation, we can use two main strategies to assess whether such autocorrelation is likely to indicate interdependence that would make an OLS estimate biased and inconsistent. A first simple check is to run an OLS with all relevant control variables and then test for spatial autocorrelation in the residuals using global and local tests. If the spatial clustering in the outcome is the result of covariate clustering, it is likely that controlling for them would remove the spatial pattern and we would not see spatial autocorrelation in the residuals. The LM test is an alternative approach that compares our OLS with two other models: the spatial lag and the spatial error models (SEMs). Rejecting the null hypothesis of the LM test means that the alternative model (spatial lag or spatial error) is preferred to the non-spatial OLS. The LM test compares the OLS with each alternative spatial specification, but does not allow us to pick between the two when both have a significant test statistic. When this happens, one can estimate a robust LM test to identify the most appropriate spatial model.Footnote 11
How to model spatial interdependence?
Suppose you have used the tests for spatial autocorrelation and found that there seem to be local and/or global autocorrelation in your data, and that the LM tests also suggest this is due to spatial interdependence. More specifically, the test would likely indicate that a spatial lag model or an SEM is superior to a simple OLS model. What is the difference between these two alternatives? What other spatial models can be used to estimate interdependence among observation?
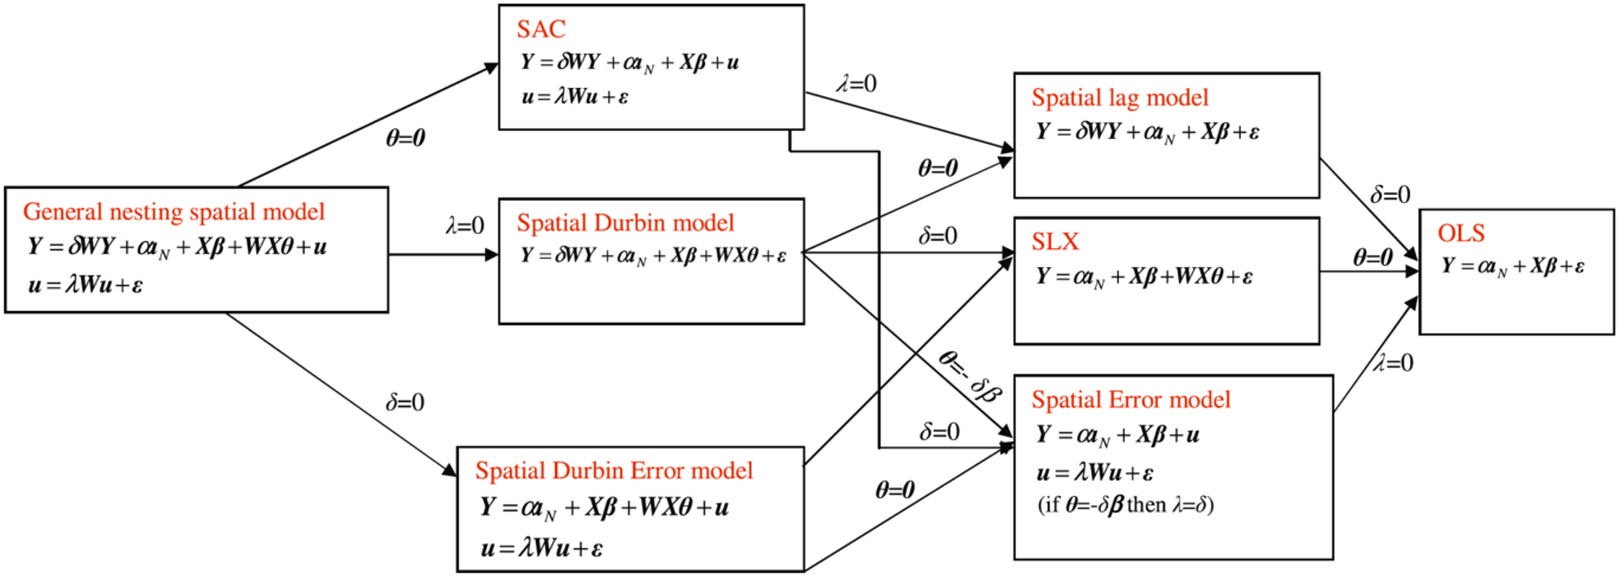
Elhorst (Reference Elhorst2014) outlines the relationship between different spatial models (and non-spatial OLS) starting from what he calls the general nesting spatial (GNS) model. The GNS includes (as does the OLS) a parameter β that is the effect of X on Y and a constant term α, but also:
• the spatial autoregressive (SAR) coefficient δ that is the effect of Y in neighbouring units (defined by the spatial matrix W). This parameter is often also indicated as ρ;
• the spatial spillover parameter θ that is the effect of X in neighbouring units (defined by the spatial matrix W);
• the spatial autocorrelation coefficient λ in the error term u.
Each of these parameters has a very clear practical interpretation. In the first case, we are assuming that, for example, when estimating the likelihood of a civil war in a country, we need to account for the onset of civil war in neighbouring units as well as the fact that conflict may be ‘contagious’. In the second case, we are assuming that, for example, regime types (democracies vs. autocracies) may influence the likelihood of civil wars, but it is likely that regime types cluster in space. Hence, we may want to control, not only for the type of regime in each country, but also for the types of regimes in its neighbourhood. Notice that, in both examples, the spatial clustering we observe is due to observable factors and their spatial structure (either in the outcome or in the covariates) (Cook et al., Reference Cook, Hays and Franzese2015). In the third case, the clustering is due to unobservable factors that are spatially interdependent.
There are two additional important things to note here. First, the SAR coefficient is what is commonly (although sometimes inaccurately) referred to as a spatial lag. This should not be confused with the spatial autocorrelation coefficient, which is also sometimes referred to as a spatial error term. The former is autoregressive because values of a variable in unit i depend on values of the same variable in unit j (and vice versa); the latter concerns autocorrelation in the error terms for observations linked in the spatial matrix W, similar to what serial autocorrelation is in time-series models. Finally, notice that parameters β and θ are (assumed to be) both exogenous. We will see that this implies fewer estimation problems for models where δ = 0, as reverberation effects due to the global spillover need to be accounted for. In the GNS model, all parameters are non-zero; Elhorst classification is very useful as it shows how the combination of each coefficient results in a specific spatial model. It follows that, when parameters δ, θ, and λ are zero, our model is just an OLS.
In the spatial autoregressive combined (SAC) model, both the outcome variable Y and the error term u exhibit spatial interdependence. The spatial lag model (or spatial autoregressive, SAR) is a nested version of the SAC model, where the spatial autocorrelation parameter λ is zero. In the spatial Durbin model (SD), both Y and X are spatially correlated and the model includes the terms θWX for the spillover effect and δWY for spatial intercedence. When spatial autocorrelation is only in the vector of X, the model becomes a spatial lag of X (SLX) model. The spatial Durbin error model (SDEM), intuitively, again includes the spatial lag of X but, instead of the spatial lag of Y, it includes the spatial autocorrelation in the error term. An SDEM without the spatial lag of X is an SEM.
As mentioned, the LM test, particularly its robust version, helps us to identify which spatial model we should use in the presence of spatial interdependence, but the spatial lag and the SEM are two out of the six possible spatial models illustrated above and in Elhorst's classification. As Cook et al. put it (Reference Cook, Hays and Franzese2015: 10), these models assume ‘that the spatial heterogeneity in the outcomes arises from a single source, constraining the other possibilities to zero’. Ideally, theory should help researchers identify the type of model that more closely allows them to test an expectation. In their review of the literature, Wimpy et al. (Reference Wimpy, Whitten and Williams2020) claim that most researchers have focused on SAR models, even if this particular model does not match the theoretical expectations regarding the existing spatial relationships among the units. Cook et al. (Reference Cook, Hays and Franzese2015) provide a useful guiding principle according to which researchers should first identify the sources of spatial clustering as observable and unobservable. They add:
‘where researchers are principally interested in obtaining unbiased estimates of the non-spatial parameters, the spatial Durbin model should be preferred. This should provide the most insurance against possible omitted variable bias by explicitly introducing both forms of observable spillovers into the systematic component of the model. However, where researchers are explicitly interested evaluating spatial theories, we believe one of the other two-source models (SAC or SDEM) are best. Each frees one parameter to capture spillovers in observables (either δ or θ) while accounting for spatial effects in the unobservables (λ).’ (Cook et al., Reference Cook, Hays and Franzese2015: 16)
At this point, one might wonder why we should care about spatial interdependence in a statistical model, and how ignoring it affects our inferences. Suppose we want to establish the relationship between civil wars and regime type, more specifically whether autocratic regimes are more likely to experience civil unrest. We can think of this as a simple OLS model with no spatial component. In this non-spatial OLS, we are assuming that y i is independent of y j (i ≠ j). However, this assumption does not hold if the probability of conflict in a country i is affected by the probability that conflict also erupts in country j. Ignoring this spatial interdependence when it exists means the OLS will exhibit omitted variable bias, which means it will produce inefficient and biased coefficients (Franzese and Hays, Reference Franzese and Hays2008). More specifically, as reported by Franzese and Hays, the OLS will overestimate the impact of the non-spatial covariates. We could address this omitted variable problem by including the spatial lag of the dependent variable in the right-hand side of the equation, as in a spatial OLS. This, however, introduces an endogeneity problem due to the simultaneity between y i and y j, which will affect each other at the same time and thus make the estimates inconsistent. In this case, the spatial lag is likely to be an overestimation of the actual spatial interdependence, and the coefficient of non-spatial covariates will likely exhibit a downward bias.Footnote 12 At higher levels of spatial interdependence, we need to model spatial relationships more accurately than the OLS can do. Franzese and Hays here suggest two options. First, one could estimate a spatial two-stage least square where the spatial lag of other non-spatial covariates (WX) is used as an instrument for the spatial lag of the outcome variable WY. Second, one could estimate a spatial lag model (or SAR model) with a maximum likelihood estimator. Franzese and Hays (Reference Franzese and Hays2008) find the latter weakly dominates the former.Footnote 13 In the remainder of this section, we discuss the challenges in estimating effects from spatial models. More specifically, we first discuss the (relatively) simpler SEM, SDEM, and SLX models and then move onto spatial models with an autoregressive component (SAR, SDM, and SAC). The challenges stemming from the latter should push researchers to think about the nature of the expected spatial effects and the extent to which models with more assumptions and less straightforward interpretations (SAR, SDM, and SAC) are necessary.
SEM, SDEM, and SLX
As it is probably the second most popular spatial model, we begin by presenting the SEM. An SEM can be written as:
 $$y = {\boldsymbol X}\beta + \; u $$
where
 $$u = \lambda {\boldsymbol W}u + \varepsilon $$
Therefore, the SEM can also be rewritten as:
 $$y = {\boldsymbol X}\beta + \lambda {\boldsymbol W}u + \varepsilon $$
As mentioned, the SEM allows us to estimate the spatial dependence of the error for observations that are connected via the W matrix. Ward and Gleditsch (Reference Ward and Gleditsch2018) point out that the presence of spatial autocorrelation in the disturbances may well be the result of some mis-specifications in the model, such as the omission of a variable that clusters in space. One can also imagine the case of a model that incorporates a spatial lag, but where the connectivity matrix is defined in a way that does not reflect the actual spatial connections among units. This type of mis-specification may result in the use of the LM test to support the use of an SEM.
Compared to the models we discuss in the next section, presenting the effects in an SEM model is straightforward because there is no feedback effect to account for. If we are interested in the impact of a covariate on the outcome, we can simply interpret the coefficient from the regression table and ignore the parameter of the spatial autocorrelation λ. The effect of a covariate on an outcome does not travel in space because the only spatial component of the equation is in the error term. Hence, the interpretation of a coefficient in an SEM model is ultimately the same as in a non-spatial model. The SDEM has the same parameters as the SEM, plus the spatial lag of covariates (θWX). This additional term captures the so-called local spillovers, namely the effect of covariates in neighbouring unit j on a specific unit i. This effect, however, does not cause further spillover to other neighbouring units in a cascade effect; it stops at unit i. What this implies is that the spatial lag of covariates does not introduce feedback effects that (as we will see) are responsible for the global spillovers in the SAR, SAC, and SDM and require spatial econometric techniques. For the same reasons, the estimates of an SLX do not present particular challenges and coefficients can be interpreted as in classic linear models.
The problem of global spillovers: spatial effects in SAR, SAC, and SDM
We begin this discussion with the SAR model, also known as the spatial lag model. This is one of the most used spatial models among those available to researchers. As indicated in Figure 4, the SAR model can be written as:
 $$y = {\boldsymbol X}\beta + \delta {\boldsymbol W}y + \varepsilon $$
Spatial model classification presented by Elhorst (Reference Elhorst2014).

In turn, this can be rewritten as:
 $$( {{\boldsymbol I}-{\boldsymbol \;}\delta {\boldsymbol W}} ) y = {\boldsymbol X}\beta + \varepsilon $$
This means that the expected value of y is:
 $$E( y ) = ( {\boldsymbol I}-{\boldsymbol \;}\delta {\boldsymbol W}) ^{{-}1}{\boldsymbol \;X}\beta $$
In the absence of spatial interdependence, the expected outcome would be predicted by the exogenous covariates and their estimated coefficient; in the presence of spatial interdependence, however, the term Xβ is multiplied by (I − δ W)−1. Indeed, the term (I − δ W)−1 is also known as the spatial multiplier and it ‘tells us how much of the change in x i will spill over onto other states j and in turn affect y i through the impact of y in the spatial lag’ (Ward and Gleditsch, Reference Ward and Gleditsch2018, 59). In other words, this implies that a change in a covariate in one single observation will affect the outcome in other units, depending on the degree of connectivity defined by W. If the change occurs in a unit that has no neighbour (so-called islands), there is no spillover. Conversely, a small change in a very connected unit is likely to reverberate throughout the cluster of its neighbours. Because of this reverberation, the spatial effects of the SAR model are also called global spillovers because any change in any unit will affect other units. It follows that the impact of the change will depend on the specific unit where the change itself takes place. Now, researchers can estimate three main effects of interest:
(1) direct effect (ΔX)β: that is, the effect of a change in x i on y i. Notice the average direct effect concerns changes occurring in the same unit i, so this is intuitively similar to the standard interpretation of β. However, notice that, in a spatial model, the effect of x i on y i and then on y j, which feedbacks to y i, is accounted for;
(2) indirect effect of x j on y i [(I − δ W)−1 − I] (ΔX)β, or (in other words) the average impact of a change of a covariate in the neighbourhood j on the outcome in i;
(3) total effect (I − δ W)−1 (ΔX)β, which is the sum of the average direct and indirect effects.
Nowadays, statistical software allows researchers easily to estimate these effects, but it is worth remembering that these spatial effects are not straightforward to interpret standard regression tables. Also, and unlike effects in non-spatial models, spatial effects are different for each unit of the sample simply because the composition of the W matrix changes for each unit (i.e. each unit has different neighbours). This is why LeSage and Pace suggest reporting the three spatial effects above as averages (LeSage and Pace, Reference LeSage and Pace2014), as some statistical software already does. It is also possible, however, to explore how a change in one specific unit (which may be of particular interest for theoretical reasons) affects other units, or to rank different units in terms of their impact on another specific unit of interest. For interested readers, Ward and Gleditsch (Reference Ward and Gleditsch2018) illustrate a step-by-step procedure to present these effects in R.
Now that we have discussed the problem of how to interpret and report direct and indirect effects in SAR due to the spatial multiplier, one can easily understand how the same issues apply to the case of the SAC and the SDM. Both models include a spatial lag of the dependent variable, suggesting that outcomes across the sample will affect each other, as will changes in their covariates. The direct and indirect effects for the SAC and SAR have the same interpretation, as the inclusion of the spatial interdependence in the disturbances of the SAC (λWu) does not introduce additional feedback to account for in the model, as we have also discussed in the previous section. It is slightly different for the case of the SDM, which includes the spatial lag of the dependent variable y and the spatial lag of x (θWX) at the same time. This inclusion means there are not only global spillovers due to the spatially lagged outcome, but also local spillovers. Again, although global spillovers affect all units' outcomes via other units, local spillovers only affect the immediate neighbours of the unit where the change occurs. This means that the total average effect (see above) in the SDM will need to include another term, that is θ W(ΔX).
Conclusions
In this paper, we have introduced some insights into spatial interdependence and how political scientists could start thinking about modelling it rather than filtering it out and treating it as a residual nuisance.
To conclude, and going back to our warning about the theoretical need for some spatial models, the initial fascination with sophisticated spatial econometrics seems to have been replaced by more careful evaluation of the appropriateness of such models. Elhorst and Vega (Reference Elhorst and Vega2013) suggest a ‘revision’ in the way researchers select statistical models that do not uniquely rely on statistical tests (Moran's, LaGrange, etc.) but more on theory and context. One interesting conclusion they draw is that ‘global spillover specifications, unless theoretically motivated, are difficult to justify or have been overused in applied studies’ (Elhorst and Vega Reference Elhorst and Vega2013: 11). In a more recent study, Wimpy et al. (Reference Wimpy, Whitten and Williams2020) review applied research in political science that has used spatial models and over-relied on the SAR when, in fact, this was not the most accurate spatial model for the given theoretical account. In line with Elhorst and Vega's call to reconsider the SLX model as a starting point, Wimpy et al. show ‘even if the true GDP is SAR, the SLX performs quite well at detecting spatial relationships; […] the same cannot be said of the SAE when the true DGP is the SLX’ (Wimpy et al., Reference Wimpy, Whitten and Williams2020: 33).
As we have stressed earlier, this brief paper is just a teaser. We strongly advise reading the books by Darmofal (Reference Darmofal2015) and Ward and Gleditsch (Reference Ward and Gleditsch2018), which are written specifically for political scientists. What is likely to be the most significant and most demanding part of the learning curve will be how to deal with spatial data, their spatial merging and defining the W matrices. Learning how to run apt tests and estimators will also be a central component of the learning curve, but we believe it will be rewarding.
Funding
The research received no grants from public, commercial, or non-profit funding agency.
Acknowledgements
We thank the RISP editors and two anonymous reviewers for their comments.