Introduction
Glucose and lactate represent two important metabolites and indicators of physiological function. Lactate, the deprotonated form of lactic acid, is one of the most important markers of tissue oxygenation; consequently, it is a useful physiological parameter to diagnose wellness in sport or healthcare.[Reference Phypers1] Measurement of glucose levels is of great interest for monitoring cellular metabolism, as glucose is a key energy source, and also an indicator of glycemia in diabetics. Both these metabolites are involved in the energy cycle during exercise. When glucose is consumed in anaerobic conditions, the proton shuttle performed by nicotinamide adenine dinucleotide (NAD) co-enzymes is not sufficient and, as a result, lactate is produced.[Reference Phypers1] Thus, measuring glucose and lactate levels before, during, and after exercise is a good way to characterize how intensive is the physical effort in order to adapt the training. Commercially available devices such as I-Stat® and the lactate SCOUT®, allow measurement of those two metabolites via blood sampling. Measurements in blood require a finger prick or, for continuous measurements, the insertion of a device under the skin. In addition to requiring invasive techniques to gain access to sample, blood contains numerous other species known to interfere with standard tests.[Reference Maidan and Heller2] Sensing glucose and lactate in different media could allow easier, non-invasive sensing, especially for continuous measurements. To this end, several approaches have been explored to detect lactate or glucose using amperometry-based methods, with different samples such as saliva,[Reference Kim, Valdes-Ramirez, Bandodkar, Jia, Martinez, Ramirez, Mercier and Wang3] tears,[Reference Yao, Shum, Cowan, Lahdesmaki and Parviz4, Reference Thomas, Lähdesmäki and Parviz5] or sweat,[Reference Khodagholy, Curto, Fraser, Gurfinkel, Byrne, Diamond, Malliaras, Benito-Lopez and Owens6, Reference Jia, Bandodkar, Valdes-Ramirez, Windmiller, Yang, Ramirez, Chan and Wang7] obviating the need for invasive sampling. Sensing is performed using the appropriate redox enzyme (such as glucose oxidase and lactate oxidase), which oxidizes the analyte and transfers an electron through a mediator (such as ferrocene or hydrogen peroxide) to the working electrode.
In recent years, organic electrochemical transistors (OECTs) were developed as alternatives to classical electrochemical detection. First described by White and Wrighton,[Reference White and Wrighton8] they represent a very promising transducer for biosensing,[Reference Strakosas, Bongo and Owens9] especially the sensing of metabolites using redox enzymes.[Reference Bernards, Macaya, Nikolou, DeFranco, Takamatsu and Malliaras10–Reference Tang, Yan, Lin, Xu and Chan13] These devices consist of a conducting polymer channel (with source and drain contacts at opposite ends) and a gate electrode, both in contact with the media of interest. Poly(3, 4-ethylene dioxythiophene) doped with poly(styrene sulfonate) (PEDOT:PSS) has been extensively used both as the channel and as the gate, due to its high conductivity,[Reference Elschner, Kirchmeyer, Lövenich, Merker and Reuter14] commercial availability, biocompatibility,[Reference Owens and Malliaras15] and stability at neutral pH. Moreover, it is compatible with mechanically flexible supports, which is of paramount importance for cutaneous recordings. In the most commonly used configuration, a bias is applied at the gate (V GS) and at the drain (V DS) with respect to the source, and the drain current (I DS) is measured. The gate is used as the working electrode, in which mediator molecules deposit electrons [Fig. 1(a)], thereby changing the potential at the gate/media interface according to the Nernst equation.[Reference Bernards, Macaya, Nikolou, DeFranco, Takamatsu and Malliaras10] Since the gate bias is held constant, the potential at the media/channel interface changes as well, which results in a variation of the drain current by:[Reference Bernards, Macaya, Nikolou, DeFranco, Takamatsu and Malliaras10]
 $$\Delta {I_{{\rm DS}}} = {g_{\rm m}} \cdot \Delta {V_{{\rm GS}}} = {g_{\rm m}} \cdot \displaystyle{{{\rm kT}} \over e} \cdot \ln [C],$$
where g m is the transconductance of the device and C is the concentration of the mediator molecules contributing electrons to the gate. Interest in OECTs comes from their high transconductance (in the mS range),[Reference Khodagholy, Rivnay, Sessolo, Gurfinkel, Leleux, Jimison, Stavrinidou, Herve, Sanaur, Owens and Malliaras16, Reference Rivnay, Leleux, Sessolo, Khodagholy, Herve, Fiocchi and Malliaras17] which leads to large signals that are easy to measure. Moreover, OECTs offer simple fabrication and straightforward integration into printing processes compatible with low-cost industrial fabrication, including ink-jet printing,[Reference Basiricò, Cosseddu, Scidà, Fraboni, Malliaras and Bonfiglio18] flexography,[Reference Kaihovirta, Mäkelä, He, Wikman, Wilén and Österbacka19] and screen-printing,[Reference Andersson Ersman, Nilsson, Kawahara, Gustafsson and Berggren20] on substrates, including plastic and paper.[Reference David Nilsson, Svensson and Berggren21]
(a) Schematic representation of the OECT enzymatic sensor and the enzymatic reaction mechanism. (b) Photograph of the corresponding wafer with an OECT biosensor in inset.

A key issue in OECT-based enzymatic sensors is the immobilization of the reagents (enzyme and mediator). In the vast majority of work reported in literature, these are dissolved in an electrolyte solution before the media is added.[Reference Bernards, Macaya, Nikolou, DeFranco, Takamatsu and Malliaras10, Reference Shim, Bernards, Macaya, Defranco, Nikolou, Owens and Malliaras11, Reference Yang, Cicoira, Byrne, Benito-Lopez, Diamond, Owens and Malliaras22] Although this is adequate for laboratory demonstration, it is not compatible with the fabrication of wearable sensors. In this paper, we report glucose and lactate biosensors based on printed OECTs with an organically modified sol–gel electrolyte in which the mediator is covalently bound and the enzyme is entrapped. We chose an organically modified sol–gel electrolyte, as these materials have been shown to prevent the deterioration of the tertiary protein structure,[Reference Tan and Miao23] and to provide adequate mechanical properties.[Reference Xu, Chen and Dong24] Moreover, we used a commercially available PEDOT:PSS dispersion without any modification. The resulting devices were capable of measuring glucose and lactate concentration in a range that is relevant for detection in biological media, and were validated for lactate sensing in human sweat. This work paves the way for the development of OECT-based biosensors obtained with printing-only techniques.
Experimental
Reagents
Polyethylene naphtalate (PEN, TEONEX Q65FA) and gold were purchased from Dupont Teijin, PEDOT:PSS (Clevios SV3) was purchased from Heraeus, Silver Ink (HPS-021) was purchased from Novacentrix, polyvinylidene fluoride trifluoroethylene (PVDF) was provided from Arkema, Chitosan (low Mw, 80% deacetylated), ferrocenecarboxaldehyde (98%), trimethoxymethylsilane (MTMOS, 98%), glucose oxidase (GOx, EC 1.1.3.4), lactate oxidase (LOx, EC 1.13.12.4), L-(+)-lactic acid solution (90%), and glucose were purchased from Sigma-Aldrich and used without further purification. All other reagents were of analytical grade and used without further purification.
OECT fabrication
PEN TEONEX Q65FA from Dupont Teijin was used as a substrate. A thin layer (30 nm thick) of gold was sputtered and then etched to define electrical interconnects [Figs. 1(a) and 1(b)]. The first layer (PEDOT: PSS) was deposited by screen printing to a thickness of 500 nm and was then annealed at 130 °C for 30 min. The second layer, which was a dielectric based on poly(vinylidene fluoride) (PVDF), was also printed and then cured at 100 °C for 5 min. The final thickness of the layer was 2 µm. Finally, we deposited a silver paste by screen printing for electrical connections. It was annealed at 100 °C for 30 min, and had a thickness about 8 µm.
Glucose and lactate measurements
A 0.1 wt% chitosan–ferrocene solution was prepared by dissolving a ferrocene-branched chitosan derivative synthesized as described previously[Reference Yang, Zhou and Sun25] in 0.05 m HCl heated at 80–90 °C for 2–3 h. Once the flakes were completely dissolved and the solution cooled at room temperature, the pH was adjusted to ~5.3 using NaOH. The organically modified sol–gel/chitosan composite was prepared freshly before use, as described elsewhere.[Reference Xu, Chen and Dong24] Briefly, stock sol solution was prepared by mixing MTMOS with deionized water at a one-fourth ratio, 10% ethanol (v/v%), and 3.3% 0.01 m HCl (v/v%). When not in used, the solution was stored at 4 °C. A 20 µL GOx solution (60 mg/mL) or lactate oxidase (Lox) solution (50 U/mL) was mixed with 60 µL of the chitosan–ferrocene solution followed by 40 µL of the stock sol solution. A volume of 6 µL of the resulting solution was then drop-cast on the surface of the transistor to cover the whole area designed for the electrolyte [Figs. 1(a) and 1(b)]. The resulting sensor was then left to dry at 4 °C and tested in the following days. Sweat samples were collected in a compartment placed in the back of subjects during exercise. Electrochemical measurements, CV, and amperometry were performed with an Autolab (Eco Chemie, the Netherlands) with a PGSTAT128N potentiostat and Nova 1.10 software. Output, transfer characteristics and current versus time curves were recorded using two Keithley 2400 SMUs with custom LabVIEW software.
Results and discussion
OECT characterization
OECTs with the structure shown in Fig. 1 were fabricated by screen printing techniques using three different pastes: a PEDOT:PSS paste was used for the channel and gate, a PVDF paste (not shown in the schematic) was used to insulate the contacts and to define the area of contact between the electrolyte and the channel/gate, and a silver paste was used to make electrical connection pads [Fig. 1(b)]. The electrolyte was composed of an organically modified sol–gel using a ferrocene-branched chitosan, and contained the enzyme. This gel was drop-cast on top of the device, covering the area left open by the PVDF. It should be noted that prior to characterization of the printed OECT sensors, we characterized the reagent containing electrolyte using a three-electrode electrochemical assembly (Supplementary Information) and found it to be responsive to the two metabolites.
The output characteristics of the printed OECT are shown in Fig. 2. The OECT used had a channel width (W ch) of 0.5 mm, a gate width (W g) of 1 mm, and a channel (L ch) and gate (L g) length of 5 mm.
(a) Output characteristics of an OECT (W ch = 0.5 mm, W g = 1 mm, L ch = L g = 5000 µm) for gate voltages V GS = −0.1–1 V, and (b) the corresponding transfer and transconductance curves for V DS = −0.1 V.
The data show that upon application of a gate bias, positive ions present in the electrolyte penetrate in the channel and de-dope it, creating a decrease in the source–drain current. This drain current decrease is consistent with operation in the depletion mode.[Reference Bernards and Malliaras26] The corresponding transfer curve is shown in Fig. 2(b). The transistor reaches a transconductance of ~17 µS, consistent with a small W ch/L ch ratio.[Reference Rivnay, Leleux, Sessolo, Khodagholy, Herve, Fiocchi and Malliaras17]
Sensor calibration and metabolite sensing
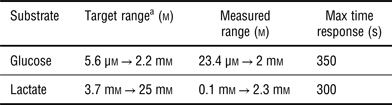
Before addition of glucose or lactate, the source electrode was grounded, the channel of the transistor was biased by applying −0.1 V at the drain, while +0.4 V was applied at the gate. According to the standard model,[Reference Bernards, Macaya, Nikolou, DeFranco, Takamatsu and Malliaras10] the applied gate voltage drops partly at the gate/electrolyte interface, where it drives the oxidation of the ferrocene mediator, and partly at the electrolyte/channel interface, where it dictates cation flow into the channel. The more mediator there is to be oxidized, the higher is the voltage that drops at the electrolyte/channel interface, and the lower is the drain current. This is shown in Fig. 3, where the normalized response (100|ΔI/I|) of the transistor after successive additions of glucose and lactate is displayed. We used lactate concentrations from 20 µm to 10 mm and glucose concentrations from 1 µm to 20 mm in order to cover physiological range in sweat (Table I). Each test started with 3 min of stabilization of the sensor after application of 0.4 V gate bias. Shortly after this delay, small additions of 0.1 m phosphate buffer saline (PBS) were added in the electrolyte as a control, followed by addition of the metabolite solutions. The normalized response increases until it reaches a plateau, indicating that a steady-state analyte concentration is reached in the electrolyte layer.
Measurement of the normalized response of the drain current (100|ΔI/I|) for a drain voltage V DS = −0.1 V and V GS = 0.4 V, upon addition of 50 µm, 100 µm, 200 µm, 300 µm, 600 µm, 1 mm, 2 mm, and 3 mm of glucose (a) and 65 µm, 100 µm, 215 µm, 365 µm, 740 µm, 1 mm, 1.5 mm, 2.25 mm, and 3 mm of lactate (b). Normalized response of the sensor as a function of concentration of glucose (c) and lactate (d).
Summary of the performances obtained for glucose and lactate sensing.
a In sweat.[Reference Harvey, LeBouf and Stefaniak27]
The calibration curves for the two devices are shown in Figs. 3(c) and 3(d), and the relevant parameters are summarized in Table I. For glucose, where the desired detection range extends from 5.6 µm to 2.2 mm,[Reference Harvey, LeBouf and Stefaniak27] the printed sensors capture the high-end of the range but require four times lower limit of detection to completely cover this range. For lactate, where the desired detection range extends from 3.7 to 25 mm,[Reference Harvey, LeBouf and Stefaniak27] the printed sensors capture the low-end of the range, but a tenfold improvement is required at the saturation concentration.
The high-end of the range can also be addressed by dilution. This was demonstrated using human sweat. As indicated by the first arrow in Fig. 4, the addition of a 1 µL sweat sample, diluted five times in 0.1 m PBS, causes an increase in the normalized response of the transistor. For this experiment, the well was prefilled with 7 µL of PBS, hence the lactate concentration in the sweat sample can be estimated to be 16.9 ± 2 mm, which falls within the expected range of values. The subsequent additions of 1 µL undiluted sweat samples (second and third arrows), bring the device to saturation.
Measurement of the normalized response of the drain current (100|ΔI/I|) for V DS = −0.1 V and V GS = 0.4 V upon addition of 1 µL of five times diluted sweat sample and two times 1 µL of undiluted sweat sample.
Optimization of the dynamic range of the printed sensors can take place through tuning the transistor geometry, the thickness of the reagent-containing electrolyte, and the loading of the latter with enzyme and/or mediator. Along with such studies, the further issues that must be addressed as a next step are the stability of the device during prolonged storage and operation, as well as the influence of interfering species typically found in media such as ascorbic acid.[Reference Harvey, LeBouf and Stefaniak27]
Conclusions
In summary, we demonstrated the detection of glucose and lactate with an OECT obtained via screen printing. The transistor used a solid electrolyte that contained the reagents, and was able to detect glucose and lactate in small volumes of media and with limits of detection that are consistent with epidermal applications. Current research is focused on printing the electrolyte in order to obtain fully printed OECT biosensors.
Supplementary materials
For supplementary material for this article, please visit http://dx.doi.org/10.1557/mrc.2015.52
Acknowledgments
We are grateful to Laurent Tournon for his help in designing the layout of the OECTs. This work was partially supported by Labex ARCANE (grant number ANR-11-LABX-0003-01).