


Introduction
Austfonna ice cap is the largest ice mass in Svalbard, and the second largest in the European Arctic. Most of its boundary is calving and several of the outlet glaciers are of surge type (Reference DowdeswellDowdeswell, 1986; Reference Hagen, Liestøl, Roland and JørgensenHagen and others, 1993). It therefore has the potential to discharge large volumes of icebergs into the Barents Sea (Reference DowdeswellDowdeswell, 1989). This aspect is important, since a possible melting–sliding feedback (Reference Zwally, Abdalati, Herring, Larson, Saba and SteffenZwally and others, 2002) may lead to enhanced calving fluxes under a warming climate, thereby considerably exceeding the previously estimated rate of ice loss (Reference Rignot and KanagaratnamRignot and Kanagaratnam, 2006). Previous glaciological investigations (e.g. Reference SchyttSchytt, 1964; Reference Dowdeswell and DrewryDowdeswell and Drewry, 1989; Reference Pinglot, Hagen, Melvold, Eiken and VincentPinglot and others, 2001) have collected a range of different observations. However, uncertainty remains about the present state of balance of the largest ice mass on Svalbard and its possible response to climate change.
Repeated airborne laser altimetry (Reference Bamber, Krabill, Raper and DowdeswellBamber and others, 2004) indicated an elevation increase in the central parts of the ice cap and lowering towards the margins. This pattern of marginal thinning, while the centre seems to be in balance or even growing, has also been observed on the Greenland ice sheet (e.g. Reference KrabillKrabill and others, 2000; Reference Johannessen, Khvorostovsky, Miles and BobylevJohannessen and others, 2005). Reference Bamber, Krabill, Raper and DowdeswellBamber and others (2004) attributed the observed elevation change of Austfonna between 1996 and 2002 to a possible increase in accumulation caused by the enhanced moisture flux following the observed decline of perennial sea ice around Nordaustlandet. Considering the long-term net accumulation rate from 1963 to 1999 (Reference Pinglot, Hagen, Melvold, Eiken and VincentPinglot and others, 2001; Reference Hagen, Melvold, Pinglot and DowdeswellHagen and others, 2003), Reference Raper, Bamber and KrabillRaper and others (2005) estimated the magnitude of this increase as 35–40%. Elevation changes of glaciers and ice caps can be related to both variations in surface mass balance and changes in glacier dynamics. Several outlets from Austfonna are of surge type (Reference DowdeswellDowdeswell, 1986), and calving represents a considerable part of Austfonna’s overall budget (Reference Hagen, Melvold, Pinglot and DowdeswellHagen and others, 2003). Since reliable estimates of the calving rates and glacier dynamics are lacking, there is still considerable uncertainty about the origin of elevation changes of Austfonna.
Within the framework of CryoSat calibration and validation activities, we started annual field visits to Austfonna in 2004. To ground-truth remotely sensed elevation changes, ground measurements were conducted, using global positioning system (GPS) profiling (Hagen and others, unpublished information) across the ice cap. In addition, data were collected on snow distribution (Reference TaurisanoTaurisano and others, 2007), meteorology, surface mass balance (SMB) and glacier dynamics. Early snow accumulation measurements (Reference SchyttSchytt, 1964) and net accumulation figures that were derived from shallow cores (Reference Pinglot, Hagen, Melvold, Eiken and VincentPinglot and others, 2001) showed different gradients for different sectors on the ice cap. It is obvious that assessing the specific glacier surface balance using a simple distribution of SMB with elevation would be inappropriate. In this paper, we present a distributed SMB model for Austfonna and evaluate its performance as a diagnostic tool to interpolate the scarce mass-balance measurements in space and time. We present a multi-criteria procedure which was employed to achieve an optimal representation of the field data by the model. In contrast to previous mass-balance estimates which were inferred from balance gradients in the accumulation area, we present here the first estimate of the surface mass balance of Austfonna that is based on field observations of both accumulation and ablation.
Field Observations
The centre of Austfonna is located at 79.7˚ N, 24.0˚ E, and, with an area of 8120 km2, the ice cap covers much of Nordaustlandet, the northeastern island of the Svalbard archipelago. The ice cap has a maximum elevation of about 800 ma.s.l., a thickness up to about 560 m (Reference Dowdeswell, Drewry, Cooper, Gorman, Liestøl and OrheimDowdeswell and others, 1986) and a relatively simple geometry, characterized by one main dome feeding a number of drainage basins (Reference DowdeswellDowdeswell, 1986).
On the ice cap, we maintain two automatic weather stations (AWSs) at 360 and 540ma.s.l. (Fig. 1). The stations record time series of air temperature and humidity, wind speed and direction at hourly intervals. Additionally, at the lower AWS, measurements of the radiation components enable a detailed study of the point energy balance (Reference LoeLoe, 2005). The data record of the lower AWS was interrupted for about 2 months due to low battery voltage at the end of February 2005, while the other AWS has a complete record from 29 April 2004 to 23 April 2005.
Location map of Nordaustlandet island with Austfonna. The insert shows the location of the island within the Svalbard archipelago. Dots denote the locations of mass-balance stakes; filled symbols refer to stakes where measurements were performed; the other stakes (open symbols) could not be visited. The stars indicate locations of the AWSs. Contour lines show elevation (m a.s.l.), interval is 50 m.

Characteristic of its location in the high arctic is the short duration when daily mean temperature on Austfonna is above 0˚C (Fig. 2). At the same time, since Svalbard is located at the present northern extremity of the warm North Atlantic current, air temperature seldom drops below –30˚C, and variations during winter are large; temperatures frequently approach the melting point in the middle of winter (Fig. 2).
Meteorological input data used to drive the mass-balance model. The top panel shows the diurnal precipitation at Ny-lesund, and the bottom panel shows daily mean temperatures recorded at 540ma.s.l. on Austfonna.

The dominant precipitation direction for Austfonna is from the east (e.g. Reference Førland, Hanssen-Bauer and NordliFørland and others, 1997), and the major moisture source in that direction is the ice-free part of the Barents Sea. This explains the general pattern of snow accumulation across the ice cap, which shows a pronounced gradient from high values in the southeast to lower values in the northwest (Reference SchyttSchytt, 1964; Reference Pinglot, Hagen, Melvold, Eiken and VincentPinglot and others, 2001; Reference TaurisanoTaurisano and others, 2007). The distribution of snow thickness is measured using extensive ground-penetrating radar (GPR) profiling (Reference Pinglot, Hagen, Melvold, Eiken and VincentPinglot and others, 2001; Reference TaurisanoTaurisano and others, 2007), and the snow water equivalent (SWE) is assessed from density measurements in snow pits. Although the magnitude of accumulation varies considerably from year to year, Reference TaurisanoTaurisano and others (2007) found that the pattern of the snow distribution is fairly stable, and developed an index map to describe the spatial distribution of accumulation (Fig. 3).
The accumulation-index map used to distribute snow precipitation across Austfonna. Values are dimensionless and relative to the mean accumulation across the entire ice cap. See Reference TaurisanoTaurisano and others (2007) for details. Contour lines show elevation (m a.s.l.); interval is 50 m.

Currently, we maintain a network of 19 stakes distributed across the ice cap (Fig. 1), 10 of which were successfully measured in spring 2004 and spring 2005, affording point SMB figures for that period. The winter balance is directly given by the SWE of the winter snow, and the surface net balance is assessed from changes in stake height above the previous summer surface and the SWE. In addition, we operate two sonic rangers (SRs) at the AWS to record surface displacement at diurnal intervals. Once the winter snow has disappeared, the known ice density of 917 kgm–3 allows the conversion of the displacement record into a time series of melting (in mw.e.).
Mass-Balance Model
Model structure
To simulate the SMB of Austfonna over the period 29 April 2004 to 23 April 2005, we apply a distributed mass-balance model to a digital elevation model (DEM) of 250m resolution. The model is initiated using the snow distribution observed in spring 2004 and is forced by meteorological data, air temperature and precipitation, in daily time-steps. We use an enhanced temperature-index method to calculate ablation (Reference HockHock, 1999), in which we compute melt M (mm) as a function of positive air temperature (Equation (1)). In contrast to the classical degree-day model (e.g. Reference Braithwaite and ZhangBraithwaite and Zhang, 1999), this method takes into account topographical effects on M by including potential solar radiation I (Wm–2) (Reference HockHock, 1999, Reference Hock2005):

Here, T denotes the air temperature (˚C), mf is a constant melt factor (mm d–1 K–1), and a snow and a ice are radiation coefficients (mmm2W–1 d–1 K–1), different for snow and ice. This approach has been previously applied to model distributed meltwater production (e.g. Reference HockHock, 1999; Reference Schuler, Fischer, Sterr, Hock and GudmundssonSchuler and others, 2002, Reference Schuler, Melvold, Hagen and Hock2005a) and distributed mass balance (e.g. Reference SchulerSchuler and others, 2005b). Potential clear-sky solar radiation is approximated by standard algorithms on insolation geometry and topography. Air temperature is distributed to each gridcell of the DEM using a mean lapse rate of –0.0044 Km–1 derived from the data records of the two AWSs.
Accumulation is computed from precipitation by using a threshold temperature of 1˚C to discriminate between rain and snow. Snowfall was distributed spatially using the index map (Fig. 3) derived by Reference TaurisanoTaurisano and others (2007). In doing so, an accumulation weighting factor is described as a linear function of the three spatial coordinates easting, northing and elevation. To provide the timing of precipitation over Austfonna, we have developed a non-dimensional precipitation time series using the precipitation data of the nearest synoptic weather station at Ny-Ålesund (Fig. 2a; data: http://eklima.met.no). This time series was then scaled such that its annual sum equalled the mean accumulation of 840 mmSWE observed in May 2005.
Meltwater retention due to refreezing processes and its contribution to mass balance was considered by employing a simple approach. The P MAX coefficient (Reference ReehReeh, 1991) describes the fraction of winter accumulation that is refrozen over the course of an ablation season, and its value has to be determined empirically. In this study, we do not further discriminate between pore-water refreezing in the snowpack (e.g. Reference Pfeffer, Illangasekare and MeierPfeffer and others, 1990) and the formation of superimposed ice (e.g. Reference Wadham and NuttallWadham and Nuttall, 2002) but refer to refrozen meltwater as superimposed ice (SI). Formation of SI is implemented in our model as follows: At the beginning of the melting season, P MAX was applied to the amount of snow cover to determine the local refreezing potential. Further, we assume that refreezing occurs instantaneously; hence, at each time-step (Δt = 1 day), modelled snowmelt is retained and refreezes to SI until the local refreezing potential is reached. Further melt then contributes to ablation.
To test the impact of refreezing on SMB, we conducted two model experiments, one by neglecting refreezing and setting P MAX = 0 and the other by adopting the established value P MAX = 0.6 (Reference ReehReeh, 1991).
Parameter choice and calibration procedure
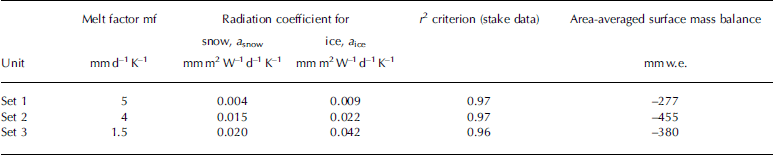
The model formulation involves a range of parameters, the values of which have to be determined empirically. In doing so, we optimized the parameter values with respect to a selected performance criterion. In a first step, we used the agreement between modelled and observed net mass balance at the stake locations as a single criterion. However, preliminary tests revealed that an equally good agreement could be achieved for a range of different parameter combinations. Considering only a single criterion, it could not be decided which of these combinations was superior to another, and the combinations have to be considered equally valid. However, the specific mass balance derived from model runs using the different parameter combinations differed significantly. Table 1 illustrates a sample of three different parameter combinations that perform comparably in reproducing stake data but yield very different estimates for the specific mass balance with deviations of up to 40%. Reference BevenBeven (1993) introduced the term ‘equifinality’ to recognize there may be no single, correct set of parameter values for a given model and that different parameter sets may give acceptable model performance. A way to counter this problem is by using multi-criteria optimization, i.e. testing the model performance vs several different criteria, thereby reducing the parameter uncertainty.
Non-unique parameter values with respect to a single evaluation criterion but resulting in different specific mass-balance estimates
The calibration of parameter values was accomplished by adopting a manual procedure by which parameter values were varied within reasonable limits. In doing so, we aim at the set of parameters that maximizes the agreement between observations and corresponding model output for a range of different criteria. We use three different criteria to evaluate the parameters of Equation (1). A fourth criterion validates the accumulation scheme. Comparison of measured and modelled net mass balance at the stake locations served in a first step to check the model performance in terms of correctly reproducing the magnitude and altitudinal distribution of mass balance (hereafter termed ‘criterion 1’). In a next step, we also used time series of ice melt that were derived from SR data to control whether the model captures the temporal evolution of ice melt (‘criterion 2’). Further, we take the bright area at higher elevations of Austfonna seen in a moderate-resolution imaging spectroradiometer (MODIS) image of 10 August 2004 as the area covered by firn or snow. Control on the parameter determining snowmelt was then provided by visually comparing the satellite image to the modelled extent of the snow cover at the corresponding date (‘criterion 3’). Finally, the distribution of new snow at the end of the modelling period was compared to the distribution of SWE obtained by GPR along profile lines in May 2005 (Reference TaurisanoTaurisano and others, 2007) to test the accuracy of the accumulation scheme (‘criterion 4’).
Results
Using multiple-criteria evaluation proved to be helpful in constraining parameter values and in testing assumptions inherent in the model formulation. When neglecting refreezing (P MAX = 0), we found that parameters can be optimized such that any pairwise combination of the three criteria was satisfied but never all three at the same time (Table 2). If snowmelt was reproduced correctly (i.e. criterion 3 satisfied; cf. Fig. 4a and b), optimizing parameter values with regard to criteria 1 and 2 revealed parameter combinations that could explain either criterion 1 or criterion 2. If net balance at the stakes was reproduced well, melt time series were underestimated (case 1 in Table 2; Fig. 5a). Conversely, the ice melt rate could be simulated well, but then the modelled net balance at the stake became too negative (case 2; Fig. 5b). On the other hand, satisfaction of both the stake and the SR criteria could be achieved (Fig. 5c) at cost of the satellite criterion (case 3; Fig. 4c). Once refreezing was taken into account by using a constant P MAX = 0.6, the model performed well with respect to all three criteria, stake data, SR time series as well as satellite observed snow-cover extent (case 4; Figs 4a and b and 5c).
Visual comparison of a MODIS image of 10 August 2004 (a) and the modelled extent of snow and firn for 10 August 2004 (snow and firn in grey): (b) best fit, and (c) due to incorrect snowmelt parameterization. See text for details. The stippled lines delineate the modelled accumulation area. The difference between the accumulation area and the snow/firn area visible in (a) and (b) is due to extensive formation of superimposed ice, especially in the southeast part of the ice cap. Contour lines show elevation (m a.s.l.), interval is 100 m.

Evaluating the model performance using scatter plots of modelled vs measured net mass balance at the stake locations (left column) and comparison of calculated and observed time series of melt (right column). Situations (a) and (b) were calculated neglecting refreezing (P MAX = 0). (a) shows a good estimate of the melt rate, but the modelled net balance is too negative. In contrast, the parameters used to calculate (b) yield a good correlation between modelled and measured net balance but underestimate the melt rate. (c) displays the model performance using the optimized parameter set, and refreezing is taken into account. Day 200 in 2004 corresponds to 18 July 2004.

Scheme showing the evaluation of model performance using multiple criteria. The symbols + and – indicate good or bad agreement with the respective criterion

Table 3 presents optimized parameter values for our best fit (case 4) using P MAX = 0.6. Also shown are the resulting quality estimates against which the performance was evaluated. Independent of Equation (1), criterion 4 evaluates the modelled snow distribution at the end of the calculation period using the winter accumulation measured along a number of profile lines in May 2005 (r 2 = 0.79).
Optimized parameter values of the best-fit model using multiple criteria

Calibrated that way, the model performs well with respect to the tested criteria, and results suggest that the specific net surface balance of Austfonna for the season 2004/05 was negative (–318mmw.e.). Figure 6 displays the SMB not linearly distributed with elevation, as, especially in the north of the ice cap, the calculated equilibrium line does not follow the broad topography as it does on the southeast-facing side.
The modelled distribution of surface mass balance for the period 29 April 2004 to 23 April 2005. The overall net balance is –318 mm. Accumulation is shown in light grey, and ablation is represented in dark grey. Dots indicate the locations of mass-balance stakes. Contour lines show elevation (m a.s.l.); interval is 100 m.

Concluding Discussion
In our model, the timing of precipitation was derived from a synoptic station >200km to the west of Austfonna and is therefore probably incorrect. However, the agreement between modelled and measured snow distribution (criterion 4) suggests that the influence of erroneous timing is small. The accumulation pattern is mainly responsible for the asymmetric distribution of SMB (Fig. 6) mentioned above. In the model, temperature and therefore melting are distributed directly with elevation, whereas accumulation has a more complex pattern (Fig. 3). This influence is further visible in Figure 4 where the snowline does not follow the topography on the northwest side as it does on the southeast slope.
Using a range of different criteria, the model performance was evaluated and the parameters in Equation (1) were optimized such that all aspects of the observational data were reproduced as well as possible. The good agreement between modelled and measured net balances, between simulated ice-melt rates and SR time series and between modelled and observed snow-cover extent suggests that the processes governing ablation were adequately parameterized.
Experiments prescribing different values of P MAX revealed that neglecting refreezing processes leads to a systematic deviation between modelled and observed mass balance, if ice- and snowmelt were reproduced correctly. This can be explained by recognizing that a part of the meltwater refreezes and has to be melted another time, thereby reducing ablation. Where SI remains after the melting season, the glacier has accumulated mass, although the winter snow disappeared. We conclude that refreezing processes represent a significant, positive contribution to the SMB of Austfonna and have to be considered.
Reference ReehReeh (1991) prescribed the fraction of winter snow that refreezes using a constant P MAX = 0.6, while Reference Woodward, Sharp and ArendtWoodward and others (1997) relate P MAX to mean annual air temperature. We have tested both approaches. Applied to Austfonna data, the Woodward formula yields P MAX values of <0.2, a value that is too low to account for the discrepancy between melting and net ablation. A detailed energy-balance study at the site of one of the AWSs suggests that, at least locally, refreezing has the same magnitude as winter accumulation, hence P MAX≈1 (Reference LoeLoe, 2005). We explain these differences by the fact that the empirical Woodward model was developed for a different glacier. At Austfonna, relatively low accumulation in conjunction with low winter temperatures efficiently cools the snow and ice such that a high proportion of the winter snow cover has to refreeze to remove its cold content. It was found that using a constant P MAX = 0.6 is necessary to satisfy criteria 1, 2 and 3 simultaneously and thereby to account for the difference between melting and ablation.
One may argue that the effect of P MAX = 0.6 is equivalent to using a snow reduced by a factor of 0.6. This corresponds actually to case 3 in Table 2. A good match of modelled and observed mass balances can be achieved, but as a result of a misrepresentation of the physical processes where erroneously reduced snowmelt compensates for neglecting the effects of refreezing. This misrepresentation is uncovered by testing the modelled snow-cover extent vs the satellite image. To achieve a sufficiently large accumulation area, the model exhibits a snow extent that is much larger than the observed one, thus revealing the inappropriateness of neglecting refreezing. This example demonstrates the examining power of a multi-criteria evaluation to scrutinize the model performance. In addition, it shows the usefulness of remotely sensed data for mass-balance modelling (e.g. Reference Braun, Schuler, Hock, Brown and JacksonBraun and others, in press).
The optimized model suggests that the specific net surface balance of Austfonna for the season 2004/05 was negative (–318mmw.e.; Fig. 6). The good agreement between observations and corresponding model output substantiates the reliability of this estimate for Austfonna’s specific SMB. However, our estimate deviates from that of previous studies (Reference Pinglot, Hagen, Melvold, Eiken and VincentPinglot and others, 2001; Reference Hagen, Melvold, Pinglot and DowdeswellHagen and others, 2003), which suggested Austfonna’s SMB was in equilibrium. Correspondingly, the accumulation area in the model is considerably smaller than that shown on the map of Reference Pinglot, Hagen, Melvold, Eiken and VincentPinglot and others (2001) and also smaller than the area of elevation increase observed by Reference Bamber, Krabill, Raper and DowdeswellBamber and others (2004). However, we have to bear in mind that our specific balance figure refers to a single year, while other estimates represent an average value over several years. The ice-core estimate of Reference Pinglot, Hagen, Melvold, Eiken and VincentPinglot and others (2001) represents an average value from 1986 to 1999. Comparing the net SMB of midtre Lovén-breen, Svalbard, in 2004 (–970mmw.e.) to the 1986–99 average (–310mmw.e.) reveals that it was more than three times as negative (Kohler, unpublished information). In fact, 2004 was the most negative year in the record. This is confirmed by measurements at other glaciers on Svalbard. Given the year-to-year variability in climate, it is clear that the SMB of a single year may be quite different from the long-term average.
Acknowledgements
This work was carried out with support from the CryoSat Calibration and Validation project (European Space Agency contract n.C90118), from SPICE (Space borne measurements of Arctic glaciers and implications for sea level) (EU contract No. EVK2-2001-00262) and INTEGRAL (Interferometric Evaluation of Glacier Rheology and Alterations) (EU contract No. SST3-CT-2003-502845). Comments by R. Hock, the editor J. Dowdeswell and two anonymous reviewers helped to improve a previous version of this paper and are highly appreciated.



