Introduction
Heavy metals and dyes in wastewater are the dangerous pollutants, originating in large quantities from metal plating facilities, paints and pigments manufacturing, textile as well as pulp and paper industries [Reference Visa, Bogatu and Duta1, Reference Hernandez-Montoya, Perez-Cruz, Mendoza-Castillo, Moreno-Virgen and Bonilla-Petriciolet2]. According to the list of priority pollutants of the US Environmental Protection Agency (EPA), chromium ions represent a serious problem for the human health because they are not biodegradable and tend to accumulate in living organisms causing several diseases that affect the kidney, nervous, hematopoietic, and gastrointestinal systems of humans [Reference Hsu and Guo3, Reference Argun and Dursun4]. Additionally, some dyes discharged from the textile, printing, and tanning industries commonly are toxic, no degradable, stable, and even carcinogenic, causing deterioration in water quality, influencing the photosynthetic activity of aquatic organism [Reference Ömeroğlu Ay, Safa Özcan, Erdoğan and Özcan5]. Therefore, it is urgent to find an efficient and cost-effective method to remove these pollutants [Reference Deng, Zhang, Zeng, Gong, Niu and Liang6].
Nowadays, some treatment processes are used for the removal of heavy metals and dyes from wastewater, including ion-exchange, adsorption, membrane filtration, coagulation, and flocculation [Reference Crini7, Reference Fu and Wang8]. However, ion-exchange is expensive and accumulation of concentrated sludge caused by ion-exchange creates a disposal problem although the heavy metal ions and dye molecules are removed. There is also the possibility that a secondary pollution problem will arise because of excessive use of chemicals [Reference Taffarel and Rubio9, Reference Ostroski, Barros, Silvab, Dantas, Arroyo and Lima10]. This technique, membrane filtration technology, is restricted by process complexity, high cost, membrane fouling, and low permeate flux [Reference Landaburu-Aguirre, García, Pongrácz and Keiski11]. Moreover, coagulation–flocculation involves chemical consumption, high sludge production, and disposal problems [Reference Bratskaya, Volk, Ivanov, Ustinov, Barinov and Avramenko12].
Amongst the numerous techniques of dye removal, adsorption is considered as a fast, effective, and relatively inexpensive approach for wastewater treatment [Reference Ho and Mckay13]. Many materials are used as adsorbents, such as activated carbon (AC), agricultural wastes, industrial byproducts, and biosorbents. Deng et al. reported adsorption of Cd(II) ions, methylene blue (MB), and orange G molecules from solutions using magnetic graphene oxide [Reference Deng, Zhang, Zeng, Gong, Niu and Liang6]. The use of hydrophobic cross-linked polyzwitterionic acid composite for the treatment of Cd(II) ions, MB, and orange G dye molecules was investigated by Saleh et al. [Reference Saleh, Muhammad and Ali14]. Visa et al. studied adsorption of MB molecules, Cd(II), Cu(II), and Ni(II) ions from solutions using modified fly ash (main constituents: silica, alumina, iron oxide, and unburned carbon) [Reference Visa, Bogatu and Duta1]. Also, clinoptilolite or chitosan/clinoptilolite composites have been used as an adsorbent for the removal of heavy metals including Pb(II), Ni(II), Cu(II), Cd(II), Cr(II), Co(II), and Zn(II) ions [Reference Dinu and Dragan15, Reference Wang and Ariyanto16, Reference Kosobucki, Kruk and Buszewski17]. Chen et al. [Reference Chen, Wang, Huang and Shanshan18] reported the synthesis of porous carbons based on Euonymus japonicus leaves, and the feasibility of using the resultant porous carbons as adsorbents for removal of dyes from a simulated wastewater, and three types of dyes, MB, MO, and RhB, were investigated. Zhang et al. [Reference Zhang, Lyu and Zhou19] studied that the concentration effect of both nanocellulose and sodium dodecylsulfate (SDS) for the fabrication of a super light 3D hierarchical framework adsorbent nanocellulose aerogel foam (NAF) is exploited through a high speed mechanical foaming and solvent-free method by adding SDS.
AC with hierarchical porous structure and surface characterization is the most commonly adopted adsorbent for removing heavy metal ions and dye molecules from wastewater, owing to their high removal rate and high-quality treated effluent [Reference Crini7]. Qi et al. [Reference Qi, Teng and Liu20] reported that nitrogen-doped carbon quantum dots (N-CQDs) were successfully synthesized using rice residue and glycine as carbon and nitrogen sources by one-step hydrothermal method. Du et al. [Reference Du, Wang and Zhan21] studied that nitrogen-doped porous hollow carbon spheres were fabricated via hydrothermal pre-carbonization and pyrolysis carbonization using yeast cell templates. After that, the MnO2 nanowires were deposited by the in situ hydrothermal reaction. By controlling the reaction concentration, various MnO2 nanostructures with different morphologies and electrochemical properties were obtained. Meanwhile, ACs prepared from biomass are high-performance, environment-friendly, and low-cost products for the adsorption of pollutants. However, to the best of our knowledge, there is no literature in terms of the multilayer adsorption of dye molecules and heavy metal ions on biomass-based AC. Therefore, it is meaningful to investigate the preparation, characterization, and mechanism of multilayer adsorption for biomass-based AC.
In this study, four types of acid (phosphoric acid, tartaric acid, citric acid, and formic acid) were compared to pretreat pine wood sawdust in hydrothermal environment to remove the hemicellulose and lignin, followed by KOH activation to generate AC with nano/mesoporous structure. The optimum AC was used for a facile multilayer adsorption of Cr(VI) ions and MB or AR18 dye molecules due to its adsorption effectiveness. The adsorption isotherm was used to analyze all adsorption data. Meanwhile, the mechanism of the Cr(VI) ions and MB or AR18 dye molecules adsorption in different layers has also been elucidated.
Results and discussion
Characterization of optimum sample
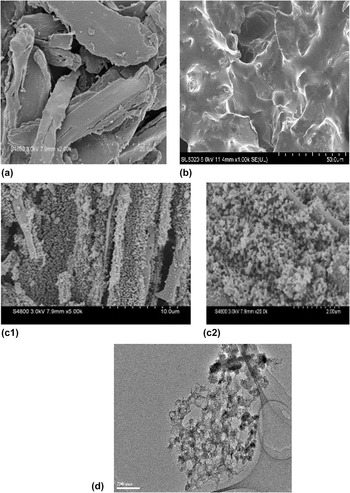
The surface of the raw pine sawdust was smooth in [Fig. 1(a)] and there was little change after hydrothermal treatment [Fig. 1(b)]. After KOH activation at 1000 °C, the AC exhibited a three-dimensional interconnected macroporous network with an average diameter of 200 nm as shown in Fig. 1(c). The typical high resolution transmission electron microscope (HRTEM) image [Fig. 1(d)] of the Phosphoric acid-HTC-1000 sample further confirmed the porous structure including micropores and mesopores besides macropores observed in Fig. 1(c). It was indicated that acid can remarkably degrade the structure of biomass by removing the hemicellulose and lignin and particle aggregation, which further benefited the formation of porous carbon after activation process.
(a) SEM image of pine wood sawdust; (b) SEM image of pine wood sawdust with phosphoric acid after hydrothermal process (Phosphoric acid-HTC); (c) SEM image of Phosphoric acid-HTC-1000 after activation process; (d) TEM image of Phosphoric acid-HTC-1000.

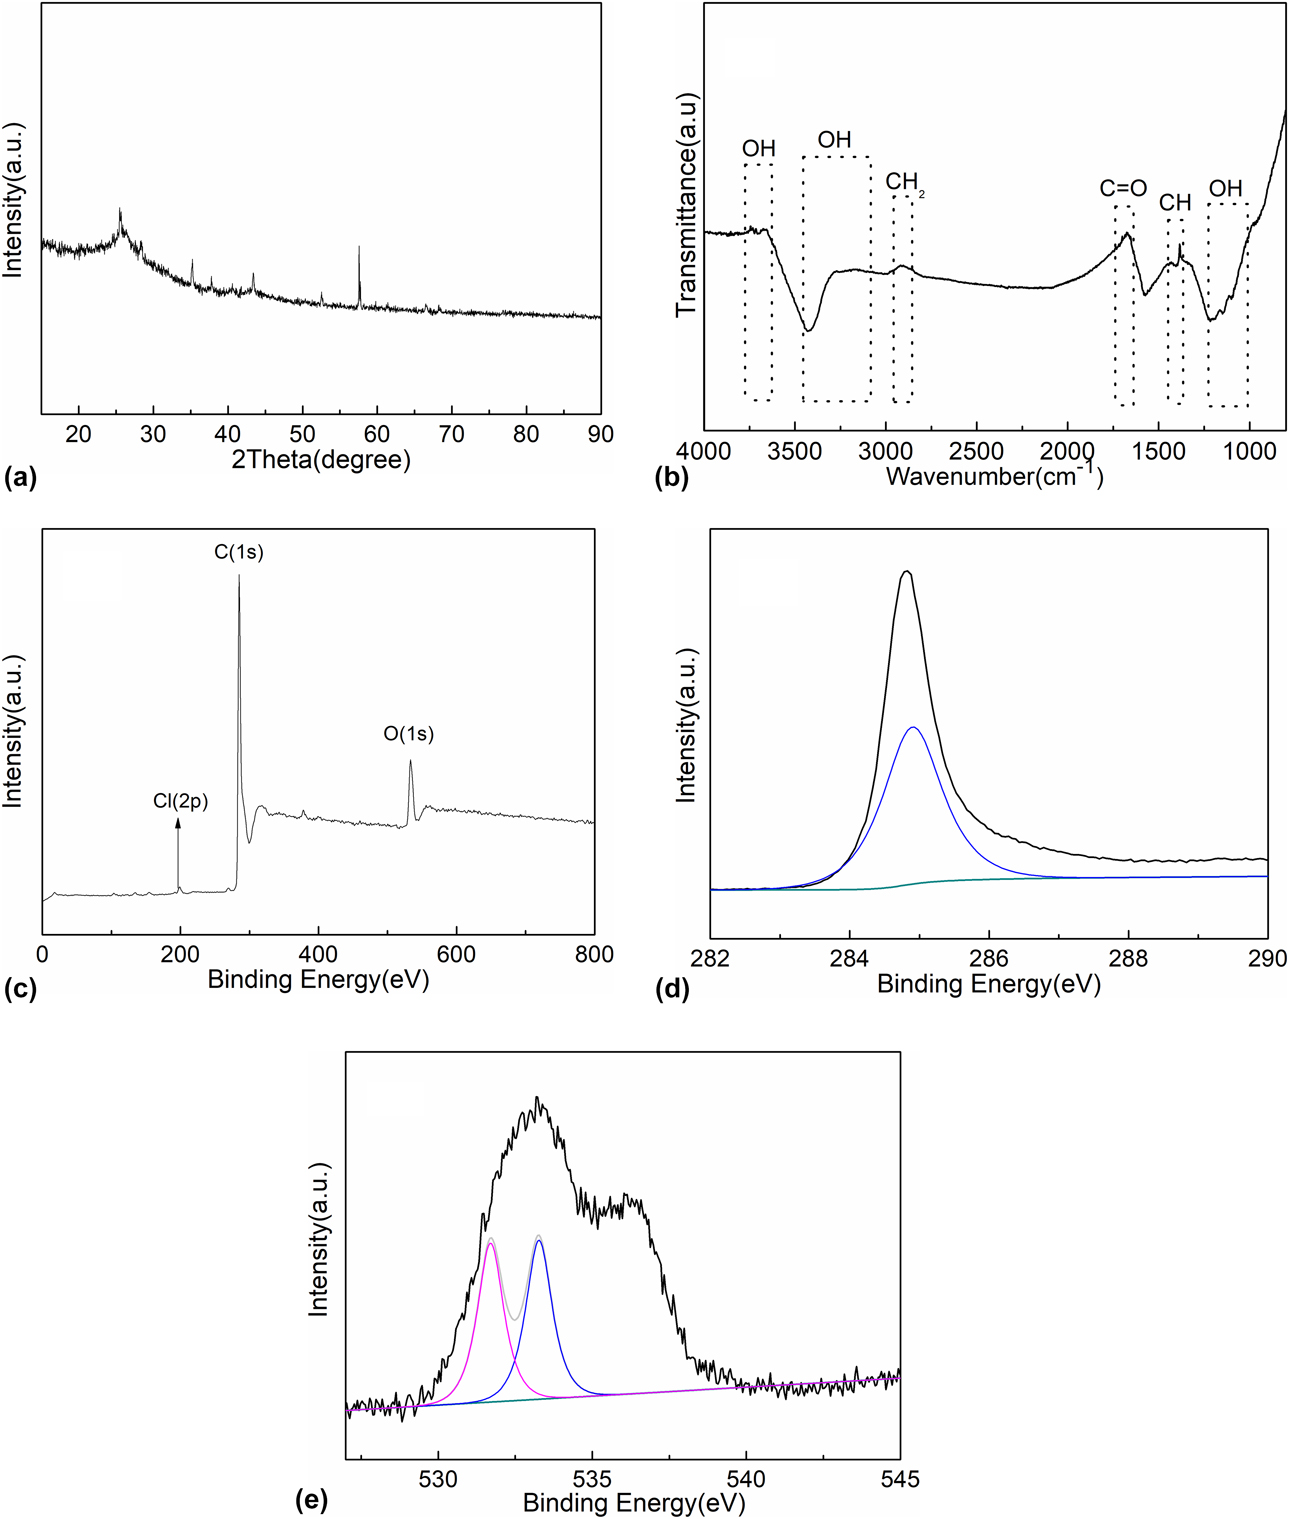
The X-ray diffractometer (XRD) pattern of Phosphoric acid-HTC-1000 sample was shown in Fig. 2(a). It can be seen that one broad diffraction peak located at 25.4° corresponding to the (002) diffraction pattern of amorphous carbon [Reference Zhang, Qi, Liu, Su, Wu and He22]. Several sharp diffraction peaks observed in the XRD patterns of Phosphoric acid-HTC-1000 can be ascribed to the formation of crystalline inorganic compounds resulting from the trace elements of pine wood sawdust [Reference Wang, Schnepp and Titirici23, Reference Wang, Wang, Yan, Lang, Peng and Xue24]. The Fourier transform-infrared (FT-IR) spectra of the Phosphoric acid-HTC-1000 was shown in Fig. 2(b). The peak at 2920 cm−1 belongs to CH2 stretching of alkane. The peak at 1679 cm−1 was attributed to C=O stretching of carbonyl. The adsorption bands belong to CH stretching (1389–1430 cm−1) and OH bending vibrations (3659–3727, 3146–3280, and 1112–1162 cm−1) of carboxylic acid [Reference Saleh, Muhammad and Ali25, Reference Cheng, Li and Liu26]. These inorganic compounds in the preceding part might be composed of carbon (87%), oxygen (11%), and chlorine (2.3%), which were validated by X-ray photoelectron spectroscopy (XPS) full-spectrum in Fig. 2(c).
(a) XRD spectra of Phosphoric acid-HTC-1000; (b) FT-IR spectra of Phosphoric acid-HTC-1000; (c) XPS full-spectra of Phosphoric acid-HTC-1000; (d) XPS spectra of C 1s on Phosphoric acid-HTC-1000; (e) XPS spectra of O 1s on Phosphoric acid-HTC-1000.
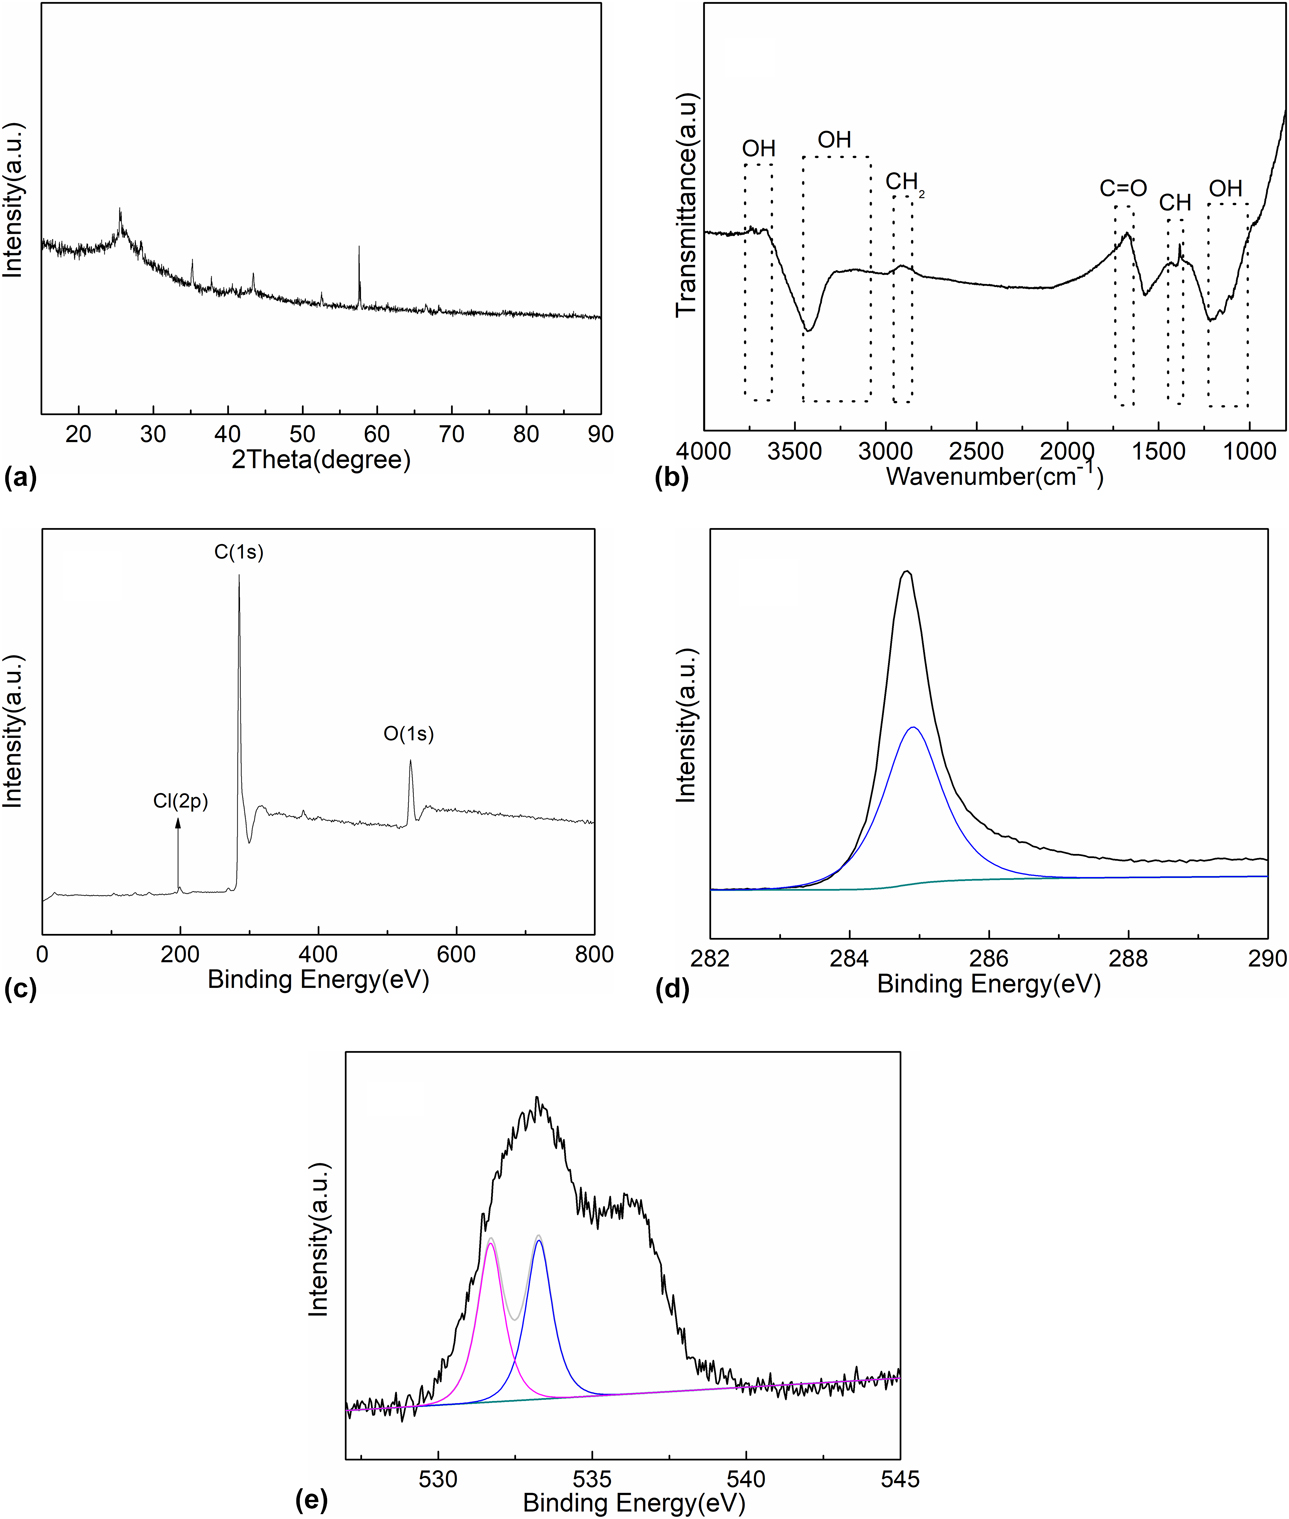
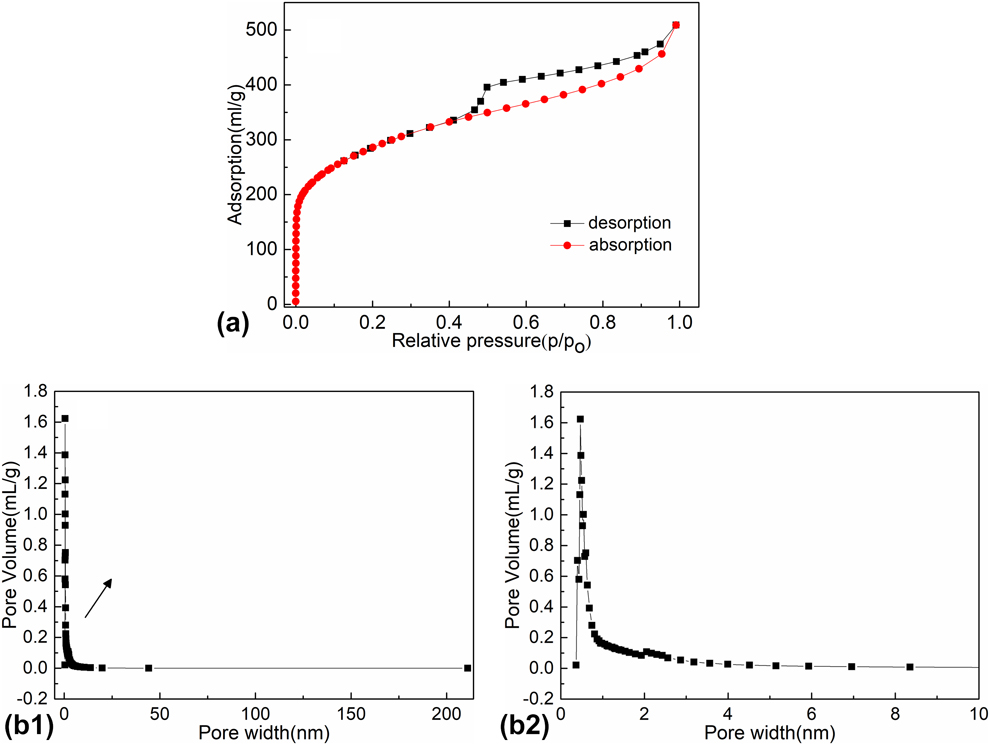
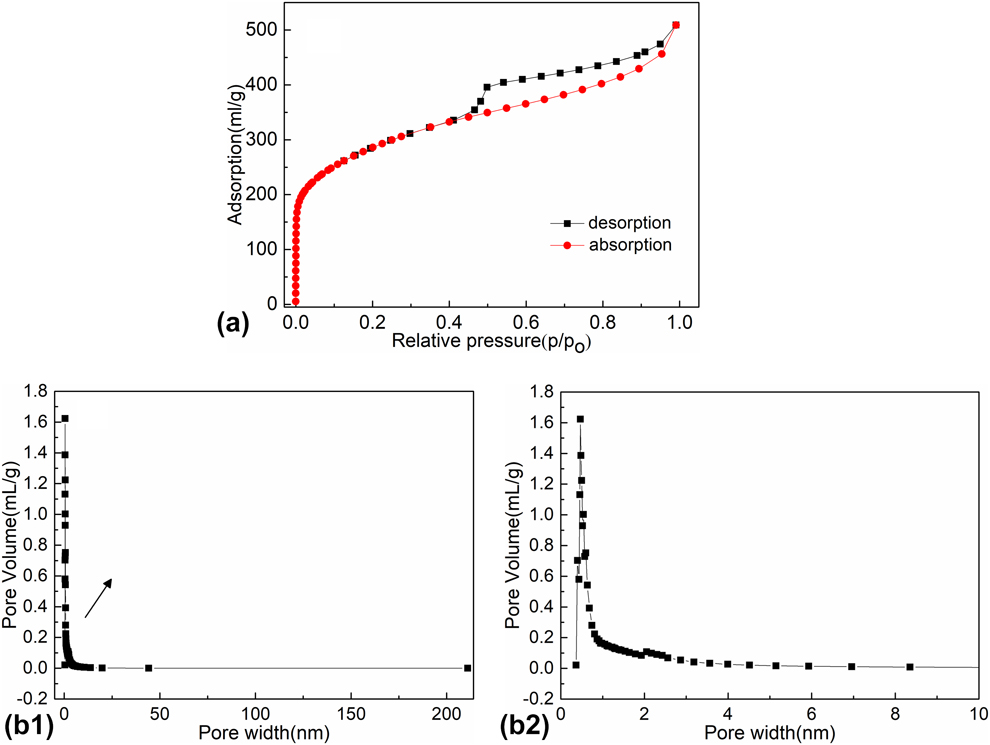
The dissolution of peak shown on XPS spectra of C 1s [Fig. 2(d)] indicates that ether bond carbon (C–O, 286.22 eV) functional groups can be obtained. Meanwhile, the O 1s signals of Phosphoric acid-HTC-1000 [Fig. 2(e)] indicate that two carbon functional groups (C–O, 533.38 eV; C=O, 531.70 eV) can be obtained [Reference Wang and Zhu27]. N2 adsorption–desorption isotherms were plotted and the corresponding pore size distribution curve was determined by density function theory (DFT) method as shown in Figs. 3(a) and 3(b), respectively. Phosphoric acid-HTC-1000 possessed a Langmuir surface area of 1364.12 m2/g and a total pore volume of 0.7872 mL/g with a pore size distribution ranging from 1 to 20 nm, which was in accordance with Type IV adsorption–desorption isothermal characteristic to porous materials [Reference Deng, Shi, Peng and Zhou28].
(a) The N2 sorption isotherms of Phosphoric acid-HTC-1000; (b) porosity characteristics of Phosphoric acid-HTC-1000.
Adsorption isotherms
To estimate the maximum adsorption capacity and evaluate the adsorption intensity of Cr(VI) ions, MB, and AR18 molecules onto Phosphoric acid-HTC-1000, Langmuir and Freundlich isotherm models were suitable for fitting the experimental data.
Langmuir isotherm model describes the monolayer adsorption process without transmigration of adsorbate in the plane of surface and is expressed by Eq. (1),
 $${{{C_{\rm{e}}}} \over {{q_{\rm{e}}}}} = {{{C_{\rm{e}}}} \over {{q_{\rm{m}}}}} + {1 \over {{q_{\rm{m}}}{K_{\rm{L}}}}}\quad ,$$
where q e (mg/g) is the adsorbed amounts at equilibrium state; q m (mg/g) is the maximum adsorption capacity; C e is the concentration of adsorbate at equilibrium time, and K L (L/mg) is the Langmuir constants.
Freundlich isotherm model describes a heterogenous adsorption surface that has unequal available sites with different energies of adsorption, which can be expressed by Eq. (2),
 $$\ln {q_{\rm{e}}} = \ln {K_{\rm{F}}} + {1 \over n}\ln {C_{\rm{e}}}\quad ,$$
where K F and n are the Freundlich constants that represents the adsorption capacity and adsorption intensity, respectively.
Monolayer adsorbates uptake
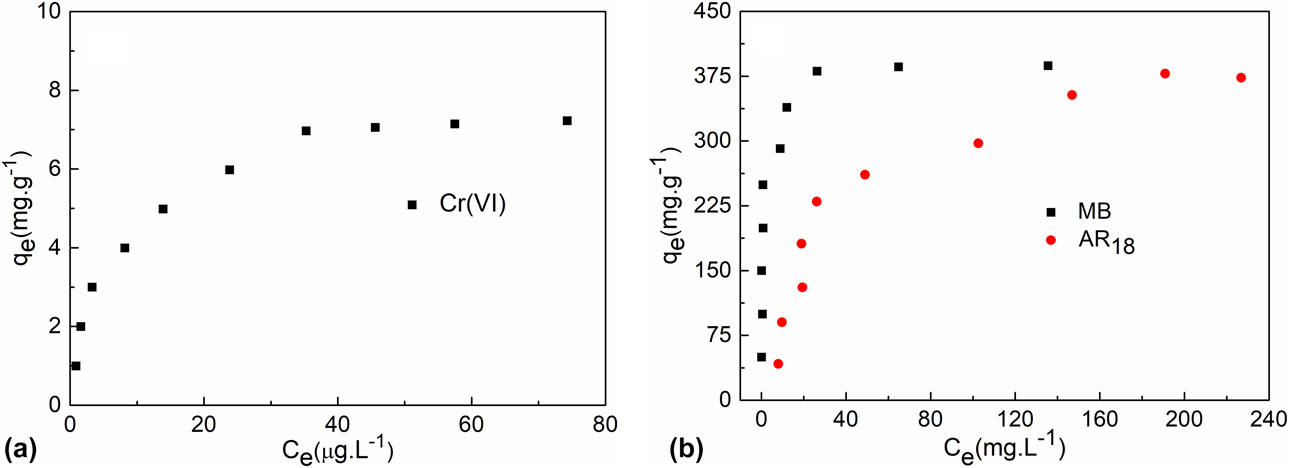
The equilibrium adsorption isotherms of Phosphoric acid-HTC-1000 with a wide range of Cr(VI) ions, MB, and AR18 molecules solution initial concentrations have been shown in Fig. 4. At very low initial Cr(VI) ions and dye molecules concentrations, available adsorption sites are abundant, and all the adsorbate molecules are adsorbed on the Phosphoric acid-HTC-1000. Hence, the equilibrium adsorption amount of the AC is relatively low at very low initial concentration. As the initial Cr(VI) ions and dye molecules concentration increases, the uptake amount of Phosphoric acid-HTC-1000 adsorption sites also increases, but the adsorbate molecules cannot be completely removed from Phosphoric acid-HTC-1000. A continuous improving initial Cr(VI) ions and dye molecules concentration will not increase the adsorption amount of the Phosphoric acid-HTC-1000 after reaching the plateau, because the adsorption sites are already saturated with the adsorbate molecules.
Monolayer adsorption isotherms of (a) Cr(VI) ions onto Phosphoric acid-HTC-1000; (b) MB and AR18 molecules onto Phosphoric acid-HTC-1000.
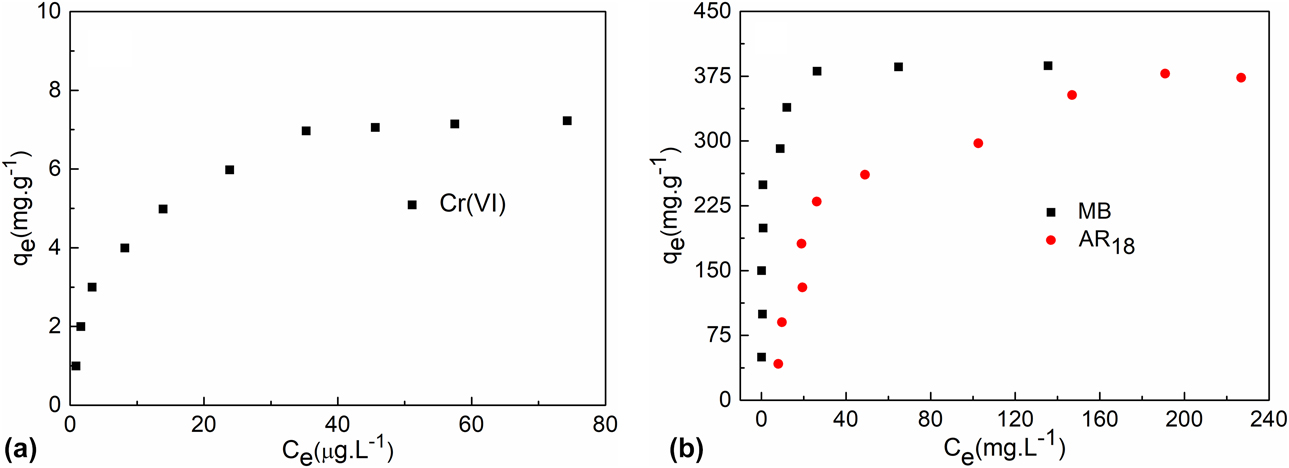
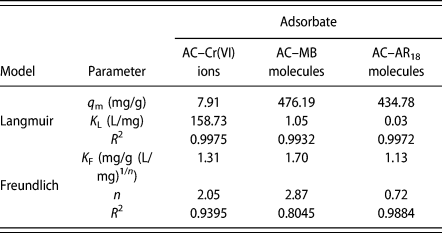
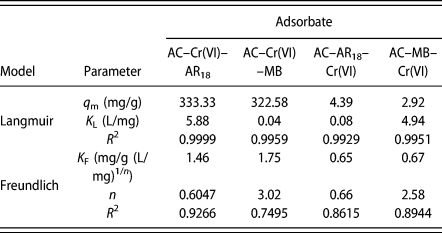
All isotherm parameters for monolayer adsorption isotherm are listed in Table I. As seen from Table I, Langmuir isotherm is quite suitable to the experimental data in comparison with Freundlich model and the correlation coefficients (R 2) are all higher than 0.99. This indicated that Cr(VI) ions and dye molecules form a monolayer coverage on the homogenous surface of the Phosphoric acid-HTC-1000 that are energetically equivalent state [Reference Demircakan, Baccile, Antonietti and Titirici29, Reference Isiam, Tan, Benhouria, Asif and Hameed30, Reference Suteu, Coseri and Rusu31]. Therefore, it can be concluded that physisorption is the dominating process in the adsorption of Cr(VI) ions and dye molecules in the first layer [Reference Isiam, Tan, Benhouria, Asif and Hameed30]. As seen in Table I the maximum adsorption capacities for Cr(VI) ions, MB, and AR18 molecules onto Phosphoric acid-HTC-1000 were found to be 7.91 mg/g, 476.19 mg/g, and 434.78 mg/g, respectively.
Isotherm parameters for monolayer adsorption on Phosphoric acid-HTC-1000.

Multilayer adsorbates uptake
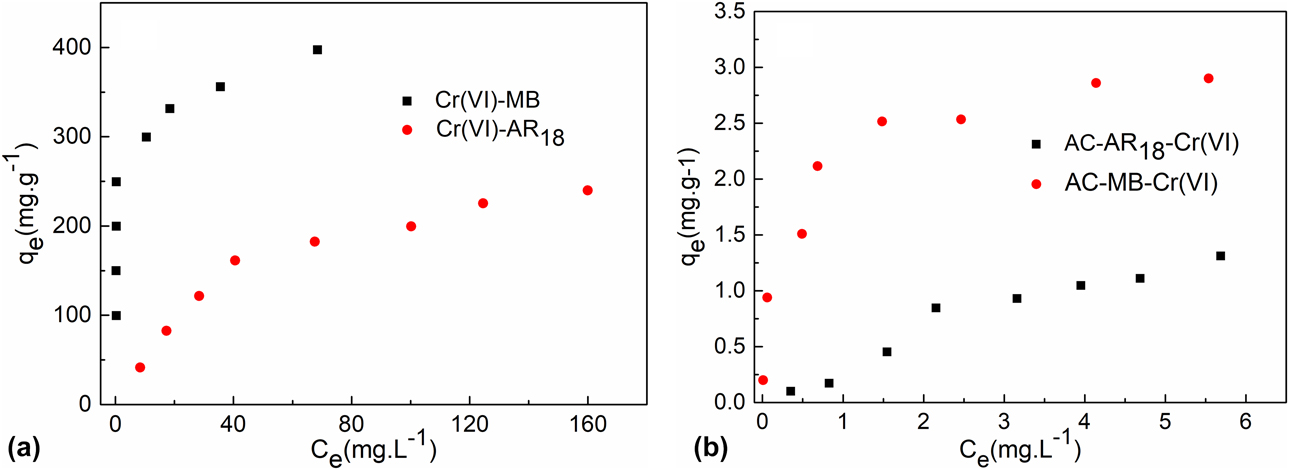
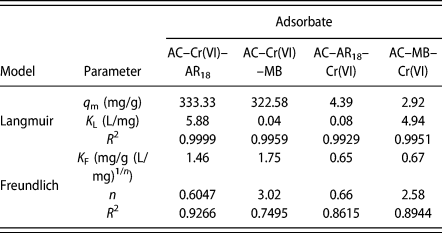
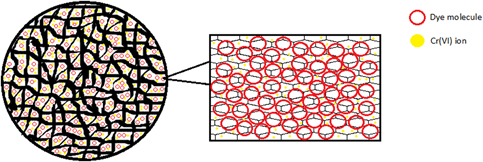
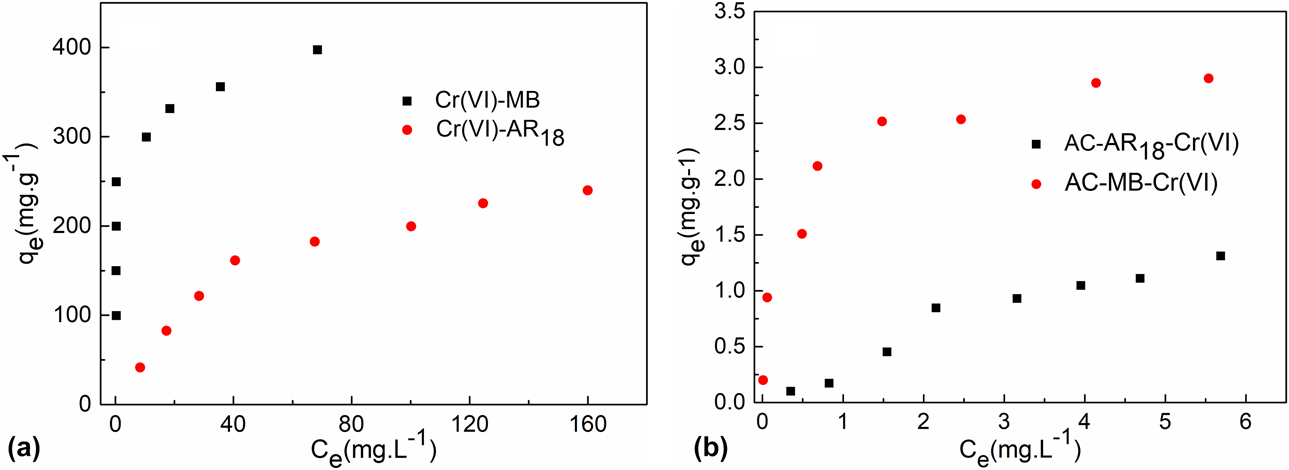
As shown in Fig. 5(a), although the Phosphoric acid-HTC-1000 is already saturated with the Cr(VI) ions on the first layer, there is an extra potential for the exhausted Phosphoric acid-HTC-1000 to adsorb more dye molecules. The adsorption experiments demonstrated that the adsorption capacities of MB and AR18 molecules for Cr(VI)-loaded AC are 322.58 mg/g and 333.33 mg/g, respectively (Table II). Meanwhile, despite the saturation of the Phosphoric acid-HTC-1000 with the MB and AR18 molecules on the first layer, there is still a significant potential to adsorb Cr(VI) ions on the exhausted AC on the second layer [Fig. 5(b)]. The Cr(VI) ions adsorption capacity of the MB-loaded Phosphoric acid-HTC-1000 is 2.92 mg/g. However, the Cr(VI) ions adsorption capacity of the AB18-loaded Phosphoric acid-HTC-1000 is up to 4.39 mg/g (Table II). As seen from Table II, the adsorption capacity of oppositely charged adsorbates on the second layer is higher than that of the same charged adsorbates. This could be due to the adsorbates already adsorbed on the first layer exert attractive forces for the to-be-adsorbed oppositely charged adsorbates in the solution. It is speculated that charge interaction between the first layer and second layer adsorbates also contributes to the second layer adsorption besides occurring on the vacant sites [Reference Hadi, Guo, Barford and Mckay32].
Multilayer adsorption isotherms of (a) Cr(VI) ions on the first layer; (b) Cr(VI) ions on the second layer.
Isotherm parameters for multilayer adsorption on Phosphoric acid-HTC-1000.
Conclusion
In summary, pine wood sawdust was used to prepare AC with the three-dimensional porosity via the pretreatment of various acid and hydrothermal process, followed by KOH activation. The AC obtained via phosphoric acid and hydrothermal pretreatment exhibited a relatively high removal rate in comparison to that of the other three ACs pretreated by tartaric acid, citric acid, and formic acid. The results of XPS and FT-IR indicated that the surface of Phosphoric acid-HTC-1000 contained carbonyl and carboxylic functional groups. Meanwhile, N2 adsorption–desorption isotherms plotting indicated a high specific surface area of 1364.12 m2/g, a total pore volume of 0.7872 mL/g, and an average pore width of 3.0753 nm. The multilayer adsorption demonstrated that the maximum adsorption capacities for Cr(VI) ions, MB, and AR18 molecules onto Phosphoric acid-HTC-1000 were found to be 7.91 mg/g, 476.19 mg/g, and 434.78 mg/g, respectively, on the first layer. For multiple adsorption, there was still an extra potential for the sequential adsorption of MB and AR18 on the second layer occurred with the maximum adsorption capacity of 322.58 mg/g and 333.33 mg/g, respectively, after the saturation of Phosphoric acid-HTC-1000 with Cr(VI) ions. In the case of MB and AR18 molecules uptake saturation on Phosphoric acid-HTC-1000, the maximum adsorption capacity of Cr(VI) ions through layer-by-layer sequential uptake reached 2.92 mg/g and 4.39 mg/g, respectively. It is indicated that physisorption was the dominating process in the adsorption of Cr(VI) ions and dye molecules on the first layer. However, the adsorption process of the second layer was mainly due to charge interaction between the first layer and second layer adsorbates. This study proposes the enhancement of ACs adsorption capacity by utilizing the vacant sites and opposite charge attract phenomena via multilayer adsorption. Considering the excellent adsorption capacity, multilayer adsorption was an effective and available strategy to enhance ACs adsorption capacity of various pollutants.
Materials and methods
Adsorbates
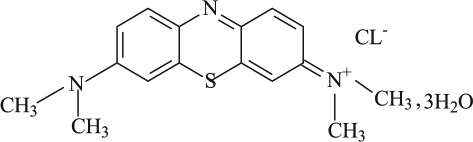
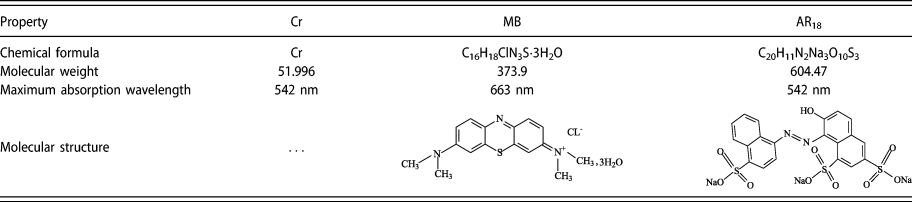
An exact amount of K2Cr2O7, MB, and acid red 18 (AR18) were dissolved in 1000 mL distilled water to obtain solutions with concentrations of approximately 100 mg/L, 1500 mg/L, and 1500 mg/L, respectively, for the use of representative adsorbates of chromium ions and dye molecules. Then, these stock solutions were diluted to prepare the desired concentrations of the Cr(VI) ions and dye molecules solutions for adsorption experiments. All chemicals were laboratory grade and were purchased from Sinopharm (Shanghai) Chemical Reagent Co., Ltd., Hefei, China. The properties of adsorbates are listed in Table III.
The properties of adsorbates.
Preparation of sawdust-based AC via pretreatment and activation
The pine sawdust was ground to a size of 50–80 mesh (0.18–0.3 mm) for easier processing. Typically, 6.0 g pine wood sawdust and one kind of acid with a volume of 40 mL (used acids: phosphoric acid, tartaric acid, citric acid, and formic acid, each of them with 10 wt%) were dissolved in a 45 mL Teflon-sealed autoclave and kept at 210 °C for 24 h in a heating oven. After reaction, the autoclave was cooled down, then the obtained black powder was centrifuged and washed by distilled water. Subsequently, the powder was soaked in KOH (6.0 g KOH, 40 mL distilled water) for 6 h and dried at 80 °C overnight. Finally, the powder was calcined at 1000 °C for 2 h under the atmosphere of nitrogen. The carbon derived from pine wood sawdust with phosphoric acid after HTC is denoted as Phosphoric acid-HTC, and after pyrolysis at 1000 °C, denoted as Phosphoric acid-HTC-1000. Similarly, the carbon derived from pine wood sawdust with tartaric acid, citric acid, and formic acid after HTC are indicated as Tartaric acid-HTC, Citric acid-HTC, and Formic acid-HTC, respectively. Corresponding ACs after pyrolysis at 1000 °C with the three different acids are denoted as Tartaric acid-HTC-1000, Citric acid-HTC-1000, and Formic acid-HTC-1000, respectively.
ACs characterization
The micrographs of Phosphoric acid-HTC-1000 ACs were obtained using scanning electron microscope (SEM; Model SU 8020, HITACHI, Tokyo, Japan). The micrographs of Phosphoric acid-HTC-1000 were obtained using transmission electron microscope (TEM; Model X’Pert PRO MPD, Almelo, Holland). The phase structure of Phosphoric acid-HTC-1000 was examined through X-ray diffractometer (XRD; JEM-2100F, HITACHI, Tokyo, Japan). The elemental composition of Phosphoric acid-HTC-1000 was tested by X-ray photoelectron spectroscopy (XPS; Model ESCALAB 250 Xi, Thermo, Waltham). The functional groups of Phosphoric acid-HTC-1000 were examined using Fourier transform-infrared (FT-IR; Nicolet 67, Thermo Electron Corporation, Waltham, Massachusetts). The surface area and the micropore volume of Phosphoric acid-HTC-1000 were quantified under N2 atmosphere at 77.3 K by using a physisorption analyzer (Micromeritics, Model 3 H-2000 PM 2, Shanghai, China). The specific surface area and pore size distribution of Phosphoric acid-HTC-1000 were determined using the Langmuir and Density function theory (DFT) equations, respectively. The absorption capacity of ACs was examined through ultraviolet spectrophotometer (UV, 756 CRT, Shanghai Youke Instrument Co., Ltd., Shanghai, China).
Equilibrium adsorption isotherm experiments
Adsorption equilibrium experiments were conducted in a temperature-controlled water-bath shaker. Monolayer equilibrium adsorption isotherms of the adsorbates were obtained by adding 20 mg of the AC into 20 mL solution with a range of concentrations (0–700 mg/L) in 50 mL beaker and were shaken isothermally with 50 rpm agitation speed at room temperature. When adsorption arrived at the scheduled time, the samples were filtered by filter membrane of 0.45 μm pore size. The dye concentrations in the solutions were determined at maximum absorption wavelength (Table III) by using a UV–visible spectrometer. For Cr(VI) ions solutions, the filtrate was required to add 0.5 mL of sulfuric acid solution (1:1), 0.5 mL of phosphoric acid solution (1:1), and 2 mL diphenylcarbazide solution (2%) and wait for five to ten minutes to carry out the measurement.
The adsorption at time t, q t (mg/g), and removal percentage (R) was evaluated using Eqs. (3) and (4), respectively,
 $${q_t} = {{\left( {{C_i} - {C_t}} \right)V} \over M}\quad ,$$
 $$R = {{\left( {{C_i} - {C_t}} \right)} \over {{C_i}}} \times 100\% \quad ,$$
where C i and C t (mg/L) are the liquid phase concentrations at initial and time t (min), respectively. V is the solution volume (mL), and M is the adsorbent mass used (g).
Multilayer adsorption of the adsorbates was conducted in several steps; first, the Phosphoric acid-HTC-1000 was saturated with adsorbate A by adsorption method to achieve the first adsorption layer. For this purpose, 0.2 g Phosphoric acid-HTC-1000 was brought into contact with 200 mL A solution with a concentration of 1000 mg/L. Subsequently, the prepared material, denoted as AC-A, was washed, dried, and was used as adsorbent to take up adsorbate B on the second layer. The obtained material is denoted as AC-A-B. In order to ensure the saturation, the equilibrium adsorption isotherm on each layer was acquired using the method described in the preceding section. At least two replicates were conducted for each adsorption experiment to ensure that the results do not have a deviation of more than 5%.
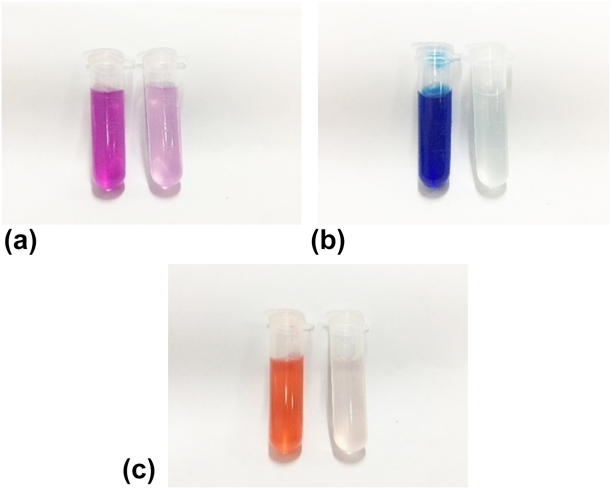
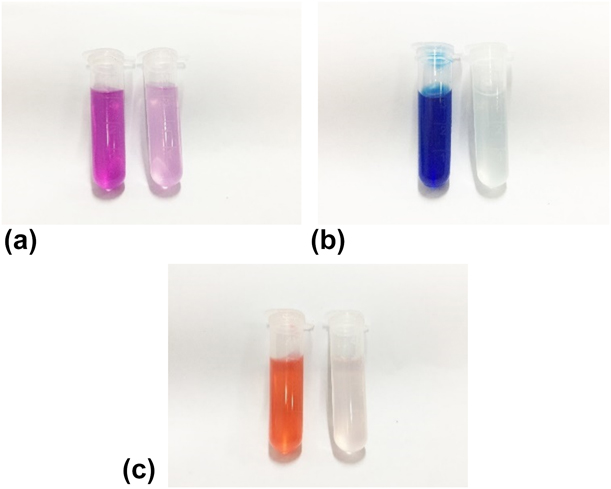
A preliminary adsorption study was conducted to identify the most excellent adsorbent among the eight (Phosphoric acid-HTC, Tartaric acid-HTC, Citric acid-HTC, Formic acid-HTC, Phosphoric acid-HTC-1000, Tartaric acid-HTC-1000, Citric acid-HTC-1000, and Formic acid-HTC-1000). The results are showed in Table IV. Phosphoric acid-HTC-1000 demonstrated the highest removal rate of Cr(VI) ions and dye molecules. The photographs of Phosphoric acid-HTC-1000 adsorption results are showed in Fig. 6. Therefore, some further characterizations and all further adsorption studies were performed using Phosphoric acid-HTC-1000 only.
The removal rate of chromium and dyes on samples.

a R Cr(VI) is the removal rate of Cr(VI) ions solution after soaking 0.02 g adsorbents in initial Cr(VI) ions solution (1 mg/L) for an hour.
b R MB is the removal rate of MB solution after soaking 0.02 g adsorbents in initial MB molecules solution (100 mg/L) for one minute.
c  ${R_{{\rm{A}}{{\rm{R}}_{{\rm{18}}}}}}$ is the removal rate of AR18 solution after soaking 0.02 g adsorbents in initial AR18 molecules solution (100 mg/L) for one minute.
Photographs of initial solution and the removal of (a) Cr(VI) ions solution after soaking 0.02 g Phosphoric acid-HTC-1000 in initial Cr(VI) ions solution (1 mg/L) for an hour; (b) MB solution after soaking 0.02 g Phosphoric acid-HTC-1000 in initial MB molecules solution (100 mg/L) for one minute; (c) AR18 solution after soaking 0.02 g Phosphoric acid-HTC-1000 in initial AR18 molecules solution (100 mg/L) for one minute.
Acknowledgments
The authors gratefully acknowledge the National Natural Science Foundation for Youth Science (21601044) in aid for research. This work was also supported by the Nature Science Research Project of Anhui Province (1808085QE127), the Young Teachers Special Project of Hefei Normal University (2017QN16).