Introduction
Soil quality relates to the capacity of the soil to function in supporting important ecosystem services without a negative interaction with the environmentReference Larson, Pierce and Dumanski1. This concept of soil quality integrates soil chemical, physical and biological attributes, and has recently attracted attention due to an increased awareness of the impact of soil management on agricultural production and environmental qualityReference Doran, Parkin, Doran, Coleman, Bzedicek and Stewart2. The interactions of soil chemical, physical and biological properties often determine how effectively the soil performs ecosystem functions such as nutrient retention and release, partitioning of rainfall into runoff and infiltration, moisture retention and release, resistance to environmental degradation and buffering environmental pollutantsReference Larson, Pierce and Dumanski1, Reference Karlen, Mausbach, Doran, Cline, Harris and Schuman3. The desire to maintain and improve agricultural productivity without jeopardizing environmental sustainability has increased the demand for assessment tools to measure directional changes in soil quality in relation to these various processes.
Since overall soil quality cannot be measured directly, its assessment relies on selected soil measurements (indicators) to quantify the management-induced changes in a soil systemReference Larson, Pierce and Dumanski1, Reference Doran, Parkin, Doran, Coleman, Bzedicek and Stewart2, Reference Arshad and Coen4. The group of soil quality indicators that best describes changes in response to management practices constitutes the minimum data set (MDS) for a particular management goalReference Andrews, Karlen and Mitchell5, Reference Karlen, Hurley, Andrews, Cambardella, Meek, Duffy and Mallarino6. A good MDS for soil quality assessment should encompass ecosystem processes, integrate soil physical, chemical and biological properties and processes, be accessible to many users and applicable to field conditions, be sensitive to variations in management and climate, and where possible, be components of existing soil databasesReference Larson, Pierce and Dumanski1, Reference Doran, Parkin, Doran, Coleman, Bzedicek and Stewart2, Reference Bouma7. Land managers need easily measurable soil attributes or indicators to assess soil functions in relation to management practices. This task involves the selection of appropriate indicators that will fit the intended management goals.
Most soil quality assessment tools combine a given set of soil measurements (MDS) that cut across the soil physical, chemical and biological measurements, and interpret the measured values through scoring curves and indexingReference Liebig, Varvel and Doran8–Reference Idowu, van Es, Abawi, Wolfe, Ball, Gugino, Moebius, Shindelbeck and Bilgili10. Challenges that face these soil quality assessment tools include (i) the selection of the appropriate indicators for different scenarios and management goals; (ii) the interpretation of the indicators in relation to the inherent soil characteristics; (iii) relating soil quality indexes to management goals and (iv) coping with site-specific issuesReference Karlen, Ditzler and Andrews11. For adequate transferability of these assessment tools, the above issues need to be carefully considered and addressed.
The recently developed Cornell Soil Health Test (CSHT) is an integrative farmer-oriented soil quality assessment tool consisting of 15 soil indicators that include physical chemical and biological soil propertiesReference Idowu, van Es, Abawi, Wolfe, Ball, Gugino, Moebius, Shindelbeck and Bilgili10, Reference Moebius, van Es, Schindelbeck, Idowu, Clune and Thies12. The CSHT can assist growers to identify soil constraints that are limiting crop production and target specific management practices to address identified problem areasReference Idowu, van Es, Abawi, Wolfe, Ball, Gugino, Moebius, Shindelbeck and Bilgili10.
As shown by several soil quality studies, the selection of suitable indicator(s) cannot be universally achieved due to the diversity of management goals, soil types, climatic regions, agro-ecosystem management practices and inter-seasonal variationsReference Karlen, Hurley, Andrews, Cambardella, Meek, Duffy and Mallarino6, Reference Karlen, Hurley, Andrews, Cambardella, Meek, Duffy and Mallarino12–Reference Varvel, Riedell, Deibert, McConkey, Tanaka, Vigil and Schwartz14. In order to achieve standards for soil quality assessment, data are needed from different regions that quantify the performance of soil quality indicators in the short- and long-term across different sites, management systems and soilsReference Varvel, Riedell, Deibert, McConkey, Tanaka, Vigil and Schwartz14. Using existing short- and long-term research trials can help achieve the goal of understanding how management practices affect soil functions in different soils and at different locationsReference Liebig, Carpenter-Boggs, Johnson, Wright and Barbour15–Reference Pikul, Schwartz, Benjamin, Baumhardt and Merrill17.
Karlen et al.Reference Karlen, Hurley, Andrews, Cambardella, Meek, Duffy and Mallarino6 studied soil quality at three northern corn/soybean belt locations using long-term plots in different rotation systems. Most of the indicators assessed showed significant treatment differences at different locations, but in general, total organic matter (OM) was the most sensitive indicator across these locations, while bulk density (BD) was significant only at one location.
Liebig et al.Reference Liebig, Tanaka and Wienhold18 assessed soil quality for two long-term cropping system trials in North Dakota and found that management effects on soil quality were largely limited to the surface 0.075 m and increased over time. Continuous crop–no-till had more favorable organic carbon, particulate OM, potentially mineralizable nitrogen (PMN), microbial biomass, aggregate stability and infiltration rates compared to the crop–fallow conventional tillage system.
While studies on the effects of long-term management systems on soil quality indicators have been reported in many regions of the United StatesReference Andrews, Karlen and Mitchell5, Reference Andrews, Karlen and Mitchell6, Reference Andrews, Karlen and Mitchell14–Reference Liebig, Tanaka and Wienhold18, comparatively fewer studies have focused on the cooler northeastern part of the USA. Understanding how management practices affect soils in the northeast will help in developing useful indicators for assessing the current status and detecting changes resulting from managementReference Varvel, Riedell, Deibert, McConkey, Tanaka, Vigil and Schwartz14. This study seeks to fill the information gap on the performance of soil quality indicators in long-term cropping trials. Our study is therefore focused on identifying changes in soil quality indicators on selected long-term experimental sites located across New York State. Our objectives were to examine how soil physical, biological and chemical indicators as assessed in the CSHT are affected by different management systems, soil types and time, and to evaluate the composite soil quality index in distinguishing between contrasting soil management practices at these sites.
Materials and Methods
Site description
Four established tillage and rotation trials located on research facilities of Cornell University (Chazy, Willsboro, Aurora and Geneva, NY) were used in this investigation.
Long-term tillage/silage experiment in Chazy, NY
The Chazy experimental site (44°53′N, 73°28′W) was established in 1973 and planted to continuous maize (Zea mays L.). The soil type at this site is Raynham silt loam, coarse-silty, mixed, active and non-acidic mesic Aeric Epiaquept19. The design of this trial is a factorial (2×2) randomized complete block with treatment combinations replicated four times, including two tillage treatments [no-till (NT) versus plow-till (PT)] and two harvest method treatments [corn silage with stover harvested and removed from the plots (COS) versus corn grain with stover returned to plots as residue (COG)], giving a total of four treatment combinations. The PT plots were moldboard plowed and disked each year and planted to maize, while the NT plots were left untilled and planted using a NT planter. For the COS treatments, the above-ground biomass was harvested yearly and removed from the plots, while in the COG treatments only the ears were harvested each year and the rest of the crop biomass was left as residue.
Tillage experiment in Willsboro and Aurora, NY
Identical tillage trials were located in Willsboro (44°22′N, 73°26′W) and Aurora, NY (42°44′N, 76°39′W), both established in 1992, using spatially balanced complete block designsReference van Es and van Es20 with four replications. The Aurora experiment is located on a Honeoye-Lima silt loam (fine-loamy, mixed, active, mesic Glossic Hapludalf and Oxyaquic Hapludalf) and the Willsboro tillage trial on a Kingsbury silty clay (fine, illitic and frigid Aeric Ochraqualf)19. The tillage treatments were moldboard PT and NT under a corn–soybean (Glycine max L.) rotation.
Gates experimental farm in Geneva, NY
The Gates Farm in Geneva, NY (42°52′N, 77°03′W) is a 6-ha site that consists of a total of 72 plots with three tillage [NT, zone-till (ZT), and PT], three cover crop (no cover, rye and vetch) and two rotation treatments. The soil type is a mixture of Kendaia silt loam (mixed, active, nonacid and mesic Aeric Endoaquept) and Lima silt loam (mixed, active and mesic Oxyaquic Hapludalf19), although Kendaia silt loam is predominant. The experiment was established in 2003. The first rotation (R1) involved continuous high-value vegetable production, while the second rotation (R2) incorporates season-long soil-building crops.
Cover crops [rye (Secale cereale) or vetch (Vicia villosa L.)] were established in early fall and killed with glyphosate in the spring. ZT was established each spring using a zone builder equipped with a deep ripping shank. Usually, the width of the planting zones was 0.015 m and depth of ripping was about 0.3 m. PT consisted of moldboard plowing and disking to create the seedbed. The cropping sequence (2003–2007) for the continuous vegetable rotation (R1) was bean (Phaseolus vulgaris L.)–beet (Beta vulgaris L.)–sweet corn–cabbage (Brassica oleracea var. capitata L.)–bean; while the same sequence for the soil building rotation (R2) was bean–field corn–clover/barley (Trifolium spp. L./Hordeum vulgare L.)–sweet corn–bean.
Sampling and laboratory methods
Soil samples from the experimental sites were collected at two time periods, which were 2004 and 2007 at the Chazy, Aurora and Willsboro sites, and 2006 and 2007 at the Geneva site. Soil sampling, processing and analysis for all trials in 2006 and 2007 were performed according to the CSHT protocolReference Idowu, van Es, Abawi, Wolfe, Ball, Gugino, Moebius, Shindelbeck and Bilgili10, Reference Gugino, Idowu, Schindelbeck, van Es, Wolfe, Moebius, Thies and Abawi21. Soil sampling occurred in the early spring (April) of each year at a depth of 0–0.15 m except for 2004, which was at a depth of 0.025–0.175 m. Physical indicators measured included wet aggregate stability (WAS), available water capacity (AWC), surface hardness (SH) and subsurface hardness (SSH). The biological indicators measured were total OM, active carbon (AC), PMN and root disease potential (RDP). The chemical indicators assessed were pH, extractable P, extractable K, Mg, Fe, Mn and Zn. All measurements were performed on disturbed soil samples except for SH and SSH, which were assessed in the field at approximate field capacity water contents using a soil penetrometer. For 2004 samples from Aurora, Chazy and Willsboro, AWC was determined from intact soil cores taken from the field and field penetration resistance was not determined.
WAS was measured by a rainfall simulation methodReference Ogden, Vanes and Schindelbeck22, applying 2.5 J of energy for 300 s on aggregates (2–0.25 mm) placed on a 0.25 mm mesh sieveReference Gugino, Idowu, Schindelbeck, van Es, Wolfe, Moebius, Thies and Abawi21. The fraction of soil aggregates remaining on the sieve, after correcting for the stones and other particles >0.25 mm, was regarded as the percent WAS. AWC was determined from disturbed soil samples that were air-dried and passed through a 2 mm mesh sieve. Soil moisture apparatus was used to equilibrate the soil to pressures of −10 and −1500 kPa. The gravimetric moisture content difference between these two pressures after the soil samples had attained equilibrium was regarded as the AWC.
Soil hardness was assessed using a soil compaction tester (Dickey-John23, Auburn, IL) at depths of 0–0.15 and 0.15–0.45 m to quantify SH and SSH, respectively. The maximum penetration resistances were recorded at these depths as SH and SSH values.
OM was determined by the loss on ignition methodReference Nelson, Sommers and Sparks24. AC was measured by the permanganate oxidation method described by Weil et al.Reference Weil, Islam, Stine, Gruver and Samson-Liebig25. PMN was determined using the seven-day anaerobic incubation technique as described by Drinkwater et al.Reference Drinkwater, Cambardella, Reeder, Rice, Doran and Jones26. RDP was assessed using the bean-bioassay method developed by Abawi et al.Reference Abawi, Ludwig and Petzoldt27.
The chemical elements were analyzed with an ICP mass spectrophotometer after extraction with Morgan's solution (0.72 N NaOAc+0.52 N CH3COOH) buffered at pH 4.8 according to the routine procedures of the Cornell Nutrient Analytical Laboratory.
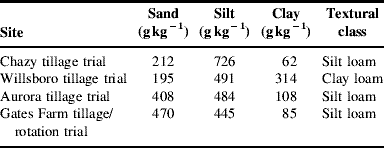
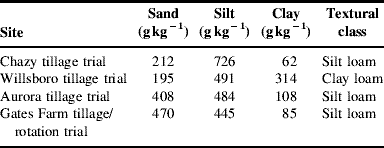
Additionally, the textural analysis of the soils at different sites was assessed using a rapid quantitative method developed by Kettler et al.Reference Kettler, Doran and Gilbert28. The mean sand silt and clay contents for each experimental site are presented in Table 1.
Soil textural analysis of the study sites.
The composite soil health index (CSHI) was calculated from the individual indicator scores, which were obtained from the scoring functionsReference Idowu, van Es, Abawi, Wolfe, Ball, Gugino, Moebius, Shindelbeck and Bilgili10. The CSHI is a linear unweighted combination of the indicator scores normalized to a scale of 100Reference Gugino, Idowu, Schindelbeck, van Es, Wolfe, Moebius, Thies and Abawi21.
Statistical methods
Analysis of variance (ANOVA) was performed on the measured data from the different experimental sites based on the experimental designs of the respective trials. Separate analyses were performed for 2004 and 2007 data since the sampling depths differed for both years. For the Gates Farm trial in Geneva, we analyzed results from 2006 and 2007 together since the sampling protocol was identical for both years. Because of the complexity of the experimental design at Gates Farm, especially when both years of measurement are analyzed together, we treated each rotation separately. Mean separation was computed using the Turkey test after a significant F-ratio (P<0.05) in ANOVA was observed.
Principal component analysis (PCA) was used to study the groupings of different treatment factors for the Chazy, Aurora and Willsboro trials. The factor components were plotted in two-dimensional spaces to explore possible groupings within the dataset. All analyses were performed using the SPSS statistical software29.
Results and Discussion
Soil physical indicators
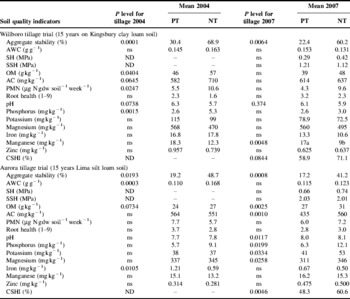
WAS was significantly different for tillage treatments at all sites that were sampled (Tables 2–4). The tillage contrast at Willsboro, Aurora and Chazy sites showed that the WAS values were more than double in NT treatments compared to PT in both years of measurement (Tables 2 and 3). The differences of the WAS under the tillage treatments in R1 and R2 at Gates Farm were less pronounced, presumably due to the shorter time period of the treatment effects (Table 4). The ZT treatment had higher WAS than the NT and the PT treatments for R1, while the NT had the highest WAS for the R2. The robustness of WAS as a soil quality indicator has been highlighted in many studiesReference Moebius, van Es, Schindelbeck, Idowu, Clune and Thies12, Reference Brejda, Moorman, Karlen and Dao30, Reference Stine and Weil31. Aggregate stability is a soil physical indicator that is related to biological and chemical processes in the soilReference Carter32, Reference Six, Bossuyt, Degryze and Denef33. The significance of WAS for tillage for all sites suggests that tillage management can affect aggregation and structural stability of the surface soil both in the short and long term. Although Gates Farm trial was only 3 years old, significantly higher WAS in the minimum tillage practices could be detected (Table 4). For the longer-term trials, the differences due to tillage treatments were more pronounced. Other previous studies have also shown that the soil aggregate stability is improved by reducing tillageReference Liebig, Tanaka and Wienhold18, Reference Wienhold, Pikul, Liebig, Mikha, Varvel, Doran and Andrews34.
Significance levels and mean values of the measured soil quality indicators at Willsboro and Aurora site during 2004 and 2007.

ND, not determined; ns, not significant.
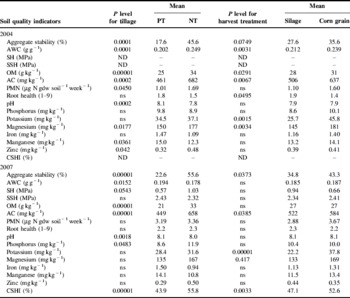
Significance levels and mean values of the measured soil quality indicators at Chazy site during 2004 and 2007.

ND, not determined; ns, not significant.
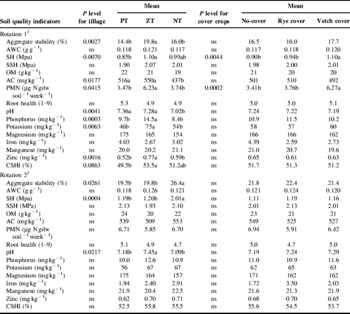
Significance levels and mean values of the measured soil quality indicators at the Gates Farm, Geneva site for two-rotation measured in 2006 and 2007 (results combined).

ND, not determined; ns, not significant; a, b, c, significant homogeneous groups.
1 Rotation 1: (2003–2007) bean–beet–sweet corn–cabbage–bean.
2 Rotation 2: (2003–2007) bean–field corn–clover/grain–sweet corn–bean.
WAS was significant for the harvest method treatments during both years at the Chazy site (Table 3). The corn grain treatment (COG), which had the crop stover returned as residue, had 24–29% higher WAS than the silage treatment (COS), which had all the corn stover removed. This highlights the favorable effect of plant residues for the formation of water stable aggregatesReference Wuest35. However, the effect of stover returned on WAS was not as strong as the effect of tillage, as the relative percentage increase in WAS due to NT was 159% in 2004 and 146% in 2007 (Table 3). Singh and MalhiReference Singh and Malhi36, working in the cool temperate region of western Canada, also showed that the soil aggregation benefited more from NT than from residue retention. This highlights the importance of tillage in the overall management of soil quality. Reducing tillage has a long-term beneficial effect on soil aggregation thereby making the soil surface more resistant to soil erosion and promoting better infiltration of water into the soil.
The cover crop effect on WAS was not significant for both rotations at the Geneva site (Table 4), presumably as a result of the shorter time period of treatment application. This relatively short duration of cover crops to the period of sampling (3 and 4 years, respectively) might not be sufficient for the treatment effects to become apparent. The Gates Farm soil had previously been in continuous vegetable rotation for many years as part of a commercial operation. Some of the lowest values for WAS in this study were measured on Gates Farm plots. Due to this intense level of degradation, it may take a longer time before the effect of the cover crops begins to reflect on soil aggregation.
The clay loam site in Willsboro had higher ranges of WAS than the silt loams at Chazy, Aurora and Geneva sites (Tables 2–4). The general range of WAS for the PT treatment at the silt loam sites was between 14 and 23%, while it was about 30% at the clay loam site. This highlights the importance of soil genetic characteristics in soil quality assessment. The significant role of clay and clay/OM complexes in the formation of stable soil aggregates has been shown in previous studiesReference Denef and Six37–Reference Horn, Taubner, Wuttke and Baumgartl39. Therefore, consideration should be given to soil type factors in developing soil quality assessment frameworks.
Significant differences in AWC due to tillage treatment were observed only for the Aurora and Chazy experiments for 2004 (Tables 2–4). For the sites (Willsboro and Geneva) where AWC was not significant with tillage, there was a general shift of higher AWC towards reduced tillage (NT and ZT). The 2007 AWC results at the Chazy and Willsboro sites showed that the PT treatment had higher AWC than the NT treatment (Tables 2 and 3). This may be related to the method of measurement. In 2004, AWC was determined using the undisturbed soil core method, while in 2007, a simplified method was used in which measurements were performed on the disturbed soil samples. By disturbing the soil samples, the impact of soil structure on AWC becomes masked especially at the lower suctions, and the different pore sizes that would have contributed to AWC, especially in the NT system, have been disrupted and only the effect of soil matrix on moisture retention was being captured from the disturbed samples. This highlights the problems and trade-offs encountered in developing simple soil quality assessment methods. Disturbed soil samples are much easier to collect and handled than the soil coresReference Idowu, van Es, Abawi, Wolfe, Ball, Gugino, Moebius, Shindelbeck and Bilgili10, but in situ core samples can yield better information in relation to some important soil characteristics.
AWC was significantly different between the COS and COG treatments at Chazy in 2004 but not in 2007. The COG treatment had 13% higher AWC than the COS treatment in 2004 compared to almost no difference detected between them in 2007 (Table 3). The lack of significant difference in 2007 may be linked to using disturbed soil samples for AWC determination as discussed above. A relatively higher level of OM in the COG and in NT systems was expected to produce a better-structured soil with higher moisture retention.
The SH and SSH were not significant with tillage treatments for the Willsboro and Aurora trials (Table 2). The values of SSH at field capacity measured for the Willsboro clay loam (1.21 MPa for PT and 1.12 MPa for NT) were relatively low (Table 2) and less than the 2 MPa defined as the threshold beyond which the root growth becomes severely impairedReference Atwell40, Reference Sojka, Busscher, Gooden and Morrison41. In the Aurora trial, the field capacity SSH values were slightly above the 2 MPa limit, indicating some measure of subsurface soil hardness in contrast to the Willsboro site (Table 2). The SSH values measured at the Chazy site were higher than those measured from the other sites with SSH values for the PT and NT treatments being 2.42 and 2.33 MPa, respectively (Table 3). This indicates that SSH may be a constraint in the Chazy soil especially under the PT treatment (suggesting a plow pan). Although there were no significant differences in SH at most of the sites, the quantitative values of SH for NT treatments were always higher than for the PT treatments (Tables 2–4). The tendency for the NT system to have higher penetration resistances has been highlighted by several authorsReference Ehlers, Kopke, Hesse and Bohm42–Reference Lampurlanes and Cantero-Martinez45, although this may not necessarily constitute a hindrance to root growth and development due to improved soil structure and preserved bio-channelsReference Ehlers, Kopke, Hesse and Bohm42.
Although BD measurement was not assessed in the trials presented in this paper, it is generally difficult to predict how it may have been impacted by different treatments. Pikul et al.Reference Pikul, Schwartz, Benjamin, Baumhardt and Merrill17 found that at five locations in the Great Plains where NT was compared to PT in long-term trials, tillage resulted in increased, unchanged or decreased BD, showing a lack of consistent trend. Karlen et al.Reference Karlen, Hurley, Andrews, Cambardella, Meek, Duffy and Mallarino6, also found that BD was significantly affected by crop rotations in only one out of the four long-term trials that were evaluated in Iowa and Wisconsin. It is therefore important to measure BD directly in order to evaluate how it has been affected by different treatments in long-term trials.
While BD may not show a consistent trend in the direction of better management practices, it may, however, prove useful in normalizing some other measured indicators to a volume basis, thereby reducing errors of result interpretations.
Soil biological indicators
OM content consistently showed significant differences with management in long-term experimental plots at the Willsboro, Aurora and Chazy sites, always in the direction of the conservation management practices, i.e. NT>PT and COG>COS (Tables 2 and 3). The increase in OM of the surface soil (<0.3 m) under NT compared to PT systems has been reported in several studiesReference Blanco-Canqui and Lal46, Reference Cambardella and Elliott47. Intensive soil tillage that occurs under PT treatments produces disturbances and soil structural modifications, thus increasing the potential for OM losses from the surface soil by exposing more residue material to biological oxidationReference Rasmussen, Albrecht and Smiley48. However, recent evaluation on the effects of tillage on OM losses indicates a more complex picture, which suggests that NT mostly results in a redistribution of OM, with more near the surface and less accumulation in the subsoilReference Blanco-Canqui and Lal46. From this study, we cannot conclude that NT resulted in higher OM levels for the entire soil profile since our samples were obtained from the surface layer (0–0.15 m).
Although the direction of significant differences was the same, the magnitude of the differences between the NT and the PT treatment reflected the effects of soil type and the length of the trial. Comparing the Willsboro (clay loam) and Aurora (silt loam) sites with identical length of trial but different soil types showed that both the levels of OM and the average increase due to no tillage was higher for Willsboro than Aurora (24 and 14% higher, respectively). Higher OM accumulation in fine-textured soils may be due to the protection of the adsorbed OM on the clay particles from microbial decompositionReference Oades49 and the physical inaccessibility of the OM within pores of micro-aggregates by soil organismsReference Tisdall and Oades50, which may in part be lost through intensive tillage.
The Chazy site showed the highest difference in OM from tillage systems (average of 46% higher OM in NT compared to PT after 31+ years; Table 3), presumably due to the longer duration of this trial. Tillage and cover crop effects on OM were not significant at the Geneva site for both rotations (Table 4), suggesting that it takes a longer period of time before such effects are discernable. Some previous studies have shown that there is generally no significant difference in OM content between NT and PT for up to about 10 years after treatment applicationReference Angers, Bolinder, Carter, Gregorich, Drury, Liang, Voroney, Simard, Donald, Beyaert and Martel51, Reference Campbell, McConkey, Zentner, Selles and Curtin52. The extent of the OM accumulation as a function of tillage and cover cropping may depend on soil type, climate and the extent of previous soil degradation.
The AC test has been proposed as a measure of soil quality, capable of detecting changes in the labile soil organic carbon poolReference Weil, Islam, Stine, Gruver and Samson-Liebig25. AC has been shown to correlate with water-stable aggregates and some other biological measurements such as soluble carbohydrate, microbial biomass, and basal and substrate-induced respirationReference Weil, Islam, Stine, Gruver and Samson-Liebig25. AC was significant for tillage effect at the Willsboro site in 2004 and at the Aurora site in 2007 (Table 2). At Chazy, AC was significant for both the tillage and the harvest method treatments (Table 3). Where significant differences were detected: the NT treatment had higher AC than the PT treatment and COG had higher AC than the COS treatment (Tables 2 and 3). Generally, AC as a soil quality indicator was similar to the OM in the long-term trials at Chazy, Willsboro and Aurora. For the relatively short-term Geneva experiment, AC measurement did not give a clear indication of the direction of better management practices, i.e., NT had lower AC than PT and vetch cover had lower AC than no cover treatment. Generally for all the sites, AC as a soil quality indicator did not provide additional information to OM.
The PMN measurement reflects the nitrogen cycling potential of the soil and serves to assess the rate at which soil microbes make nitrogen available from the soil OMReference Drinkwater, Cambardella, Reeder, Rice, Doran and Jones26. PMN was significant with tillage effect in 2004 at the Willsboro and Chazy sites (Tables 2 and 3), but not in 2007. In Aurora, PMN was not significant during both years (Table 2). Generally, PMN values were higher in NT compared to PT treatments. PMN was significant with tillage and cover crop treatments at the Gates Farm under R1, but not under R2 (Table 4). In R1, PMN was significantly higher in the ZT treatment than the NT and PT treatments, while vetch cover crop had significantly higher PMN than rye cover crop and the no-cover treatments. This suggests that the PMN is not strongly affected by long-term management practices as some other soil quality indicators, and response is site dependent and affected by the utilization of organic N sources such as leguminous cover crops.
The RDP were generally low (<4) at Willsboro, Aurora and Chazy, which are field crops sites (Tables 2 and 3). A lower score indicates healthier roots. In Geneva, with a vegetable rotation trial, the RDPs were greater than 4.8, indicating a higher susceptibility of vegetable systems to root-borne pathogens (Table 4). This result was expected because the crop used for the root bio-assay [snap bean (P. vulgaris L.)] is highly susceptible to the prevalent root rot pathogens of vegetables in the Northeast region (Fusarium solani f. sp. phaseoli, Rhizoctonia solani, Pythium ultimum and Thielaviopsis basicola) and the lesion nematode (Pratylenchus spp.) individually or in any possible combinationReference Abawi and Widmer53. Therefore, the snap bean root assay serves as a more relevant soil quality indicator in vegetable systems.
Soil chemical indicators
The soils at the different sites were chemically managed according to the Cornell guidelines54. Although some treatment effects were significant for a number of the chemical indicators (pH, P, K, Mg, Fe, Mn and Zn), depending on site and year of measurement (Tables 2–4), most of the results were generally within the optimal ranges for crop production in New York. K levels, however, vary with sites and management practices. The K levels were very high at the Willsboro clay loam site, while the silt loam sites of Aurora and Chazy had low to medium K levels (Tables 2 and 3). The Gates Farm site had medium to high K levels (Table 4). At the Chazy site, there was a significantly lower K level in COS compared to COG treatment (Table 3). The K level was about 42% less in COS treatment compared to COG (Table 3). The COS treatment with stover removed led to a depletion in the soil K due to the lack of additional OM in the form of plant residue. The level of soil K was low for COS treatment and medium for the COG treatment, suggesting that a higher rate of K fertilizer is needed to correct K deficiency in the plots with stover removed. The samples used for this study were collected in the early spring just before the planting season. The experimental plots at all sites normally receive fertilizer applications based on soil test results to supplement the soil nutrients for optimal crop production. The generally higher pH (>7) of the silt loam soils in Aurora, Chazy and Gates Farm (Tables 2–4) reflect the calcareous nature of the parent materials on which they were formed.
CSHI
The CSHT was developed to integrate soil indicator measurements and to highlight soil functions with constraintsReference Idowu, van Es, Abawi, Wolfe, Ball, Gugino, Moebius, Shindelbeck and Bilgili10, Reference Gugino, Idowu, Schindelbeck, van Es, Wolfe, Moebius, Thies and Abawi21. Another attraction offered by indexing soil indicator measurements lies in the ability to make a judgment about the overall quality of the soil. The CSHI showed significant tillage effects at the Willsboro (P<0.1), Aurora (P<0.01) and Chazy (P<0.01) sites (Tables 2 and 3). At the Geneva site, the CSHI showed significant tillage effect for R1 but not for R2 (Table 4). CSHI was significant for the harvest method at Chazy (P<0.01) but not for cover crops at the Geneva site (Tables 3 and 4). The performance of the CSHT in differentiating better management practices at these sites shows its potential to serve as a tool for directional soil quality measurement. Although the Geneva site had relatively short duration of treatment applications, the CSHI was able to show that the reduced tillage practices were moving soil quality in a positive direction (Table 4).
Comparing the Willsboro to the Aurora site, which had the same management history, the CSHI for NT was 71.1% for Willsboro and 60.6% for Aurora, and for the PT treatment, it was 58.9 and 48.3% at each location, respectively. The same management practices in different soil therefore yielded the same magnitude of soil quality improvement from reduced tillage as reflected by the CSHI (12.2% for Willsboro and 12.3% for Aurora).
PCA
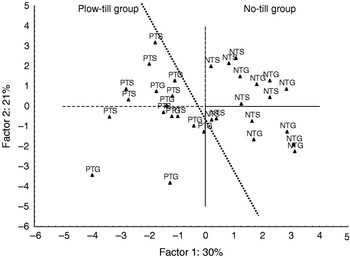
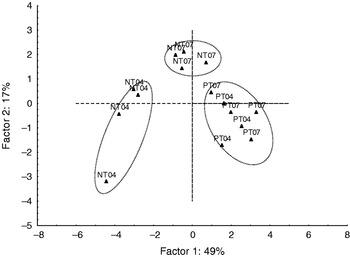
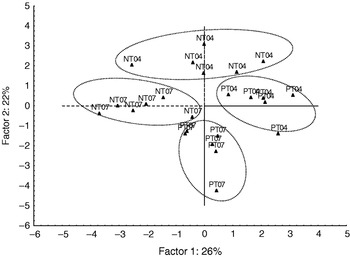
Figures 1–3 show different groupings exhibited by the treatments at Chazy, Willsboro and Aurora. The PCA groupings on factor plane 1 versus factor plane 2 at Chazy show a separation into two distinct classes based primarily on tillage treatment (Fig. 1). The harvesting method treatments did not show as distinct a grouping. This suggests that the tillage effect was more dominant at Chazy than the harvest treatment effects, as confirmed by the ANOVA results (Table 3). The P levels for many of the soil health indicators were lower for tillage effects compared to the harvest method effects. At Chazy, the soil indicators with high loadings (>0.7 or <−0.7) were WAS, OM, AC and pH on factor plane 1 and only Mn on factor plane 2. Similarly, at the Willsboro site, the PCA groupings on factor plane 1 versus factor plane 2 were also according to tillage (Fig. 2), although the NT treatments for 2004 grouped differently from the NT for 2007. The PT treatments for 2004 and 2007 clustered together (Fig. 2). At Willsboro, the soil indicators with high loadings (>0.7 or <−0.7) were WAS, OM, AC, PMN, pH, P and Zn on the factor plane 1 and Mn and Fe on the factor plane 2. For the Aurora site, NT and PT treatments grouped separately and the 2004 and 2007 results for both tillage treatments were also separated in the factor space (Fig. 3). At Aurora, OM, P, K and Fe had high loadings (>0.7 or <−0.7) on factor plane 1, while only pH had high loading on factor plane 2.
PCA groupings on factor plane 1 versus factor plane 2 for Chazy tillage trial. PTG, plow-till grain; PTS, plow-till silage; NTG, no-till grain; NTS, no-till silage.

PCA groupings on factor plane 1 versus factor plane 2 for Willsboro tillage trial. PT04, plow-till 2004; PT07, plow-till 2007; NT04, no-till 2004; NT07, no-till 2007.

PCA groupings on factor plane 1 versus factor plane 2 for Aurora tillage trial. PT04, plow-till 2004; PT07, plow-till 2007; NT04, no-till 2004; NT07, no-till 2007.

The PCA results from both the Willsboro and Aurora sites confirm the observations made at Chazy about the significance of tillage in affecting the soil quality. Further separation of the treatments according to different years for the Aurora and Willsboro sites may be due to several factors including differences in sample handling (disturbed versus undisturbed cores) and weather patterns for both years.
Conclusions
A study was conducted to evaluate soil quality indicators in four long-term experimental trials in New York State. The indicators that were assessed are currently being used for the recently developed CSHT, a commercially available soil quality test.
Indicators that showed significant treatment differences were dependent on the site/soil type, treatment factors and the duration of treatment applications. Tillage effects gave a very strong contrast for many of the significant indicators. The reduced tillage treatments generally had more favorable values for soil indicators than the continuous PT systems. The magnitude of the differences between the PT and the NT treatments for some of the indicators was dependent on soil type and duration of treatment application. Also, WAS benefited more from the reduced tillage (NT) than from the residue addition at the Chazy site. Generally across all sites, WAS, OM and AC were most sensitive to treatment effects and PMN and RDP were more site and management dependent. The chemical indicators were minimally affected by soil management practices and generally, their levels were not constraining for crop production in New York. Stover removal, however, resulted in reduced soil K levels. The CSHI that integrates all the indicator measurement into a single index value proved very sensitive to the integrative effects of the different treatments, with the NT treatments having higher index values than the PT, and stover return having higher values than stover removed.
Overall, we conclude that soil management effects are significant for several soil quality indicators that are used in the CSHT, but others are less impacted. The composite analysis, however, provides a good evaluation of a soil's quality.