Introduction
For people living in the post-communist countries of Central and Eastern Europe, the last two decades have been times of dramatic change. Not only have citizens witnessed the collapse of communism and the end of the Warsaw Pact, but many have also seen their countries march toward – and in the case of 10 countries actually join – the European Union (EU), a decision that may actually come to be an equally important determinant of long-term political and economic development (Vachudova, Reference Vachudova2005). Not surprisingly, the process of EU accession in post-communist countries has attracted wide attention from scholars of public opinion who seek to explain how citizens form attitudes toward the EU and EU membership. A sizable body of literature exists on this question in the context of established democracies in Western Europe, and this existing literature has driven much of the initial work on attitudes toward the EU in post-communist countries (Cichowski, Reference Cichowski2000; Tverdova and Anderson, Reference Tverdova and Anderson2004).Footnote 1
In contrast, in previous work with different co-authors, one of us proposed a theory of support for EU membership that explicitly took into account the distinctive history of post-communist countries (Tucker et al., Reference Tucker, Pacek and Berinsky2002). We argued that in the post-communist context, EU membership may imply something different than in established West European democracies, namely that EU membership can represent an implicit guarantee of cementing the post-communist economic transition to capitalism and free markets. Building on this assumption, we hypothesized that economic ‘winners’, or citizens who see themselves as having benefited economically during the transition period, ought to support EU membership as the ultimate guarantor of the new economic era. Conversely, ‘losers’, or those who have been hurt economically during the transition, ought to be more likely to oppose EU membership.Footnote 2 We found strong empirical support for this prediction across 10 countries using cross-national survey data from the 1996 Central and Eastern European Eurobarometer.
Although an important first step, the analysis presented in Tucker et al. (Reference Tucker, Pacek and Berinsky2002) is static, looking at only one point in time, and thus left important questions unanswered. Were winners more likely to support EU membership than losers early on in the transition period? Did the effect persist as EU membership became more proximate? Did the magnitude of this effect change over time? Moreover, the micro-level finding of the study raises an interesting aggregate-level puzzle. One might suspect that if winners were more likely to favor EU membership than losers, then more economically successful countries would have higher aggregate levels of support for EU membership than less economically successful countries. However, when we turn to the data, we do not actually find such a relationship at the aggregate level. Indeed, to the extent that there is any relationship, it appears to be in the opposite direction, with less economically successful countries having higher levels of aggregate support for EU membership.
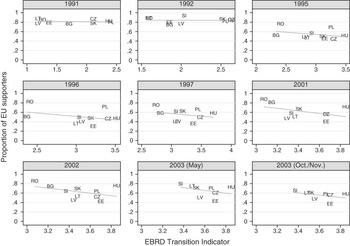
Figure 1 – in which each cell represents a different cross-national survey and each observation country-level proportions of EU supporters from that survey – shows this pattern using the European Bank for Recovery and Development (EBRD)’s transition indicator, an overall measure of a country’s progress in reforming its economy, but similar findings are apparent using a wide range of other economic indicators (see AppendixFigures A1–A4). Of course, we know from studies of ecological inference that just because a relationship is found at the microlevel, it does not need to be present at the aggregate level as well (Gelman et al., Reference Gelman, Shor, Bafumi and Park2007; King, Reference King1997). But, at the very least, it again points to the importance of testing the empirical applicability of the winners–losers hypothesis in a more dynamic framework.
Proportion of European Union supporters in each country-year survey against the European Bank for Recovery and Development (EBRD)’s Transition Indicator. Lines are linear regression lines. The figures show that less economically successful countries had higher levels of aggregate support for EU membership. Countries included are Bulgaria (BG), Czech Republic (CZ), Estonia (EE), Hungary (HU), Latvia (LT), Lithuania (LV), Poland (PL), Romania (RO), Slovakia (SI), Slovenia (SK).

With this in mind, we proceed with two primary goals. First, we seek to assess the extent to which the winners–losers hypothesis is supported throughout the period of time from when communism first collapsed in Central and Eastern Europe until the bulk of the post-communist members of the EU voted in referenda on membership in 2003.Footnote 3 To do so, we have collected every cross-national survey that we can find from this time period with the appropriate questions, resulting in a collection of data comprising of over 60,000 surveyed individuals from 10 countries at seven different points in time over a 12-year period. The results are strikingly clear: whether we examine the raw data, employ multivariate analysis of each individual country–year survey with appropriate individual level control variables, or pool the entire data set and analyze it with multilevel modeling techniques and include both individual and country-level control variables, economic winners are consistently more likely to support the EU membership than economic losers.
Moving to a dynamic framework also allows us to add an important new piece to the theoretical story, which is that the gap in support for EU membership between winners and losers increases over time. Showing the robustness of this finding is the second goal of our article, and again, we are able to do so using raw data, multivariate analysis of individual country–year surveys, and multilevel models. On the basis of these analyses, we can also offer a potential explanation for why we observe the evolution of the winner–loser dynamic over time, why it varies across countries, and what we speculate may be driving it. Although we go into greater detail in the following section, our basic argument is that as long as EU membership is uncertain in potential candidate countries – or at least a distant possibility in the future – citizens are likely to see it as an unmitigated ‘good’, signifying perhaps an escape from communism or acceptance into the richer, more successful world of the West. However, as EU membership becomes more likely and more proximate, it will become increasingly apparent that the membership actually represents more than just an entrance to the ‘West’ and will imply a guarantee of new economic realities. That in turn ought to lead the gap between the economic winners and losers in support for EU membership to increase.
The remainder of our article is organized as follows. We first present a brief overview of our theoretical arguments in the second section. We then describe our data selection process and key variables in greater detail in the third section. In the fourth section, we present the empirical evidence that supports our two primary findings: across all of the post-communist countries that have now joined the EU and throughout the post-communist period, economic winners were more likely than economic losers to support EU membership, and the size of this gap increased over time. In the fifth section, we test different explanation for why the size of this gap may have changed over time. We conclude with discussion in the sixth section.
Attitudes toward EU membership in post-communist countries
The primary hypothesis that this study seeks to test is whether economic ‘winners’ are more likely to support EU membership for their country than economic ‘losers’. Following the theoretical logic proposed in Tucker et al. (Reference Tucker, Pacek and Berinsky2002), we suspect that this will be the case because we believe that the simplest way to conceive of the issue of EU membership in the post-communist context is the ultimate culmination of the transition away from communism and to a market economy. Another way of making the same point is to consider EU membership as a kind of final guarantee that the transition to the new ‘post-communist’ economic structure will never be reversed. This represents a fairly different way of looking at public opinion toward EU membership from what has been common in the literature on public opinion toward EU membership in Western Europe. Part of this literature has proposed a utilitarian approach that connects citizens’ positions in the labor market and their anticipated competitiveness in an enlarged Europe to their attitudes toward EU integration (Anderson and Reichert, Reference Anderson and Reichert1995; Gabel and Palmer, Reference Gabel and Palmer1995; Gabel, Reference Gabel1998a, Reference Gabelb).Footnote 4 The winners–losers hypothesis, in contrast, assumes preferences follow from citizens’ economic experiences during the transition process and not from their occupation-based economic interests. The hypothesis, as such, is more parsimonious. Simply put, it predicts that people who see themselves as doing better economically ought to be more likely to support EU membership – all else equal – than those who are doing worse economically. It is important to note that this is of course a probabilistic hypothesis and not a deterministic one: some economic winners will oppose EU membership and some economic losers will support EU membership.Footnote 5 But, on average, we expect economic winners to be more likely to do so than economic losers. Of course, the very simplicity of the hypothesis is part of its appeal: in the low-information context of post-communist transition countries, such a hypothesis does not put high information demands on citizens. For the theoretical argument to have teeth, citizens need only be able to identify whether they are doing better or worse economically, and whether or not they support EU membership.
A question not addressed in our theory is whether or not political elites attempt to utilize the low-information context concerning EU membership in a strategic manner to influence citizens’ preferences.Footnote 6 We not only focus on mass behavior in this article, but also believe that the impact of parties on citizens’ preferences is likely to be less strong in the post-communist context, where parties are less established and fluctuations in power are more frequent (Lewis, Reference Lewis2000; Markowski, Reference Markowski2002). We also leave aside the question of ‘identity’ which recent research on EU integration has found to be an important factor in shaping citizens’ attitude toward the EU (Diez Medrano and Gutierrez, Reference Diez Medrano and Gutierrez2001; Carey, Reference Carey2002; Christin and Trechsel, Reference Christin and Trechsel2002; Herrmann et al., Reference Herrmann, Risse and Brewer2004; Hooghe and Marks, Reference Hooghe and Marks2005, Reference Hooghe and Marks2004; McLaren, Reference McLaren2006). While certainly an important concept, evidence suggests that, within the context of post-communist systems, cultural issues reinforce rather than oppose economic preferences. In particular, works by Marks et al. (Reference Marks, Hooghe, Nelson and Edwards2006) and Vachudova and Hooghe (Reference Vachudova and Hooghe2009) show that economic positions and non-economic or cultural positions in post-communist party systems map onto the same ideological dimension.Footnote 7
As a brief aside, there is of course no reason why the winners–losers hypothesis could not be tested in the context of other, non-post-communist countries considering membership in the EU. For example, it may turn out to be the case that in Turkey such a significant number of economic changes need to be made to ultimately secure EU membership that citizens may also come to see the EU as a guarantor of some sort of new economic order. However, nowhere do we think this association will ever be quite so stark as in the post-communist context, where countries were in the process of undergoing such a fundamental reorganization of economic life, and at the same time considering membership in an organization whose very existence was based on protecting aspects of that new economic order. So although we focus our empirical analysis in this article on the post-communist context, where the winners–losers hypothesis appears especially appropriate, we do not necessarily rule it out for analysis in other contexts.
One additional question to ask is whether we ought to modify the hypothesis as we move to a dynamic framework. Put another way, can we add some additional nuance to the picture by theorizing about how our expectations about the winners–losers hypothesis might vary over time, as we move from early on in the transition – when EU membership was far from certain – up through the referenda on accession, when EU membership became a very real possibility indeed?
We consider two possibilities in this regard. First, let us assume that EU membership does not only conjure up images of guarantees of the permanence of the post-communist economic changes. More specifically, EU membership may also represent the idea of escaping Soviet dominance and becoming part of the democratic and economically successful West. This is likely to be a rosy picture that appeals to many, and does not cut across economic winners and losers in the way that the ‘EU guarantees economic reforms’ message does. Furthermore, we can combine these two different meanings for EU membership in a dynamic framework. To the extent that EU membership seems nothing more than a far off possibility – something to be aspired to in the future, but nothing that seems likely to take place any time soon – we might expect the relative salience of the EU as a guarantor of a new economic reality to be weaker than when EU membership is seen as a more realistic possibility. So, although there is no reason that the gap in support for EU membership between economic winners and losers should not be present even when EU membership seems to be but a distant possibility, it should arguably be smaller during these periods of time than when EU membership appears a more realistic option. Importantly, we can observe this distinction over time, but also across countries – for some countries, membership will be more imminent than for others even at the same point in time – as well.
Our second supplementary hypothesis stems from the narrative of the post-communist referendum process on EU membership as it actually played out in practice. Namely, the concern arose that for some countries that had carried out far-reaching economic reforms, EU membership might actually represent a step backwards economically, and thus have the potential to harm those who had done well during the transition. In Estonia, for example, it was claimed that EU membership would deliberalize the economy; one Estonian opponent described the EU as ‘a “Soviet Union in disguise” that will force the country to deliberalize its progressive economic policies, including a zero-percent corporate income tax’ (Johnson, Reference Johnson2002). In these limited cases we might expect a small subset of winners to come to oppose EU membership, and thus the size of the gap between winners and losers might also tighten a bit (or at least compared with other countries where support among winners would not be expected to drop). We expect that this effect would be most likely to appear in the immediate run up to membership.
A different question that needs to be addressed is what it actually means theoretically to be an economic ‘winner’. At its essence, we can think of this as a two-step process. Every individual has some set of objective economic circumstances based largely on their social structural position. On the basis of these objective circumstances and some set of personal criteria for judging economic well-being, individuals then decide whether or not they are doing well economically. This is, of course, a subjective decision; not all individuals will make the same subjective judgment on the basis of the same economic circumstances. Given our interest in public opinion in this article, however, we set aside this first step and instead focus only on the subjective condition by asking whether people who think they are doing well economically are more likely to support EU membership than those who think they are doing poorly. We focus on this subjective measure of economic well-being rather than objective measures of economic well-being for three reasons. First, and most importantly, the subjective measure is much more tightly tied to the theoretical logic of our argument than objective measures of economic well-being; the winners–losers hypothesis predicts that people who think they are doing well economically will be more likely to support EU membership, which calls for a measure of subjective economic well-being. Second, the question of how individuals move from objective economic circumstances to subjective evaluations of those circumstances is a huge research question unto itself, and well beyond the scope of this article (although we do provide some analysis in the following section of the relationship between the measure we employ to identify economic ‘winners’ and social structural variables).Footnote 8 In addition, given our interest in the dynamics of public opinion in this article, focusing on subjective evaluations, which are much more likely to fluctuate over time, seemed a more fruitful research strategy than focusing on what is likely to be much more fixed social structural characteristics of respondents.
To summarize, therefore, we test three hypotheses in this article. First and foremost, we explore whether people who saw themselves as doing better economically were more likely to support EU membership than those who saw themselves as doing worse economically from the earliest days of the transition up through the time of the referenda on EU membership in 2003. Second, we test the hypothesis that the gap in support for EU membership between economic winners and losers ought to be smaller when EU membership is more of an abstract possibility for the future than when it seems to be a potentially imminent occurrence. Third, we explore whether some economic winners in the most economically reformed countries might actually be a little less likely to support EU membership in the immediate run up to referenda on membership, and thus we could observe a slight decrease in the gap between economic winners and losers in these countries at that point in time. As the basic winners–losers hypothesis is the primary focus of the article, we address this topic first in the third and fourth sections; we return to the two supplementary hypotheses in the fifth section of the article.
Data selection and variables
We have, to the best of our knowledge, reviewed all available cross-national surveys that assess support for EU membership that have been conducted in post-communist countries since the collapse of communism. From these surveys, we have included in our article every study with both a measure of individual attitudes toward EU membership as well as an appropriate measure of individual self-assessment of economic status. On the basis of these two criteria, seven surveys qualified to be included in our analysis: the 1991, 1992, 1995, and 1996 Central and Eastern Eurobarometer (CEEB) studies and the 2001, 2002, and 2003 (October/November) Candidate Countries Eurobarometer (CCEB) studies, each with a sample size of about 1,000 respondents per country per year.Footnote 9
The primary dependent variable of our study is whether or not a respondent supports EU membership for his or her country. More specifically, in 1991 and 1992, we code this variable based on whether a respondent favors or opposes European Community membership for his or her country. For all other years, we use an individual’s vote decision in a hypothetical referendum (or in the actual referendum, for the 2003 survey) on the question of his or her country’s membership in the EU as the dependent variable.Footnote 10 We group respondents into four categories: ‘would vote for’ membership, ‘would vote against’ membership, ‘would not vote’, and ‘undecided/don’t know/no answer’.Footnote 11
To classify respondents as economic winners or losers, we rely on individuals’ self-assessment of their anticipated financial situation over the next 12 months.Footnote 12 We take a subjective – as opposed to objective – approach to economic well-being primarily for reasons addressed in the previous section. Empirically, recent research on the measurement of subjective well-being indicates that such subjective measures do a good job of assessing individuals’ perceived experiences (Kahneman and Krueger, Reference Kahneman and Krueger2006). Using a subjective measure, therefore, follows directly from our theoretical framework. Our subjective measure, of course, is correlated with social structural variables. High-income respondents, for example, have more positive expectations of their financial situation than low-income respondents.Footnote 13 The relationship, however, is far from perfect. Examining income, for example, we find that one-quarter of low-income respondents expect their financial situation to improve, while, similarly, one-fifth of high-income respondents have negative expectations about their financial situation.Footnote 14 Using a subjective measure of economic well-being helps us in identifying precisely these respondents whose feelings about their economic situation is different from what their social-structural position would suggest. Social-structural variables, furthermore, are static and do not take individuals’ anticipated life changes into account, something that is especially important during rapid economic changes as was the case in post-communist transitions. In this respect, it would be interesting to test whether subjective and objective measures correlate at similar rates in Western European countries. Because our focus is on post-communist countries, we do not follow this line of investigation. We note, however, that in a preliminary analysis of Eurobarometer data from Western Europe, we find similar patterns as those described above (see Tables A2 and A3, in the Appendix).Footnote 15
To establish equivalence between the two surveys, we have recoded responses in the CCEB from five to three categories – a prognosis that one’s economic situation will ‘get better’, ‘get worse’, or ‘stay the same’ – to match the CEEB, which offers only these three choices.Footnote 16 We refer to respondents who perceive that their financial situation will improve over the next 12 months as winners and those who think their economic situation will get worse over the same time period as losers. Respondents who answered that their financial situation will stay ‘the same’ are referred to, creatively, as ‘the same’, and represent an intermediary category between being a winner or a loser.
All of our multivariate models include gender, education, and age as individual level control variables. Three additional individual level control variables that we would have liked to have included in our analysis – residency, profession, and income – were not available for 1991 and 1992, and hence we faced a trade-off between either extending the time frame of our study or extending the list of control variables. We selected the former option, in part because 1991 and 1992 were especially important for demonstrating the dynamics of public opinion toward EU membership. As a robustness test, though, we re-estimated all models for which we had the necessary data (i.e., the studies from 1995–2003) on the extended set of control variables. Fortunately, all of our key findings turned out to be extremely robust to the inclusion or exclusion of this set of additional control variables, and thus we feel confident proceeding with the reduced set of control variables that were available across all of the studies.Footnote 17
One final question worth addressing before presenting our empirical findings is the issue of endogeneity, or whether the dependent variable might somehow be exerting an influence on the key independent variable. Had we used a variable that measured a respondent’s belief about the likelihood that her country would get into the EU, then we might have had reason to be concerned that people who believed EU membership was in their country’s future might be more (or less) optimistic about their own personal economic situation in the future because of that impending EU membership. As we rely instead on a dependent variable that asks merely whether or not one favors membership for one’s country, it is almost by definition impossible that a preference for a policy outcome could have any effect upon one’s beliefs concerning one’s economic fortune over the next 12 months.Footnote 18 Nor would it be likely that some sort of omitted ‘optimistic personality’ variable could be causing both of these effects; optimism might make one more likely to believe that membership was going to eventually happen for one’s country, but it would not cause the prior preference for (or against) membership.Footnote 19
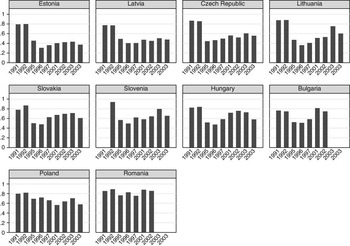
We begin by briefly examining our key variables graphically using the raw data. Figure 2 shows the proportion of respondents in favor of EU membership for their country in each survey by country.Footnote 20 The figure reveals considerable variation in support between countries and over time. Support is quite high in all countries in 1991 and 1992 with, on average, more than 80% of individuals favoring EU membership for their countries. Support decreases in the mid-1990s, but then increases again in the 2001–03 period. In terms of variation across countries, support is lowest in Estonia and Latvia, fluctuating around an average support of about 50%. Support was highest in Romania, with close to 80% of respondents supporting EU membership in most years.
Proportions of respondents who favour European Community (EC) membership of their country (1991 and 1992) or would vote for European Union (EU) membership (1995-2003) of their country if a referendum were held tomorrow. Two surveys are available for 2003, one conducted in May and one in October/November 2003. In the latter, the survey question refers to actual vote decision. Data on EC membership opinion is not available for Slovenia in 1991 because the survey question was not included. Data on EU membership opinion is available for Bulgaria and Romania in 2003 because no referenda were held. Countries are ordered by average support for EU membership in each country. Sample size in each year is about 1000 respondents.

In contrast to support for the EU, the proportion of respondents that are classified as either winners or losers is fairly stable across most of the surveys – representing about half of all respondents – with the two groups usually being about the same size (data not shown).Footnote 21 The fact that the proportion of winners and losers in each country is relatively stable over time and across the CEEB and CCEB surveys makes us more confident that our results are not being driven by differences in survey methods across the two studies. Furthermore, we do not find systematic variation between the economic well-being of a country and the proportion of winners. We can, therefore, exclude the possibility that response behavior to survey questions about prospective financial well-being is being overly influenced by the economic well-being of the country in which the interview took place.Footnote 22
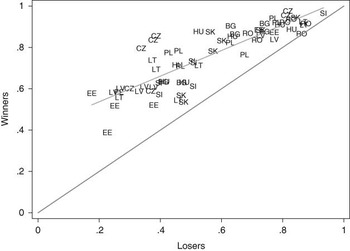
In Figure 3, we combine our two primary variables in a manner that essentially allows us to examine cross-tabulations from all of the country–year observations in the data set simultaneously. Put another way, this provides a first test of our primary hypothesis – are economic winners more likely to support EU membership than economic losers? – using only the raw data. More specifically, we plot the proportions of respondents among economic winners (y-axis) and losers (x-axis) supporting EU membership for their country for each country–year observation in the data set. The results are extremely clear; as indicated by the fact that all country–year observations lie above the 45 degree line, winners are always more supportive of EU membership for their country than losers. Given that we are reporting results from 10 countries across seven different surveys that took place over a 12-year period, the consistency of the finding is really quite remarkable.Footnote 23
Proportions of winners and losers supporting European Union (EU) membership of their countries. Each label represents one particular country-year observation. The shorter line represents fitted values from a linear regression of the y-axis variable on the x-axis variable. All observations lie above the 45 degree line which means that in each country and in each year the proportions of winners supporting the EU is greater than the proportions of losers. Countries included are Bulgaria (BG), Czech Republic (CZ), Estonia (EE), Hungary (HU), Latvia (LT), Lithuania (LV), Poland (PL), Romania (RO), Slovakia (SI), Slovenia (SK).

Winner and loser status as determinants of attitudes toward the EU in post-communist countries
In the previous section, we examined the relationship between citizens’ economic status and their support for EU membership in a bivariate framework. In this section, therefore, we move to a more traditional multivariate framework, employing two different strategies for pooling our data. Regardless of the approach, though, we come to a similar conclusion: winners are more likely to support EU membership than losers across both time and space. However, we also demonstrate that the magnitude of this effect (e.g. the size of the gap between winners and losers in support for the EU) varies considerably over time and across countries.
As discussed above, our data cover the time period from 1991 to 2003, including survey data from 2003 that utilizes respondents’ self-reported vote decision in the EU referendum. Although we would have preferred to have a complete time series, the availability of data requires us to rely on surveys from 1991 and 1992, 1995, and 1996, and then again from 2001 to 2003. One advantage of these particular years, however, is that they allow us to draw upon three very distinct time periods: the immediate years after the collapse of Communism (1991 and 1992), the period of time when EU membership was seen as a more realistic possibility but not an imminent development (in the mid-1990s), as well as when the vote and eventual accession was becoming an increasingly tangible prospect (from 2001 to 2003). In total, we have 67 country–year surveys, each compromising about 1000 survey respondents, to test empirical support for the winner–loser hypothesis and to see whether the postulated relationship holds over time.Footnote 24
The dependent variable in our analysis consists of four unordered categories (for, against, would not vote, and undecided/don’t know/no answer), and hence we estimate multinominal logit models. The reference category in all models are respondents who are against EU membership for their country. We estimate our first model using a completely pooled data set in which all countries and years are analyzed together. In the next set of models, we estimate separate models for each year with all countries within a year pooled together. Finally, we estimate separate models for each country and year.
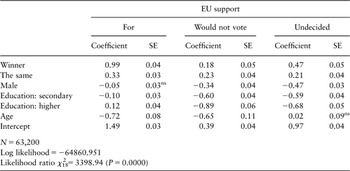
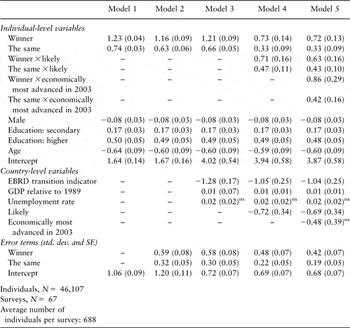
Table 1 summarizes the results from the completely pooled model. Our primary independent variable – the respondent’s economic status – is entered in the form of two dummy variables, one for being a ‘winner’ and one for being ‘the same’. Doing so allows us not to force a linear effect on economic status, and means that the coefficient for each variable is to be interpreted as the difference in the effect of being in that category as opposed to be in the omitted category (here, being an economic loser). Taken together with how we coded the dependent variable, this makes the coefficient on the ‘winner’ variable in the ‘for membership’ regression results our primary variable of interest, as it explicitly measures whether being an economic winner makes the respondent more likely than an economic loser (the excluded category in the independent variables) to support membership as opposed to opposing membership (the base category in the dependent variable). As predicted, the coefficient for the winner variable is both positive and statistically significant, thus demonstrating that across the entire sample, controlling for demographic characteristics, economic winners were more likely to support than to oppose EU membership. Respondents in ‘the same’ category (i.e. who were neither winners nor losers) were also more likely than losers to support EU membership, and the coefficient estimate of 0.33 (P < 0.001) is, as expected, smaller than the estimate for winners. Substantively, a typical respondent in the survey had a 56% chance of supporting EU membership if she was an economic loser.Footnote 25 This same typical respondent’s chance of supporting EU membership goes up to 60% if she is in ‘the same’ category, and goes up all the way to a 72% chance of supporting EU membership if she is an economic winner. Thus, the effect is quite substantively meaningful as well.
Multinomial logit model of European Union support on winner/loser status and control variables. All countries (N = 10) and years (N = 7) are pooled together

EU = European Union; ns = non-significant.
Against EU membership is the baseline category of the dependent variable. Losers are the omitted category for the winner and ‘the same’ dummy variables; ‘Education: primary’ is the omitted category for the education dummies. Age is recoded to the [0–1] interval and mean-centered. All coefficients are statistically significant at P < 0.05 unless indicated by ‘ns’.
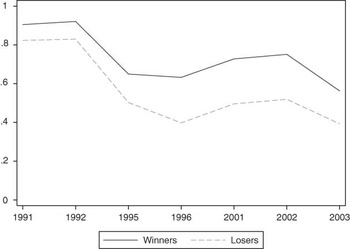
Pooling the entire data set in this manner, however, obscures the presence of any underlying time trends. With this in mind, we break the data down into separate data sets for each time period (e.g. each cross-national survey), but continue to pool across countries within years. Across all seven of these ‘pooled by year’ analyses, the coefficient for economic winners is always positive, significantly different from zero, and always larger than the coefficient for ‘the same’ category. Figure 4 concisely summarizes these findings by presenting the predicted probability of supporting EU membership for a typical respondent (as defined above) who also happens to be an economic winner (straight line) or an economic loser (dotted line) at each time period.Footnote 26
Predicted probabilities for winners and losers supporting European Union (EU) membership. Estimates are based on seven multinomial logit models estimated on each year separately with countries pooled together. All other variables are held at their modal or mean values, representing a 44 year old female respondent with secondary education.

In addition to showing that at each point in time economic winners were more likely to support EU membership than economic losers, Figure 4 also clearly demonstrates that there is considerable variation in the estimated probabilities over time, as well as in the size of the gap between winners and losers. This gap is smallest in the 1991 and 1992 surveys, precisely when the prospect of EU membership was most remote for post-communist citizens and when overall support was highest. By the mid-1990s, the size of the gap increases from about 0.10 (in 1991) to about 0.25 (in 1996), and then holds largely steady before declining to about 0.17 in 2003, the year of the actual vote on EU membership in 8 of the 10 countries. Again, it is worth noting that in every year, the predicted probability that winners will support EU membership is always larger than the predicted probability that losers will support EU membership.
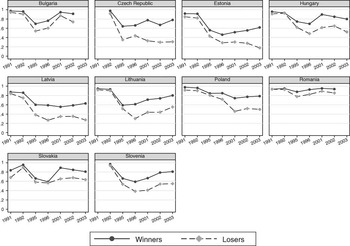
Pooling the data by year, however, can obscure variation within years and across countries. Therefore, we also estimated the effects of economic status on attitudes toward EU membership separately for each country–year survey. The results are once again remarkably consistent. In every one of these analyses, the coefficient for the winner variable was always positive. In fact, in the 1991 Czech Republic survey, every single winner supported EU membership, thus rendering us unable to actually estimate the model in this case. In the remaining 66 models, the winner coefficient was statistically significant in 45 of the models. As one might expect from the results presented previously in Figure 4, the vast majority of the cases in which the coefficient was positive but not statistically significant came from the 1991 and 1992 surveys, where general support is very high and the difference between winners and losers is relatively small.
As 66 sets of multinomial logit results are prohibitively long to present in the context of a journal article, we again summarize our key findings by presenting the estimated probabilities for supporting EU membership for a typical winner and loser, this time by year and country, in Figure 5.Footnote 27 For most countries, we find a vaguely U-shaped pattern in predicted support, as was the case in the analyses pooled by year (see Figure 4 above). However, there is clearly some variation by country. Perhaps the most notable from our perspective is that the size of the gap remains smallest in the post-1992 surveys in Bulgaria and Romania, the two countries that were not admitted to the EU in 2004 and had to wait instead until 2007. Moreover, by far, the smallest gap between winners and losers in the remaining eight countries can be found in Slovakia in 1995 and 1996, 2 years when it looked like the country was likely to miss out on its opportunity to be among the first countries into the EU. We return to these points in the following section.
Predicted probabilities for winners and losers supporting European Union (EU) membership. Estimates are based on 66 multinomial logit models estimated on each country-year observation separately. There are no estimates for the Czech Republic in 1991 because all winners supported the EU. The question about EU support was not asked in Slovenia in 1991. In 2003, the survey question regarding EU support referred to actual vote decision in the referendum, and consequently was not asked in Bulgaria and Romania where no referenda were held. All other variables are held at their modal or mean values, representing a 44 year old female respondent with secondary education.

Taking all of these results – from the raw data, from the pooled multivariate analyses, and from the unpooled multivariate analyses, we can safely conclude that the winner–loser hypothesis is strongly supported by the data throughout the years of 1991–2003 in the 10 post-communist countries that have so far joined the EU. There was undoubtedly a strong relationship between an individual’s self-assessment of his or her economic prospects and his or her attitudes toward joining the EU. The nature of this relationship, however, did change over time. Therefore, it should be clear that any static analysis that is limited to one particular year tells an inconclusive story about public opinion toward EU membership in post-communist countries. In particular, there are noticeable differences between the surveys taken in Romania and Bulgaria and those taken in other countries, as well as striking differences between surveys taken in 1991 and 1992 and those taken in later years. We discuss these topics in the following section.
The dynamics of attitudes toward EU membership
In the previous section, we demonstrated that (i) economic winners were consistently more likely than economic losers to support EU membership in post-communist candidate countries but that (ii) the size of this effect varied across time and countries. In this section, we test the two supplementary hypotheses introduced in the second section to explain variation in the size of the gap in support for EU membership between economic winners and losers. To reiterate, our first hypothesis is that the size of this gap should increase as EU membership for one’s country becomes more of a realistic possibility, as opposed to simply a far off aspiration. Our second hypothesis is that in countries where economic reform has been significantly advanced, a small subset of economic winners might come to oppose EU membership on the grounds that it would actually lead to a reversal of some market reforms, and thus we could witness a small tightening of the gap between winners and losers in these countries in the year immediately preceding EU accession.
As addressed in the previous section, Figure 5 (see above) is indeed quite consistent with the first of these hypotheses: the gap between winners and losers is smallest in the first years of the transition when EU membership appears most remote. The gap also stays smaller over time in Romania and Bulgaria, the two countries not admitted to the EU in 2004. By contrast, there is little in Figure 5 to support the second hypothesis: the size of the gap between winners and losers actually increases in both Estonia and the Czech Republic – two of the region’s more economically reformed countries – in the final surveys in 2003. These conclusions, of course, are only being made based on eyeballing a set of predicted probabilities, and thus do not generate measures of statistical certainty.
To do so, we turn to multilevel statistical models. Such models allow us to create interaction effects between country-level variables (such as whether one is living in a country at a time where EU membership is remote or likely) and individual-level variables (such as whether one is an economic winner or loser), which is exactly what we need for testing the aforementioned hypotheses. More precisely, we specify a multilevel model in which we jointly estimate the effect of winner–loser status within and across countries. The level-1 units are individuals and the level-2 units are the country–time-specific surveys.Footnote 28 For computational efficiency, we reduce our data set to those respondents who would either vote for or against EU membership, the two comparison groups in which we are primarily interested. This means that we reduce our dependent variable into two outcomes – ‘for’ and ‘against’ – which then allows us to estimate logistic regression models.Footnote 29 This reduces our sample to a total of about 46,000 individuals with an average survey sample size of about 700 respondents.
To test the two hypotheses specified above, we create two new country-level dummy variables.Footnote 30 The first is a dummy variable indicating whether a country seemed ‘likely’ to join the EU in the future at that point in time: in 1991 and 1992, all countries are coded as 0; in 1995 and 1996, Bulgaria, Romania, and Slovakia are coded as 0 and the remaining countries coded as 1; and from 2001 to 2003, all countries are coded as 1.Footnote 31 To test the claim that support might decline among winners in the most economically advanced countries in the year of the referendum, we code a variable called ‘Economically Advanced’ as 1 for the Czech Republic, Estonia, Hungary, and Poland in 2003, and 0 otherwise.Footnote 32
We first estimate a baseline model (Table 2, Model 1) in which we allow each country–year survey to have its own intercept. Essentially, this can be considered as a robustness test of the results presented in Table 1 (the fully pooled model) in which we are no longer constraining the average support across the countries – independent of the other variables contained in the model – to be equal. We then extend this model by allowing the ‘winner’ and ‘the same’ coefficients to vary by the second-level units. As the second-level units are the country-level surveys, this means that we are now allowing the effect of being a winner to vary across countries and years. All other (individual level) control variables – gender, education, and age – are included as fixed effects as we did not find systematic variation in their coefficients when estimating multinomial logit models on the country–year analyses in the fourth section. In Model 3, we further harness the power of multilevel models to add a series of macroeconomic aggregate level control variables: the EBRD Transition Indicator,Footnote 33 gross domestic product (GDP) as a percentage of GDP in 1989,Footnote 34 and a country’s unemployment rate.Footnote 35 This allows us to examine whether winner/loser status continues to have an effect independent of how well the country as a whole is doing.
Our key results from the previous section continue to hold up well in Models 1–3. The average effect of being a winner is positive, statistically significant, and similar in size across the three models. The average effect of being in ‘the same’ category is positive and statistically significant as well, but again is smaller than the effect of being a winner. The variability of the two coefficients is around 0.60 and 0.30, respectively, indicating that there is quite some variation between country–year observations. In all countries and years, however, winners and ‘the same’ respondents are always more likely to support EU membership than losers. Thus, we can conclude that the results from the previous section are indeed robust to specification in a multilevel modeling framework.
In Models 4 and 5, we test our two new hypotheses regarding the dynamics of public opinion toward EU membership by interacting our key independent variables at the individual level (winner status and ‘the same’ status) with whether one lives in a country that is ‘likely’ to join the EU and (in Model 5) whether one lives in a country that is ‘Economically Advanced’.
The results in Model 4 confirm our hypothesis that the size of the winner–loser effect is affected by a country’s likelihood of joining the EU. Both interaction effects of the ‘likely’ variable are positive and statistically significant. At the same time, the winner coefficient (and the ‘the same’) coefficient remain statistically significant as well, although smaller than when we did not include the interactive effect. What this means is that winners are always more likely than losers to support EU membership, but the magnitude of that effect is greater in times and places when the likelihood of joining the EU is greater. Finally, in contrast to the conventional wisdom, in Model 5, we find that winners in the economically most advanced countries in 2003 (Czech Republic, Estonia, Hungary, and Poland) are actually more likely to support EU membership relative to economic losers than winners in the other country–year pairs.
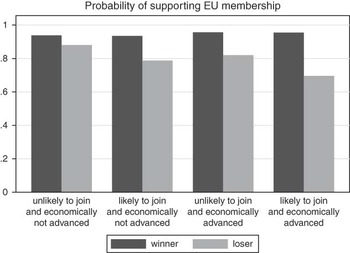
Figure 6 summarizes the results from model 5 by showing predicted probabilities for EU support conditional on whether one lives in a ‘likely’ or ‘Economically Advanced’ country (with all other variables held at their mean or modal values). The probability of supporting EU membership for the ‘average’ respondent is relatively high with about 0.80 for losers and 0.94 for winners.Footnote 36 Living in a ‘likely’ or ‘Economically Advanced’ country slightly increases winner EU support by, on average, 0.02, but clearly increases the differences between winner and loser support from 0.1 in countries that are unlikely to join the EU and that are economically not advanced to about 0.25 in likely and economically advanced countries.
Predicted probabilities of supporting European Union (EU) membership given that a respondent either opposes or supports membership. All other variables are held at their mean or modal values.

The winner variable, furthermore, is a relatively strong predictor for EU support compared with the social-structural variables of sex, education, and age. The coefficient on ‘male’ is relatively small. In terms of predicted probabilities, men are, on average, 0.01 less likely to support EU membership than women. Higher education increases the likelihood of membership support, but only by, on average, 0.01 for secondary education and 0.02 for higher education, both compared to having a primary education. The effect of age is similarly small. Increasing age from, for example, 20 to 80 years, decreases support by, on average, 0.04.
Taken together, the multilevel modeling exercise allows us to make the following three conclusions. First, the general finding regarding the over-time and cross-national preference of winners for EU membership is robust to respecification in a multilevel modeling framework, and it is robust to controlling for macroeconomic factors at the country level. This confirms the evidence from the previous section from the separate, unpooled analyses that the winners–losers finding is not simply picking up the fact that there is more support for EU membership in more economically advanced countries. Second, the size of the gap between winners and losers is larger when countries are more likely to join the EU. Again, this finding is present when controlling for macroeconomic conditions at the country level, which should further convince us as to its validity. Finally, contrary to expectations, we find that the gap between winners and losers is even further pronounced in the most economically advanced countries on the cusp of EU membership.
One final point about Table 2 is worth noting, which is that it provides further evidence along the lines of Figure 1 (which used only raw data), with which we opened the article. As in Figure 1, we find that even in a multilevel framework, there is a statistically significant and negative effect for the EBRD transition indicator at the country level, which means that, all else considered, support for the EU was lower in economically more advanced countries. Most of this effect, however, is likely due to the fact that overall support for EU membership was relatively high in 1991 and 1992 while, at the same time, all countries scored relatively low on the transition indicator variable.Footnote 37 The effect of GDP (relative to 1989), by contrast, is statistically significant and positive. Taken together, this suggests that simply making progress on reform did little to build support for EU membership; recovering from the effects of economic downturns associated with the transition, however, did. For the unemployment rate variable, we do not find a significant effect in any of the models.
Determinants of support for European Union membership: multilevel model analysis

EBRD = European Bank for Recovery and Development; GDP = growth domestic product; ns = non-significant.
Age is recoded to the [0, 1] interval. All coefficients are statistically significant at P < 0.05 unless indicated by ‘ns’.
Conclusion
We conclude by addressing the contributions that our article can make in three important areas: our understanding of public opinion toward the EU in post-communist countries; the value of dynamic analyses of public opinion formation; and, finally, the importance of context in the study of public opinion.
First, we have provided a central unifying framework for public opinion toward EU membership in post-communist countries throughout the entire time period from the collapse of communism until the first eight post-communist countries were admitted to the EU. Drawing on over 60,000 separate interviews with citizens from 10 different countries over a 12-year period, we have presented a parsimonious, yet nuanced, picture of this phenomenon. Simply put, economic winners are more likely to support EU membership than economic losers regardless of a range of sociodemographic characteristics. This rule is remarkably robust to variation in both time and place. The nature of this gap, however, is in part a function of the country’s progress toward EU membership. When membership remains a far off ideal, the gap is smaller; when membership becomes more likely, the gap begins to widen as economic losers become increasingly less enthusiastic about EU membership relative to economic winners. Moreover, counter to expectations, in the most economically advanced (or perhaps most economically reformed) countries on the cusp of membership, the gap is even larger.
Second, we have highlighted the importance of including dynamic analysis in studies of public opinion. The high costs of survey research normally force academics into relying on small numbers of surveys, and in particular on relying on surveys conducted at a particular point in time. The results of this study, however, demonstrate how much we can miss when following this practice. When writing Tucker et al. (Reference Tucker, Pacek and Berinsky2002), in retrospect, we had the good fortune to use 1996 data; had we started with the 1992 data instead, we might very well have gotten nowhere. Similarly, the dynamic framework we have adopted here has allowed us to learn that while the winners–losers gap was present throughout the transition period, it varied in important ways over time. Indeed, we have basically had the fortunate opportunity to watch a crucial area of public opinion develop from scratch. Although, on one hand, we have identified a pattern that is remarkably stable – economic winners were always more supportive of EU membership in post-communist countries than economic losers – on the other hand, we have also identified an important time trend in the data.
Finally, our work highlights the crucial importance of context in the study of public opinion formation. We do not intend any of these findings to be seen as a challenge to the excellent research on attitudes toward EU membership in West European democracies that focuses more explicitly on an individual’s place in the economy and the nature of his or her skill set. Instead, we suggest that although EU membership (or EU deepening) may have had one meaning in the West European context, in the post-communist context it seems to have, at least in part, meant something else. And herein lies a valuable lesson for studies of public opinion generally: just because the same question is asked at different times and in different places, it does not mean that the same theoretical explanations will always be appropriate.
As we noted earlier in this article, our analysis was constrained to the 10 countries included in the CEEB and CCEB for which sufficient data were available because of decisions taken by others long before we began our exploration of the topic. In some ways this is a shame, as the countries in our sample tilt heavily toward those admitted to the EU in the first wave of expansion (8 of the 10 countries), and all 10 were admitted by 2007. For example, including countries such as Croatia, Serbia, and Bosnia would have given us the opportunity to observe countries where similar dynamics were at work, but over a much longer time frame. Would this have delayed the onset of the gap between winners and losers in attitudes toward EU membership? In a different vein, including countries such as Moldova and Ukraine would have allowed us to observe how these dynamics developed in countries where the possibility of EU membership exists, but which for the past 20 years (and probably many more in the future) has not moved beyond that ‘distant far off possibility’ category. Might this eliminate the winners–losers’ gap altogether, or could it potentially exacerbate it? Is there some length of time in the EU queue that might cause different types of effects to emerge? Moreover, studies from any of these countries could address the potentially interesting question of the effect of watching the first post-communist countries that joined the EU in 2004 on attitudes towards membership in the EU in post-communist countries still hoping to get in to the EU. Might there be some sort of large-scale shift in either the level or determinants of support for EU membership in these countries after 2004? Although we will probably never have the opportunity to answer these types of questions with the sort of comparative survey data analyzed in this article, such questions remain interesting topics for future research that can undoubtedly be addressed using country-specific surveys.
Moreover, the fact that all of the countries featured in this study have now joined the EU opens up a fascinating new set of questions for scholars of public opinion. Will attitudes in these countries toward the EU generally, as well as toward EU deepening more specifically, continue to follow a distinctly post-communist logic? If so, will it continue to take the format of the winners–losers divide that governed attitudes toward accession, or will it take some other format? Alternatively, will we see some sort of convergence with the forces that govern attitudes in the original EU-15? Or are we on the cusp of some new sort of divide, with certain forces determining attitudes toward the EU in large member states and other forces in new member states? Either way, our hope is that the basic tools and arguments presented in this article will prove fruitful as a starting ground for answering some or all of these interesting questions.
Acknowledgements
We thank the editors, three very helpful anonymous reviewers, and the participants at NYU’s Spring 2008 In-House Research Seminar for many helpful comments and suggestions. We also thank Nathaniel Beck as well for invaluable advice regarding the statistical analysis in the article.
Appendix
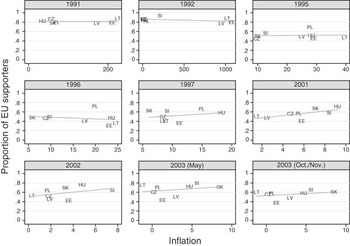
Proportion of European Union supporters in each country–year survey against inflation. Hyperinflation countries Bulgaria and Romania are omitted. Lines are linear regression lines. Countries included are Czech Republic (CZ), Estonia (EE), Hungary (HU), Latvia (LT), Lithuania (LV), Poland (PL), Slovakia (SI), and Slovenia (SK).

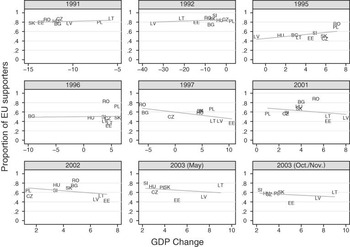
Proportion of European Union supporters in each country–year survey against change in the growth domestic product (%). Lines are linear regression lines. Countries included are Bulgaria (BG), Czech Republic (CZ), Estonia (EE), Hungary (HU), Latvia (LT), Lithuania (LV), Poland (PL), Romania (RO), Slovakia (SI), and Slovenia (SK).

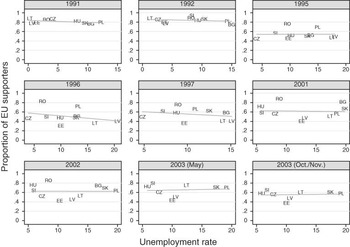
Proportion of European Union supporters in each country–year survey against unemployment rate. Lines are linear regression lines. Countries included are Bulgaria (BG), Czech Republic (CZ), Estonia (EE), Hungary (HU), Latvia (LT), Lithuania (LV), Poland (PL), Romania (RO), Slovakia (SI), and Slovenia (SK).

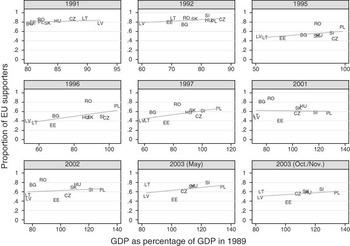
Proportion of European Union supporters in each country–year survey against the growth domestic product relative to 1989. Lines are linear regression lines. Note that in this figure, more economically advanced countries have higher levels of support. Countries included are Bulgaria (BG), Czech Republic (CZ), Estonia (EE), Hungary (HU), Latvia (LT), Lithuania (LV), Poland (PL), Romania (RO), Slovakia (SI), and Slovenia (SK).

Top panel shows proportion of respondents in the highest income group who think that their financial situation will get worse. These respondents would have been classified as economic winners had we used income as measure for economic well-being. Bottom panel shows proportion of respondents in the lowest income group who think that their financial situation will improve. These respondents would have been classified as economic losers had we used income as measure for economic well-being.

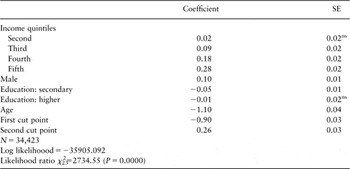
Ordinal probit model of anticipated financial situation on social-structural variables

ns = non-significant.
Dependent variable is coded as 1 = getting worse; 2 = stays the same; 3 = getting better. First income quintile is omitted in-come category, and ‘Education: primary’ is omitted education category. All coefficients are statistically significant at P < 0.05 unless indicated by ‘ns’. Dummies for countries and years are included, but not reported. Countries included in the model are Bulgaria, Czech Republic, Estonia, Hungary, Latvia, Lithuania, Poland, Romania, Slovakia, and Slovenia for the years 1991, 1992, 1995, 1996, 2001, 2002, and 2003. Data on income were not available for Bulgaria 2003; Czech Republic 1992; Hungary 1992; Poland 1992; Romania 1991, 1992, 2003; Slovakia 1992; and Slovenia 1991, 1992.
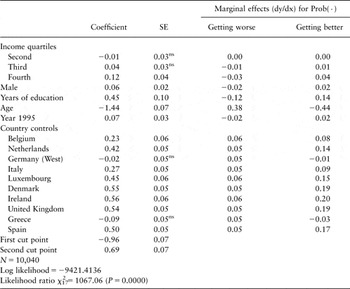
Ordinal probit model of anticipated financial situation on social-structural variables in West Europe, 1995 and 1996

ns = non-significant.
Dependent variable is coded as 1 = getting worse; 2 = stays the same; and 3 = getting better. First income quintile is omitted income category, and France is omitted country dummy. Age is recorded to [0, 1] interval. All coefficients are statistically significant at P < 0.05 unless indicated by ‘ns’.
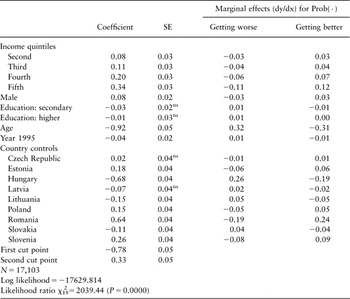
Ordinal probit model of anticipated financial situation on social-structural variables in Central and East Europe, 1995 and 1996

ns = non-significant.
Dependent variable is coded as 1 = getting worse; 2 = stays the same; 3 = getting better. First income quintile is omitted income category, ‘Education: primary’ is omitted education category, and Bulgaria is omitted country dummy. Age recoded to [0,1] interval. All coefficients are statistically significant at P < 0.05 unless indicated by ‘ns’.