Introduction
The dorsal lateral geniculate nucleus (LGN) of the thalamus of primates consists of three functional parallel pathways, named parvocellular (P) layers, magnocellular (M) layers, and koniocellular/interlaminar (K) regions (Kaas et al., Reference Kaas, Huerta, Weber and Harting1978). The P layers transmit visual signals serving high-acuity achromatic vision and red-green color vision, whereas M layers serve motion perception and form vision in low contrast conditions (reviewed by Kaplan, Reference Kaplan, Werner and Chalupa2009; Nassi & Callaway, Reference Nassi and Callaway2009).
The P and M layers receive input from one eye or the other in an alternating fashion (Glees & Le Gros Clark, Reference Glees and Le Gros Clark1941). Despite this anatomical segregation, evidence for binocular interaction in the LGN of primates and carnivores, such as the domestic cat, has accumulated for over half a century. For example, Hayhow (Reference Hayhow1958) found degenerating cell bodies in the interlaminar zones of both the ipsilateral and contralateral LGN following monocular enucleation in cats. There is also electrophysiological evidence for binocular interaction in the LGN: visual evoked responses to dominant eye stimulation with moving bars in the cat LGN are suppressed by concurrent stimulation of the nondominant eye (Sanderson et al., Reference Sanderson, Darian-Smith and Bishop1969; Singer, Reference Singer1970; Sanderson et al., Reference Sanderson, Bishop and Darian-Smith1971; Rodieck & Dreher, Reference RodiecK and Dreher1979; Kato et al., Reference Kato, Bishop and Orban1981; Sengpiel et al., Reference Sengpiel, Blakemore and Harrad1995). Spear and colleagues (Guido et al., Reference Guido, Tumosa and Spear1989; Tong et al., Reference Tong, Guido, Tumosa, Spear and Heidenreich1992; Moore et al., Reference Moore, Spear, Kim and Xue1992) found a mixture of excitatory and inhibitory influences of the nondominant eye in cats; effects were generally similar in X, Y, and W cell classes and were spatial-frequency dependent but not orientation dependent. Moreover, field recordings have shown a reduced LGN postsynaptic field potential (representing massed LGN cell activity) when both optic nerves are stimulated, relative to stimulation of one optic nerve alone (Bishop & Davis, Reference Bishop and Davis1953; Suzuki & Kato, Reference Suzuki and Kato1966). Fewer studies have examined binocular interaction in the primate LGN. Marrocco & McClurkin (Reference Marrocco and Mcclurkin1979) performed simultaneous, independent stimulation of the two eyes with moving bars, while recording extracellularly in the macaque LGN. They found a mixture of facilitatory and suppressive effects of nondominant eye stimulation in a minority of cells (∼13%) tested. Schroeder et al. (Reference Schroeder, Tenke, Arezzo and Vaughan1990) recorded flash responses in the LGN of alert macaques and found more widespread but weak excitatory and inhibitory binocular interactions. On the other hand, Lehky and Maunsell (Reference Lehky and Maunsell1996) found only negligible effects of drifting gratings presented to the nondominant eye in alert macaques.
A recent study from our laboratory made extracellular recordings in the marmoset LGN and found a subset of cells in the K layers that showed similar responses to stimuli presented to each eye independently (Zeater et al., Reference Zeater, Cheong, Solomon, Dreher and Martin2015). This result is consistent with a recent neural tracing study, showing that the K layers in marmosets receive bilateral retinal input (Kwan et al., Reference Kwan, Mundinano, De Souza, Lee, Martin, Grünert and Bourne2018). Zeater et al. found that spike rates in a small sample of K cells (n = 5) were reduced when the stimulus was shown to both eyes, compared with stimulation through the dominant eye alone. The aim of the present study was to expand on the findings of our previous study by characterizing the specific types of binocular summation that occur in the marmoset LGN.
Materials and methods
Ethical approval
Procedures conformed to the Australian National Health and Medical Research Council (NHMRC) code of practice for the care and use of animals and were reviewed and approved by institutional animal care and ethics committees at the University of Sydney.
Animal preparation
The subjects were one male and two female common marmosets (Callithrix jacchus), weighing 340–480 g. Each animal was initially sedated with an intramuscular injection of Alfaxan (12 mg/kg) and diazepam (3 mg/kg). Supplementary doses of Alfaxan were administered as necessary during the surgery. The femoral vein was cannulated for the administration of drugs and fluids, a tracheostomy was performed for artificial respiration (end-tidal CO2 was kept close to 3.7%), and the animal was placed in a stereotaxic frame. Anesthesia was maintained with an intravenous infusion of sufentanil citrate (6–30 µg/kg/h; Sufenta Forte, Janssen Cilag, Beerse, Belgium) in physiological solution (sodium lactate; Baxter International) with dexamethasone (0.4 kg/h; Mayne Pharma, Melbourne, Australia) and Synthamin 17 (amino acids 10%, 225 mg/kg/h; Baxter International, Sydney, Australia). Muscular paralysis was induced and maintained by adding pancuronium bromide (0.3 kg/h; AstraZeneca, Sydney, Australia) to the solution. Body temperature was kept near 37 °C with a heating blanket controlled by a rectal thermistor. Additional antibiotics (25 mg penicillin, Norocillin; Norbrook, Melbourne, Australia) and anti-inflammatories (0.1 mg dexamethasone) were administered by intramuscular injection daily. Pupils were dilated (to 2–4 mm diameter) with phenylephrine hydrochloride (10%; Chauvin Pharmaceuticals, Kingston-upon-Thames, UK) and the corneas were protected with air-permeable contact lenses. A craniotomy and durotomy were made over the LGN to insert the electrode probe. Electrocardiogram and electroencephalogram (EEG) signals were used to monitor the animal’s condition and depth of anesthesia. Dominance of low EEG frequencies (1–5 Hz) and stability of EEG frequency spectrum under intermittent noxious stimulus (tail pinch) were taken as signs of adequate anesthesia level. At the end of the experiment, the animal was euthanized with an intravenous infusion of 300–600 mg/kg sodium pentobarbitone, then transcardially perfused with 0.9% saline, followed by 4% paraformaldehyde in 0.1 m phosphate buffer (PB). The brain was removed and placed in 30% sucrose in 0.1 m PB for subsequent histological track reconstruction.
Visual stimuli
Visual stimuli were generated using Expo (Peter Lennie, New York University). Cone-isolating stimuli were generated by convolution of the peak spectral sensitivities of marmoset cone photoreceptors with the spectral power of the video monitor [R, G, B] guns (Tailby et al., Reference Tailby, Szmajda, Buzás, Lee and Martin2008). Stimuli (circular pulse and drifting sinusoidal gratings) were presented on a monitor (VIEWPixx; Vpixx Technologies, Montreal, Canada, refresh rate 120 Hz) screen for 200 ms against a gray background (mean luminance close to 50 cd/m2). Pulse stimuli consisted of a large circular field (12–19° diameter), varying in contrast and cone-isolating properties to determine the sign (on, off, or on-off) of the cell’s response polarity and chromatic sensitivity. Drifting sinusoidal gratings were also used to characterize contrast and spatial frequency tuning properties. The contrast-modulated gratings were 12–19° in diameter, 0.1–0.5 cycles/degree, and drifted at 3–5 Hz. The spatial frequency modulated gratings were 12–19° in diameter, 50–100% contrast, and drifted at 3–5 Hz.
Cell recording and isolation
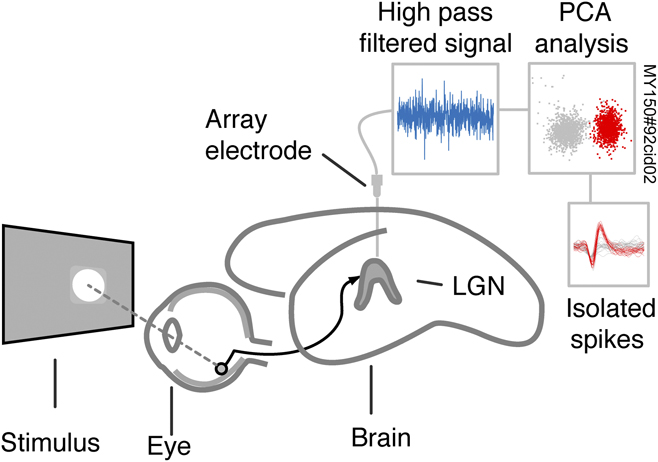
A schematic of the recording setup is shown in Fig. 1. The position of the LGN was established by extracellular recordings using a parylene-coated stainless steel microelectrode (5–11 MOhm; FHC, Bowdoin, ME) mounted on a stereotaxic micromanipulator. The search electrode was then replaced with a NeuroNexus (Ann Arbor, MI) probe, consisting of two shanks separated by 500 µm, each with 16 recording sites at 50 µm separation. In most cases, the nonactive side of the probe was painted with indocarbocyanine dye (DiI) to facilitate track reconstruction. After each set of stimulus presentations, the electrode was advanced by 500 µm in the LGN, and after 30 min settle time, the stimulus set was repeated. Electrode signals were amplified and digitized using a Blackrock Digital Cerebus (Salt Lake City, UT) array system and stored for offline analysis. Single cell responses were isolated from multi-unit activity in Plexon Offline Sorter (Dallas, TX). The raw signal from each recording surface was high-pass filtered and a spike threshold was set. Principal component analysis was then performed on threshold-crossing spikes. Cluster quality metrics (multivariate ANOVA and Dunn index) and refractory period criteria (<2 spikes in 1 ms) were assessed to aid single unit isolation. Cells recorded on more than one surface were reduced to a single data stream. The recording procedure and workflow for processing spikes is shown in Fig. 1.
Schematic diagram of the experimental setup and workflow for processing spikes. Full field circular pulse stimuli (temporal square wave, duration 200 ms) or drifting gratings were presented to each eye independently and to both eyes. Voltage records from a 32 channel array electrode were high pass filtered and single cell responses were isolated using principal component analysis of threshold-crossing triggered voltage records.

Cell classification
The preferred stimulus was determined for each cell as the polarity (on, off, or on-off) and chromaticity (S or ML cone-isolating) that elicited the greatest response. Cells that demonstrated an excitatory evoked response exceeding two standard deviations of the maintained rate were included in the analysis. Single- and multi-unit activities in the parvocellular (P) layers were characterized by tonic responses to maintained contrast, phase-locked modulated responses to gratings drifting at moderate temporal frequencies (∼5 Hz) and clear dominance of single-eye inputs [contralateral eye in the external P layer (Pe) and ipsilateral eye in the internal P layer (Pi)]. Transition of the array electrode from Pi to koniocellular layer K3 was marked by clear reduction in phase-locking and vigor of visual evoked responses, presence of single- and multi-unit responses to S cone-isolating gratings, and slow changes in maintained spiking activity over multi-second timescales (Cheong et al., Reference Cheong, Tailby, Martin, Levitt and Solomon2011). Phase-locked spike activity, single-eye inputs, and vigorous responses to high temporal frequency (>20 Hz) full-field achromatic flicker identified the magnocellular (M) layers.
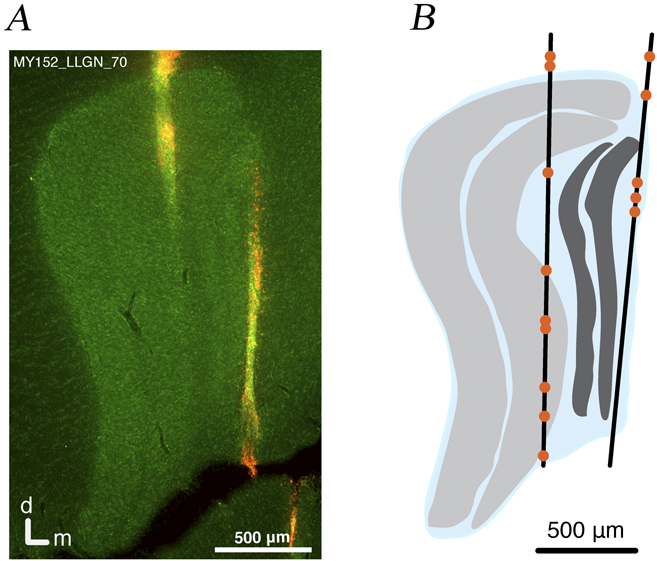
Following perfusion, brains were sectioned coronally and stained with NeuroTrace to visualize Nissl substance, revealing the distinct cellular layers. Sections were photographed using a digital camera (Axiocam HRc, Zeiss, Oberkochen, Germany) mounted on a Zeiss Axioplan 2 microscope. Outlines of the LGN laminae were drawn from the digital micrographs using the Adobe Illustrator (Adobe Inc., San Jose, CA) graphics program. When the electrode was coated with DiI, the resulting fluorescence was visible in the micrographs, otherwise signs of tissue damage were used as position markers. In conjunction with histological reconstruction, correlation of recording position (depth within the LGN) with the functional tests outlined above and functional responses to achromatic and cone-isolating pulse stimuli aided cell classification. An example of a section containing the array electrode path and reconstructed positions of recorded cells is shown in Fig. 2.
Reconstructed recording locations. (A) Micrograph of a Nissl-stained coronal section through the lateral geniculate nucleus showing the electrode trajectory. (B) Line trace reconstruction of this electrode track showing parvocellular (P) layers in light gray, magnocellular (M) layers in dark gray, and koniocellular (K) layers in blue. The orange points indicate the locations of electrode channels, where cell responses were isolated on this track.

Data analysis
Peak response amplitude was calculated from the average peristimulus time histogram (PSTH) (100 repetitions, bin width 10 ms; three-bin moving average). Excitatory peak responses were calculated as the maximum firing rate during the stimulus minus the maintained rate. Suppressive responses were taken as the maintained rate minus the minimum firing rate during the stimulus. Latency to peak response was calculated from the PSTH (bin width 2 ms; three-bin moving average) as the time from the stimulus onset to the maximum (or minimum, for suppressive responses) amplitude. For onset latency, a line was fit between the first bin to exceed two standard deviations of the maintained rate and the peak amplitude. For suppressive responses, the line was fit between the first bin to fall below the maintained rate and the first response trough following stimulus onset. The intersection of this line with the maintained rate was taken as the onset latency.
Nondominant weight was calculated as the nondominant peak amplitude divided by the sum of unsigned dominant and nondominant peak amplitudes:
 $${\rm{NDW}} = {{{\rm{N}}{{\rm{D}}_{{\rm{peak}}}}} \over {\left| {{\rm{N}}{{\rm{D}}_{{\rm{peak}}}}} \right| + |{D_{{\rm{peak}}}}|}},$$
where NDW is nondominant weight and NDpeak and D peak are the peak firing rates elicited through the nondominant eye and dominant eye, respectively. Therefore, excitatory interactions have a positive sign and inhibitory interactions have a negative sign. A nondominant weight of −0.5 indicates inhibitory nondominant input of equal magnitude to the dominant eye input; a value of zero indicates zero input from the nondominant eye and a value of 0.5 indicates equally weighted excitatory inputs from each eye.
Maximum responses to contrast and spatial frequency modulated sinusoidal gratings were taken as the larger of the f0 and f1 components of the Fourier amplitude spectrum of the PSTH response to the preferred stimulus. Fitted contrast tuning curves were obtained using a saturating hyperbolic (“Naka–Rushton”) function:
 $$R = {{{R_{{\rm{max}}}}C} \over {\left( {{C_{50}} + C} \right) + maint}},$$
where R is response amplitude, R max is the maximum response, C 50 is the contrast at the half-maximal response, C is the domain of contrast stimuli, and maint is the maintained firing rate. Spatial frequency tuning curves were fit to a difference of Gaussians model (Croner & Kaplan, Reference Croner and Kaplan1995; Enroth-Cugell & Robson, Reference Enroth-cugell and Robson1966):
 $$R = {K_{\rm{c}}}\pi r_{\rm{c}}^2{e^{\left( { - {{\left( {\pi {r_{\rm{c}}}w} \right)}^2}} \right)}} - \left( {{K_{\rm{s}}}\pi r_{\rm{s}}^2} \right){e^{\left( { - {{\left( {\pi {r_{\rm{s}}}w} \right)}^2}} \right)}},$$
where R is the fitted response, K c is the center gain, r c is the center radius, K s is the surround gain, r s is the surround radius, and w is the domain of stimulus spatial frequency.
Results
The main sample consisted of 12 P-cells, 28 K-cells, and 3 M-cells, classified based on anatomical position in the LGN (as shown in Fig. 2) and visual evoked response properties. All these cells showed excitatory responses to dominant eye stimulation. Four additional cells showed suppressed-by-contrast (SBC, “uniformity detector”) receptive field characteristic (Sivyer et al., Reference Sivyer, Taylor and Vaney2010; Solomon et al., Reference Solomon, Tailby, Cheong and Camp2010). In the following, we first consider summation in receptive fields showing dominant eye excitation; summation in the SBC receptive fields is then considered separately. Not all stimuli were tested for all cells.
Types of binocular summation
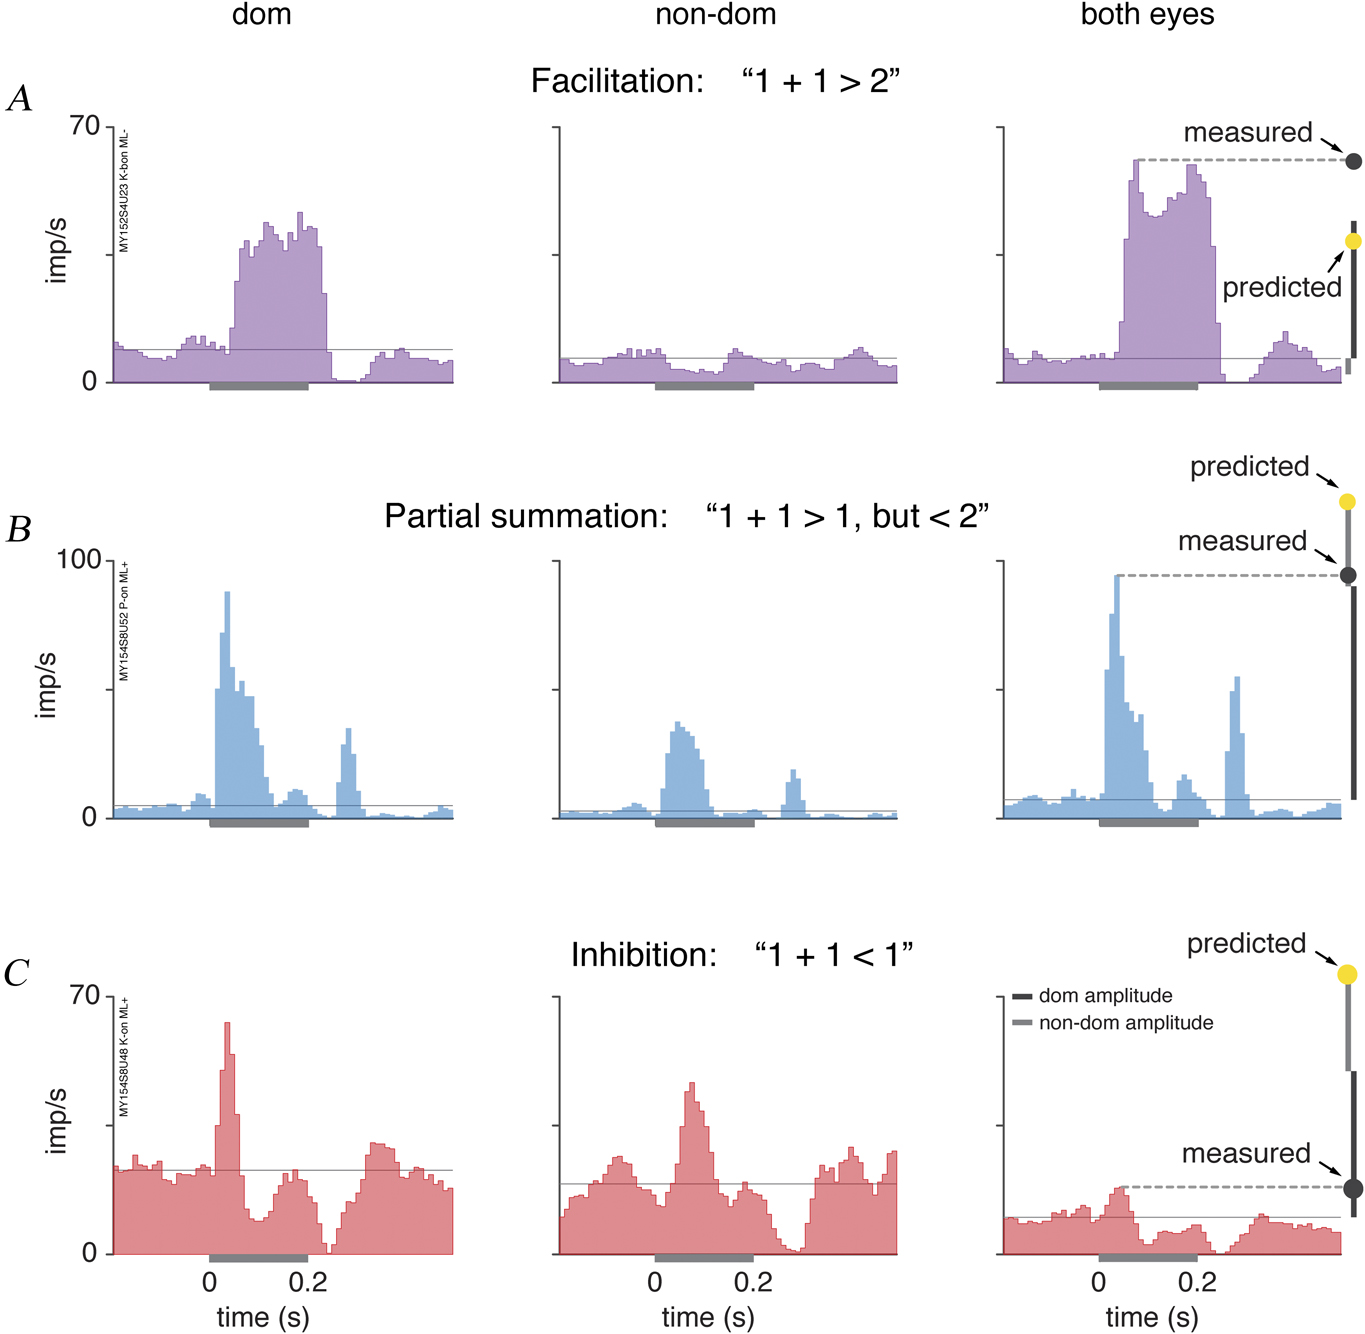
Cells were categorized as demonstrating one of three types of binocular summation: facilitation, partial summation, or inhibition. Examples of responses that fall into each category are shown in Fig. 3. In Fig. 3A, the response of a K blue-on cell to a medium-long wave decrement pulse (ML−) is shown. This cell exhibits a robust excitatory response to dominant eye stimulation, with peak response 38 imp/s at 58 ms following stimulus onset, and response amplitude falls below the maintained level when the stimulus is presented through the nondominant eye alone. However, when the stimulus was presented through both eyes, the peak rate (54 imp/s at 66 ms following stimulus onset) was larger than the linear sum of the dominant and nondominant eye peak responses. Hence, this cell demonstrates binocular facilitation. An example of partial binocular summation is shown in Fig. 3B. This on-center P-cell exhibits excitatory responses to stimulation of either eye independently. When the stimulus was presented to both eyes, the peak amplitude (87 imp/s at 28 ms following stimulus onset) was larger than the dominant eye response (83 imp/s at 28 ms following stimulus onset) but smaller than the linear sum (118 imp/s) of the two monocular responses. Hence, this cell demonstrated partial summation. Finally, an example of binocular inhibition is shown in Fig. 3C. This on-center K-cell shows excitatory responses to stimulation of both the ipsilateral (left panel, 40 imp/s at 28 ms following stimulus onset) and contralateral eye (center panel, 28 imp/s at 68 ms following stimulus onset). Here, however, when the stimulus was presented to both eyes, the peak amplitude (8 imp/s at 38 ms following stimulus onset) falls below the dominant eye response amplitude, hence this cell is categorized as showing binocular inhibition.
Classification of binocular interactions. Each row shows responses of one cell. Left column shows PSTH of responses to stimuli (square-wave 200 ms pulse stimulus at preferred contrast and chromaticity) presented to the dominant (dom) eye. Center column shows responses to nondominant (non-dom) eye stimulation. Right column shows responses to binocular (both eyes) stimulation. Dark and light gray bars at right show the dom and non-dom eye peak amplitudes, respectively. Gray points show measured binocular response amplitude and yellow points show the linear sum of dom and non-dom responses. Stimulus duration (200 ms) is shown by the gray bar on the x axes. (A) K-cell exhibiting non-dom inhibition and binocular facilitation. (B) P-cell exhibiting excitatory binocular convergence and partial (sublinear) binocular summation. (C) K-cell exhibiting excitatory binocular convergence and binocular inhibition.

Binocular stimulation yields weak inhibition
Under binocular stimulation with temporal square-wave 200 ms pulses, peak response amplitude in most cells tested (14/23, 61%) was reduced relative to monocular stimulation through the dominant eye (i.e., binocular inhibition). Five further cells (22%) showed partial binocular summation. For these response categories considered together (i.e., over 80% of the sample), the binocular response amplitude is lower than that predicted by the sum of dominant and nondominant eye stimulation. Four cells showed binocular facilitation. Interestingly, three of these cells (three K-cells) showed nondominant suppression for monocular stimuli (i.e., an excitatory response through the dominant eye and suppression through the nondominant eye). A potential explanation for this result comes from a study in cat LGN, which showed that GABAergic inhibition from the nondominant eye is reduced by dominant eye stimulation (Pape & Eysel, Reference Pape and Eysel1986), but this experiment has not to our knowledge been carried out in marmosets.
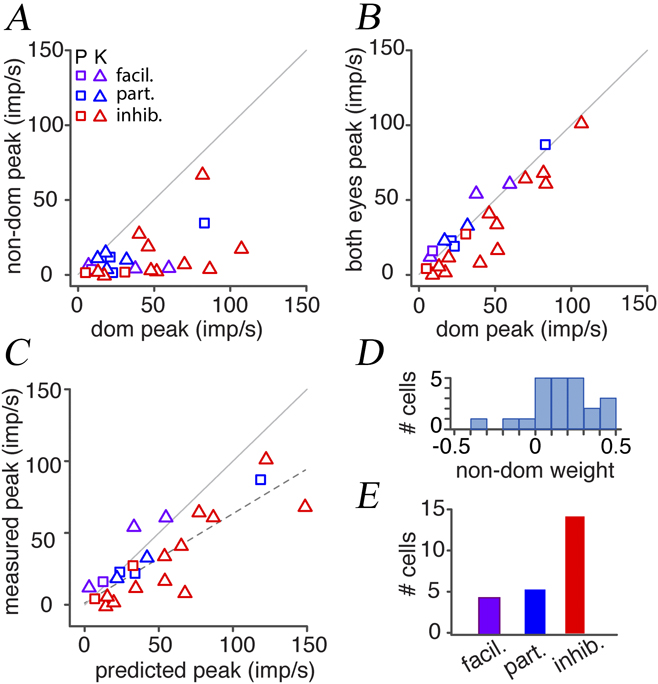
The population data for pulse stimuli are summarized in Fig. 4. In Fig. 4A, peak responses are plotted for dominant eye versus nondominant eye stimulation. These data show the same pattern as in our previous study (Zeater et al., Reference Zeater, Cheong, Solomon, Dreher and Martin2015)—most cells exhibit monocular excitation but a small proportion (predominantly K-cells) exhibit signs of convergent binocular excitation. In Fig. 4B, peak responses are plotted for dominant eye stimulation versus stimulation of both eyes. Here, cells showing facilitation and partial summation fall above the unity line (solid gray line), and cells showing binocular inhibition fall below the unity line. The most important thing to note here is the high correlation between response amplitude under binocular or monocular stimulation (r 2 = 0.83; P < 0.01), that is, having two eyes open has only weak effects on visual evoked responses in LGN. Consistently, peak response amplitudes were smaller, but only marginally so, when the stimulus was shown to both eyes compared with the dominant eye (P = 0.04, two-tailed Wilcoxon nonparametric signed rank test).
Population responses to pulse stimuli. Symbols are color-coded: purple, cells showing facilitation (facil); blue, cells showing partial summation (part); red, cells showing inhibition (inhib). (A) Peak responses plotted for dominant (dom) vs. nondominant (non-dom) eye stimulus presentation. (B) Peak response amplitude for dom eye stimulation vs. binocular (both eyes) stimulation. (C) Linear sum of dom and non-dom (predicted) peak amplitude vs. binocular response amplitude (measured). (D) Weight of nondominant eye input (calculated as described in Materials and methods). (E) Number of cells exhibiting facilitation (facil), partial summation (part), and inhibition (inhib).

In Fig. 4C, the linear sum of dominant and nondominant eye peak responses (predicted peak) is plotted against responses to binocular stimulation (measured peak). Here, cells demonstrating facilitation fall above the unity line, while cells demonstrating sublinear summation (partial summation or inhibition) fall below the unity line. The dotted line shows the linear regression. Measured peak responses (when the stimulus was shown to both eyes) were significantly smaller than the linear sum (predicted) (P < 0.01, Wilcoxon nonparametric signed rank test), but as expected from the overall weak magnitude of binocular inhibition, there was a high correlation between measured and predicted responses (r 2 = 0.69, P < 0.01). Because we targeted K layers for recording, we expected monocular nondominant eye stimulation to yield excitatory effects in around one third of recorded K-cells (Zeater et al., Reference Zeater, Cheong, Solomon, Dreher and Martin2015). This expectation was confirmed (Fig. 4D), despite the overall dominance of inhibitory binocular interaction in the dataset (Fig. 4E). Moreover, as noted above, the three K-cells that showed binocular facilitation also exhibited nondominant suppression. We return to the implications of these findings in a later section; for now, they highlight an interesting aspect of our results: all nine cells with excitatory input from both eyes showed sublinear summation when both eyes were open.
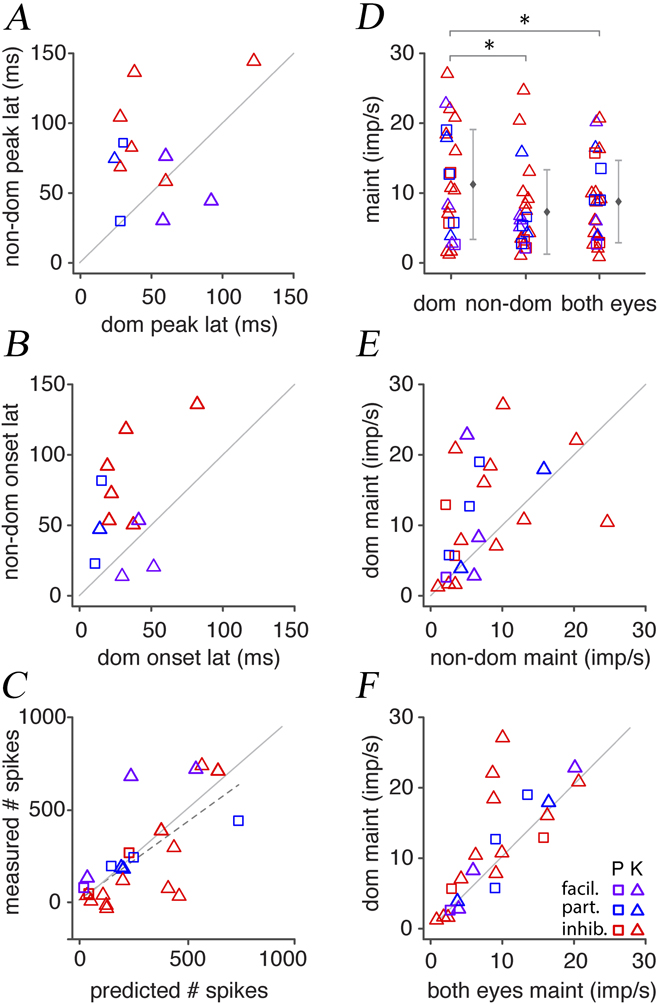
Differences in peak response time between the two eyes could potentially explain the trend of sublinear binocular summation; in other words, if the two eye responses are smeared in time, the peak responses will not add linearly. We therefore calculated latency to peak response and response onset latency. This analysis was restricted to cells classified as showing excitatory binocular inputs (i.e., excitatory response amplitude greater than 2s.d. above maintained rate for monocular stimuli delivered through either eye). Note that symbols in Fig. 5 are colored according to summation in peak response as defined in Fig. 3. Of these 12 cells with binocular excitatory inputs, nine (75%) had longer peak latencies when the stimulus was shown to the nondominant eye, and three (25%) had longer peak latencies when the stimulus was shown to the dominant eye (Fig. 5A). These differences in peak latency between the dominant (mean = 50.3 ms) and nondominant (mean = 77.7 ms) eye were however small (P = 0.05, two-tailed Wilcoxon nonparametric signed rank test). A similar trend was observed for onset latency, where 10 of 12 cells (83%) exhibited longer latencies through the nondominant eye and two (17%) had longer latencies through the dominant eye. Onset latency was longer through the nondominant eye (mean = 63.2 ms) than through the dominant eye (mean = 31.4 ms, P = 0.02). Peak and onset latencies through the dominant eye and both eyes were highly correlated (r 2 = 0.90, P < 0.01 for dominant eye; r 2 = 0.88, P < 0.01 for both eyes). Peak and onset latencies were marginally longer through the nondominant eye than through the both eyes (P = 0.04 for nondominant eye; P = 0.03 for both eyes) and weakly correlated (r 2 = 0.10, P = 0.31 for nondominant eye; r 2 = 0.18, P = 0.16 for both eyes). Thus, in common with effects on response amplitude, having two eyes open has little effect on response latency in the LGN.
Analysis of response latency and maintained activity. (A) Latency (lat) to peak response for dominant (dom) eye vs. nondominant (non-dom) eye stimulation. (B) Onset latency for dom eye vs. non-dom stimulation. (C) Linear sum of total number of spikes (predicted) vs. total number of spikes when both eyes were open (measured). (D) Maintained (maint) firing rates when dom, non-dom (center), or both eyes (right) were open. Error bars in panel D show mean +/− standard deviation. (E) Maintained firing rates for non-dom vs. dom eye open. (F) Maintained firing rates for both eyes vs. dom eye open.

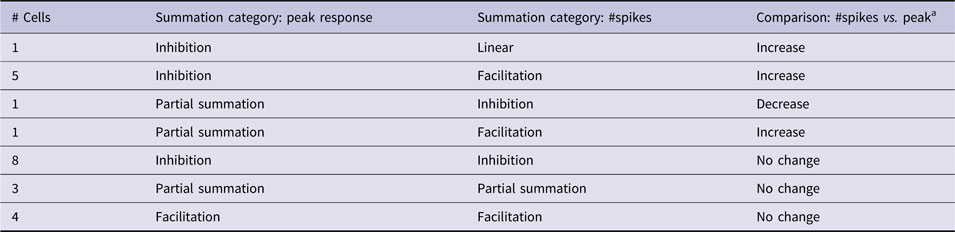
One further line of evidence supports the idea that sublinear summation of peak amplitude is attributable to differences in response latency between the two eye inputs. The total number of spikes recorded (minus baseline firing rate) across the stimulus window for a stimulus shown to both eyes was close to the linear sum of spikes for stimuli shown independently to each eye (P = 0.50, two-tailed Wilcoxon signed rank test), and there was a moderate correlation between the measured and predicted values (r 2 = 0.50, P < 0.01; Fig. 5C). Seven cells showed an increase and one cell showed a decrease in degree of summation on comparing total spikes with peak amplitude. The remaining cells showed no change in summation category. This result is summarized in Table 1. Overall, 12 of 23 cells (52%) exhibited sublinear summation in both peak response and total number of spikes.
Comparison of summation category when total number of spikes was considered, rather than peak responses
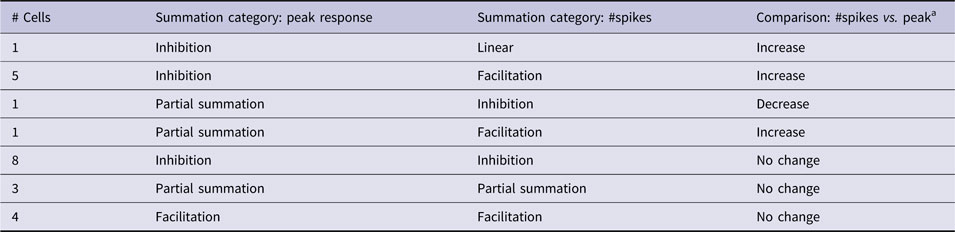
a Change (if any) in degree of summation.
The weak inhibitory effect of nondominant eye inputs is also manifested as mild reduction in maintained discharge rate when the nondominant eye is open. A comparison of maintained firing rates on viewing a mean luminance gray screen (measured across 700 ms) is shown in Fig. 5D. The maintained firing rate was marginally higher on stimulus presentation to the dominant eye than either the nondominant eye alone (P = 0.03, two-tailed Wilcoxon nonparametric signed rank test; Fig. 5E), or both eyes together (P = 0.04; Fig. 5F).
In summary, our sample of cell recordings targeted to the K layers showed overall weak suppressive effects of the nondominant eye on maintained activity and responses to flashed stimuli. The P-cells recorded showed a consistent pattern of responses to that exhibited by the K-cells but a larger sample would be required to draw firm conclusions about P-cells. The very high contrast sensitivity of M-cells makes it difficult to interpret responses to high-contrast flashed stimuli, hence they were not included in this analysis.
Summation of responses to drifting gratings
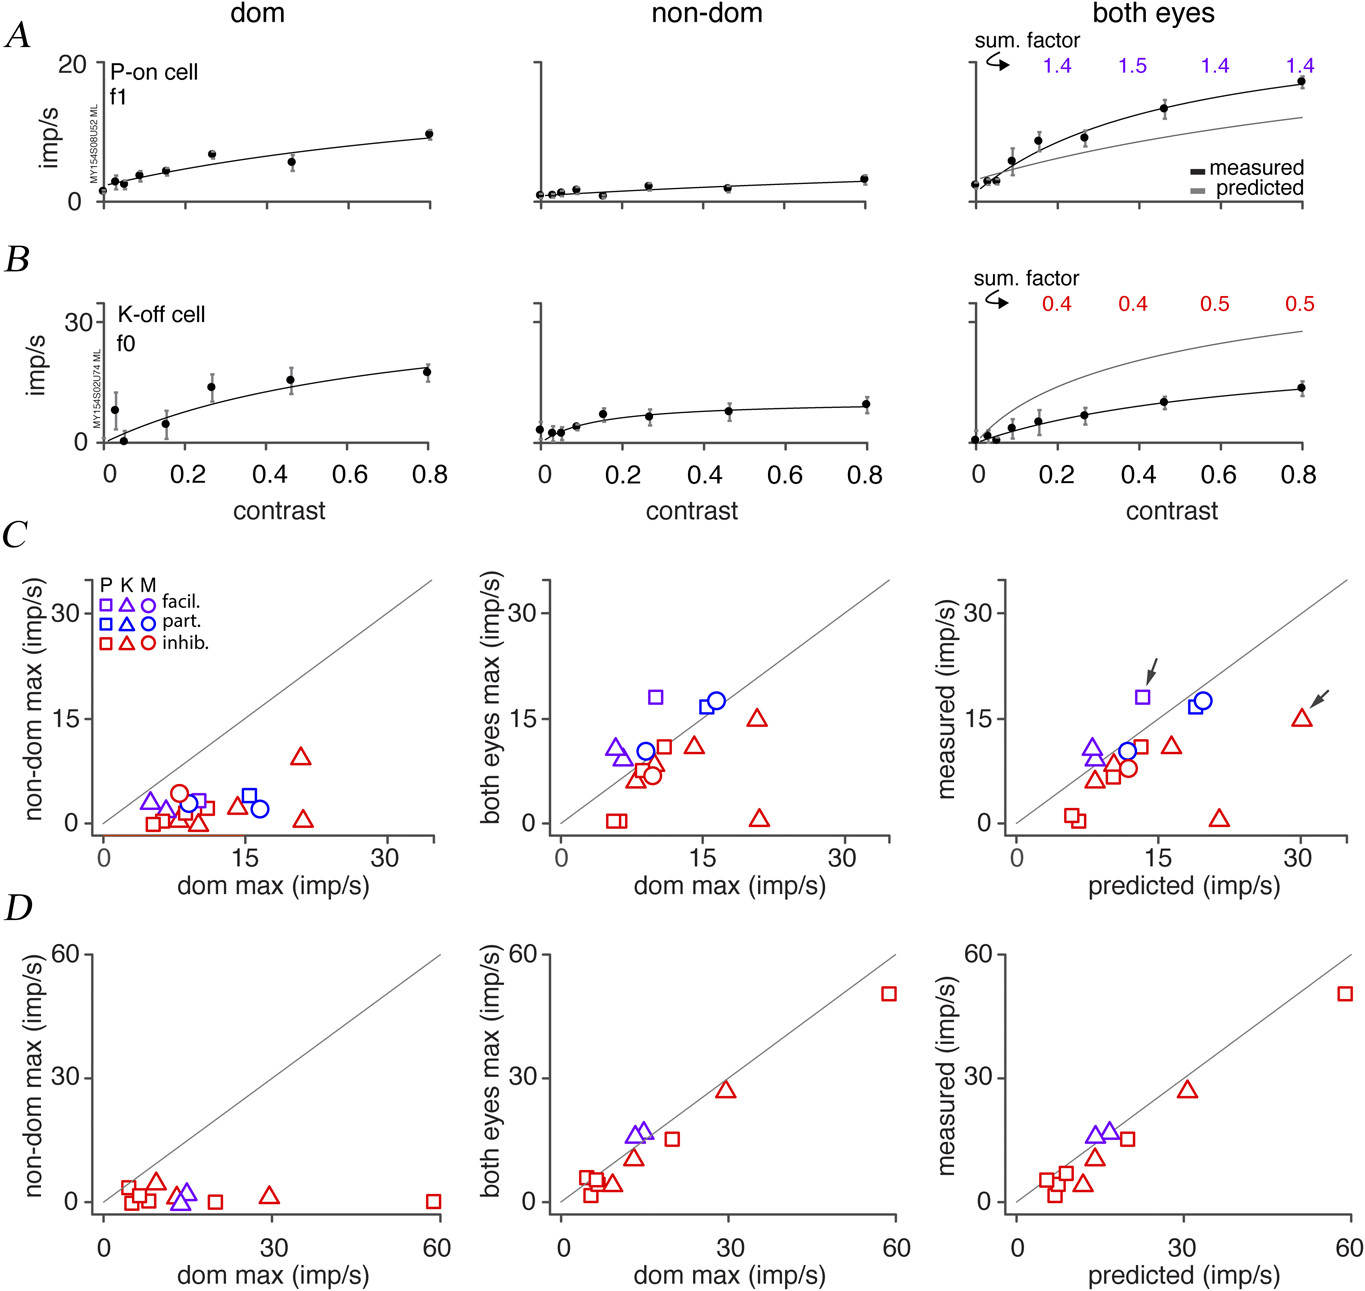
The predominantly inhibitory effect of binocular flashed stimuli was also observed for drifting gratings. Cells were classified as showing facilitation, partial summation, or inhibition relative to maximum responses to the preferred stimulus. The contrast–response functions of two cells are shown in Fig. 6A and 6B. The summation factor (right panel) was calculated as the measured response divided by predicted response. The P-on cell in panel A is the cell shown in Fig. 3B that exhibited partial summation. Interestingly, the f1 contrast–response function of this cell demonstrated facilitation, being above the predicted curve (the sum of the dominant and nondominant eye curves), and having a summation factor >1 at each 20% contrast step. The K-off cell (Fig. 6B) demonstrated increase in f0 (average firing rate) for stimuli shown to each eye independently and sublinear summation when the stimulus was shown to both eyes. Thus, the measured curve falls below the predicted curve, and the summation factor is ≤0.5 at each 20% contrast step. Maximum responses to a drifting grating modulated in contrast (n = 16) are plotted in Fig. 6C. The cells in panels A and B are indicated by arrows (Fig. 6C, right panel). Most cells (10/16, 63%) demonstrated binocular inhibition, three (19%) showed weak facilitation and three showed partial summation. There was no significant difference between responses to stimuli shown to both eyes compared with the dominant eye only (P = 0.26, two-tailed Wilcoxon nonparametric signed rank test; Fig. 6C, center panel). Measured responses were, nevertheless, significantly smaller than predicted responses (P = 0.02; Fig. 6C, right panel). There was no significant difference in half-maximal contrast when the stimulus was shown to the dominant eye (mean = 0.20, s.d. = 0.09) versus both eyes (mean = 0.23, s.d. = 0.09, n = 13, P = 0.52).
Contrast–response functions. (A) P-on cell. Left column shows dominant (dom) eye response, center panel shows nondominant (non-dom) eye response, and right panel shows binocular (both eyes) response. Data points show mean ± s.e.m. Smooth curves show Naka–Rushton fits. Gray line shows predicted (dom + non-dom) response. Summation factor (sum. factor) is the measured:predicted response ratio. This cell shows binocular facilitation. (B) K-cell showing sublinear summation. (C) Measured maximum responses to a contrast-modulated sinusoidal grating (n = 16) presented to the dominant (dom) vs. nondominant (non-dom) eye (left panel), dom eye vs. both eyes (center panel), and comparison (right panel) of the linear sum of the dom and non-dom eye responses (predicted) vs. both eyes (measured). The cells shown in panels A and B are indicated by arrows. (D) Maximum responses to spatial frequency–modulated sinusoidal gratings at optimal spatial frequency (n = 11) in the same format as C.

Maximum responses to a drifting grating modulated in spatial frequency (n = 11) are plotted in Fig. 6D in the same format as Fig. 6C. Out of 11 cells, 9 (82%) demonstrated inhibition and 2 (18%) demonstrated facilitation. Responses to stimuli shown to both eyes were marginally smaller than the dominant eye (P = 0.02, two-tailed Wilcoxon signed rank test), and predicted responses were likewise marginally smaller than the predicted linear sum (P < 0.01).
SBC responses
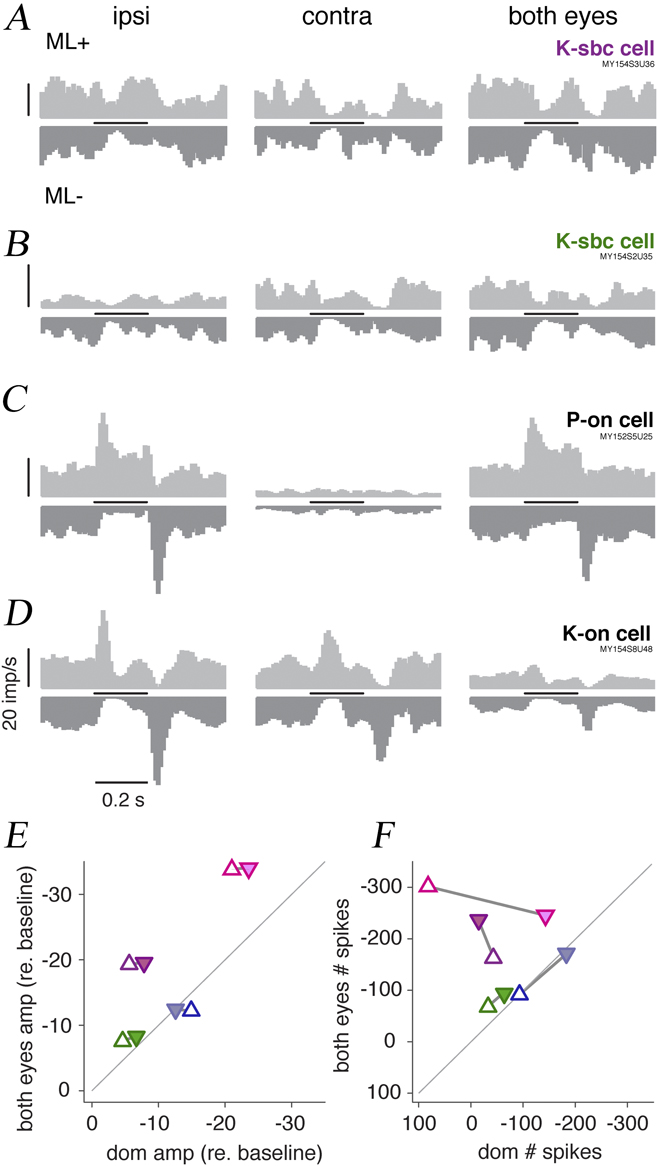
Four cells demonstrated SBC response profiles, as shown in Fig. 7. The SBC receptive fields (Fig. 7A and 7B) are distinguished by a decrease in firing rate in response to both medium-long wave light increments (ML+) and decrements (ML−). All four SBC cells showed very similar response profiles when stimuli were presented to either eye (Fig. 7A and 7B; see also Zeater et al., Reference Zeater, Cheong, Solomon, Dreher and Martin2015). For comparison, responses of a monocular-excited P-cell (Fig. 7C) and a binocular-excited K-cell (Fig. 7D) to these stimuli are also shown. The binocular K-cell response to the ML+ stimulus is the same as that shown in Fig. 3C. What becomes apparent from Fig 7A and 7B is a common pattern of summation in the SBC cells for both positive and negative polarity stimuli. Response amplitudes of the four SBC cells recorded are plotted relative to baseline in Fig. 7E and 7F. The left panel shows reduction in amplitude relative to baseline. Three of the four cells exhibited greater suppression when stimuli were shown to both eyes, compared with the dominant eye. A consistent pattern is seen Fig. 7F, where total number of spikes relative to baseline is plotted. Three of four SBC cells showed decrease in total spikes when the stimulus was shown to both eyes. These data suggest that response suppression in SBC cells is increased under binocular stimulation, but a larger sample of SBC cells would be needed to draw firm conclusions.
Binocular summation in SBC cells. (A) PSTHs of an SBC cell responding to pulse stimuli presented to the ipsilateral (ipsi) eye (left panel), contralateral (contra) eye (center panel), and both eyes (right panel). Stimulus was a medium-long wave increment (ML+, up-going PSTH) or decrement (ML−, down-going PSTH). Stimulus duration (200 ms) is shown by the horizontal bar. Scale bar in the left panel shows 20 imp/s. Note the similar pattern of suppression for ML+ and ML− stimuli. (B) Another example SBC cell. (C) Parvocellular-on (P-on) cell excited by an ML+ and inhibited by ML− stimulus shown to the ipsi eye. This cell showed no response to contra eye stimulation. (D) Binocular-excited K-on cell shows excitatory response to an ML+ stimulus shown to either eye and binocular inhibition. (E) Response amplitudes of four SBC cells, to dominant (dom) eye versus binocular presentation of ML+ (up triangles) and ML− (down triangles) pulse stimuli (200 ms). Each cell is shown in a different color, including the cells in panels A (purple) and B (green). Maximal decrease in spike rate with respect to baseline is shown. (F) Decrease in total number of spikes with respect to baseline. Overlapping data points have been separated for visual clarity.

Discussion
The present results indicate that binocular interactions in the LGN are mostly weak and inhibitory in nature. Overall, most cells exhibited sub-linear summation (partial summation and inhibition), with fewer cells showing facilitation for flashed stimuli (Fig. 4) or drifting gratings (Fig. 6). We first consider the role of response timing in binocular interactions, then compare our results with those of recent studies in rodent LGN, then consider possible sources of binocular inputs to LGN in marmosets.
Sublinear summation
The pattern of sublinear summation found in the present study could be best explained by latency differences between the signals arriving from each eye (Fig. 5A and 5B). Peak latency and onset latency were on average 27 ms and 32 ms slower through the nondominant eye, respectively. Consistently, a greater degree of summation occurred when considering the total number of spikes recorded, rather than peak responses. When the total number of spikes was considered, seven cells (30%) increased in degree of summation. However, 12 cells (52%) exhibited sublinear summation in both peak response and total number of spikes. This pattern of inhibition may related to the decrease in maintained firing rate under binocular, compared with dominant eye stimulation (Fig. 5F).
In the present study, only 3 of 23 (13%) cells showed clear signs of nondominant suppression, with 60–90% reduction in firing rate relative to baseline. All three were K-cells. Rodieck & Dreher (Reference RodiecK and Dreher1979) found nondominant suppression was absent in P-cells and present in about one third of M-cells, where present the average magnitude of suppression was ∼25%. Schroeder et al. (Reference Schroeder, Tenke, Arezzo and Vaughan1990) recorded flash-evoked multiunit activity in the LGN of alert macaques. They found nondominant suppression at about one third of their recording sites, with reductions of 10–45% below baseline. Notably, they showed an example of nondominant suppression coexisting with binocular facilitation, as we found (Fig. 3A). Overall, on comparing these studies, the prevalence of nondominant suppression appears greater when flashed or strobe stimuli are used than when moving bars are used.
In contrast to the monkey, nondominant suppression is exhibited by most geniculate cells in the cat, in responses to moving bars (Sanderson et al., Reference Sanderson, Darian-Smith and Bishop1969; Singer, Reference Singer1970; Sanderson et al., Reference Sanderson, Bishop and Darian-Smith1971; Rodieck & Dreher, Reference RodiecK and Dreher1979; Kato et al., Reference Kato, Bishop and Orban1981). It has also been shown that most cells show suppressed responses under binocular compared with dominant eye stimulation (Xue et al., Reference Xue, Ramoa, Carney and Freeman1987; Moore et al., Reference Moore, Spear, Kim and Xue1992), in line with our findings here in marmosets. Guido et al. (Reference Guido, Tumosa and Spear1989) showed that X, Y, and W cell types in cat showed broadly similar patterns of nondominant eye effects (W-cell types in cats bear some homologies to K-cells in marmosets). Field recordings in the cat LGN have shown that when both optic nerves are stimulated, the optic radiation potential is reduced (Bishop & Davis, Reference Bishop and Davis1953; Suzuki & Kato, Reference Suzuki and Kato1966). Suzuki & Kato (Reference Suzuki and Kato1966) delivered a conditioning stimulus to one nerve preceding a test stimulus to the other. They found that increasing the strength of the conditioning stimulus resulted in failure of the test stimulus to evoke action potentials. This result was explained by subsequent intracellular recordings, where stimulation of the nondominant optic nerve evoked an inhibitory postsynaptic potential. However, these findings do not explain why most cells in the present study on marmosets showed suppression under binocular stimulation, whereas only 3 of 23 cells showed nondominant suppression. A potential explanation is that inhibitory circuits (e.g., recurrent feedback from the thalamic reticular nucleus) are engaged to a greater extent when both eyes are open. And to complicate things further, as noted above in relation to Fig. 3, there is evidence from cats that afferent activity from the dominant eye reduces GABAergic inhibition from the nondominant eye (Pape & Eysel, Reference Pape and Eysel1986). In sum, the questions whether nondominant eye responses and binocular responses are separable, and whether the underlying circuitry is the same or different, remain open.
Schroeder et al. (Reference Schroeder, Tenke, Arezzo and Vaughan1990) described binocular suppression interaction at 64% of their multiunit recording sites. This interaction was marked by a decrease in multiunit activity when a flashed stimulus was shown to both eyes compared with the dominant eye. Similarly, we found that 61% of cells showed binocular reduction in peak response amplitude. Schroeder et al. also identified responses under binocular stimulation that exceeded the sum of monocular responses, in common with the few cells that showed facilitation in our study. Further, they found that multiunit activity at some sites, under binocular stimulation, showed altered time course relative to the dominant eye response. In contrast, we found a high correlation in response latency through the dominant eye and both eyes. Notably, Schroeder et al. (Reference Schroeder, Tenke, Arezzo and Vaughan1990) did not target the K layers of LGN and identified all binocular cells as P-cells or M-cells. On the other hand, we targeted all K layers, since we now know that a subset of K-cells can be visually evoked via either eye (Zeater et al., Reference Zeater, Cheong, Solomon, Dreher and Martin2015). Based on anatomical position and functional responses, there were 13 K-cells (K1, K3-5) and 2 P-cells (P1) that were excited (>2 s.d. from maintained rate) by stimuli shown to either eye. Thus, the difference between our results and those of Schroeder et al. may be attributed to the larger proportion of K-cells in our sample.
Binocular interaction in rodents
One previous study using a mouse model found that the most common binocular interaction in the LGN was characterized by a brisk increase in firing when a full field stimulus was shown to either eye (Howarth et al., Reference Howarth, Walmsley and Brown2014). Under light-adapted conditions, binocular cells demonstrated a significantly lower half-maximal contrast under binocular, compared with dominant eye stimulation. Hence, the authors concluded that at least one purpose of binocular integration in the LGN is to increase the detectability of weak stimuli. This result is in line with an earlier finding in the rat LGN, where cells having receptive fields in the binocular overlap region of the visual field were equally excited by spots of light shown to either eye (Grieve, Reference Grieve2005). Grieve did not, however, measure responses under binocular stimulation to determine the nature of this interaction. In comparison, the present study found no difference in half-maximal contrast under binocular and dominant eye stimulation. Hence, binocular interaction in the LGN may serve different roles in rodents and primates. Zeater et al. (Reference Zeater, Cheong, Solomon, Dreher and Martin2015) summarize homologies between K-cells and rat LGN cells.
Sources of binocular input
Based on the results of Kwan et al. (Reference Kwan, Mundinano, De Souza, Lee, Martin, Grünert and Bourne2018), bilateral retinal input is a likely source of input to K-cells with short response latencies through either eye. However, peak response latency ranged from 24 to 122 ms (mean = 50.3 ms) through the dominant eye, and 30 to 144 ms (mean = 77.7 ms) through the nondominant eye. This is in line with the previous results, where the nondominant eye latency was ∼20 ms longer than that of the dominant eye (Zeater et al., Reference Zeater, Cheong, Solomon, Dreher and Martin2015), making it unlikely that the retina is the only source of binocular inputs to the LGN.
The visual cortex is a major source of input to the LGN (Guillery, Reference Guillery1969) and could account for binocular responses in cells with longer response latencies. Suzuki and Kato (Reference Suzuki and Kato1966) found that neurons in the cat LGN demonstrated much shorter response latencies following cortical stimulation compared with optic nerve stimulation and suggested that the inhibitory effect of stimulating both optic nerves may occur via a recurrent pathway involving the visual cortex. Schmielau and Singer (Reference Schmielau and Singer1977) showed corticofugal projections are involved in both facilitatory and inhibitory binocular interactions in the cat LGN. They suggested that corticofugal input enhances signals from objects on the fixation plane and inhibits signals from objects outside the fixation plane, hence improving figure/ground contrast. Corticogeniculate V1 neurons in macaque have been found to return feedback to the LGN on average 52.5 ms after visual stimulation (Briggs & Usrey, Reference Briggs and Usrey2007), in line with the latency range found here.
The superior colliculus (SC) also provides input targeting the K layers of the LGN in both diurnal and nocturnal primates. Retrograde tracing studies have shown that the stratum griseum superficiale of the SC projects to the K layers of LGN in Macaca, Saimiri, Aotus, Galago (Harting et al., Reference Harting, Huerta, Hashikawa and Van Lieshout1991), and marmoset Callithrix jacchus (Zeater et al., Reference Zeater, Buzás, Dreher, grünert and Martin2019; Kwan et al., Reference Kwan, Mundinano, De Souza, Lee, Martin, Grünert and Bourne2018). The SC itself is known to receive bilateral retinal input, as shown by combined autoradiography and degeneration methods in the macaque (Pollack & Hickey, Reference Pollack and Hickey1979) and neural tracing in the marmoset (Kwan et al., Reference Kwan, Mundinano, De Souza, Lee, Martin, Grünert and Bourne2018). Hence, the SC could provide input from either eye to the LGN. Two other brainstem structures, the parabigeminal nucleus and nucleus of the optic tract, have likewise shown retrograde labeling following injection of the ipsilateral LGN (Zeater et al., Reference Zeater, Buzás, Dreher, grünert and Martin2019), indicating further possible sources of binocular input. Finally, there is evidence from cat studies that interneurons could be a source of inhibitory nondominant eye input to LGN cells. For example, Dubin and Cleland (Reference Dubin and Cleland1977) found intrageniculate neurons that received direct retinal innervation and hence could provide feedforward inhibition. They also found perigeniculate neurons that could be activated transsynaptically from the visual cortex and also provide feedback inhibition to LGN.
Role of binocular convergence
Most cells showed sublinear summation in peak response and total spike count when a stimulus was shown to both eyes, compared with the dominant eye. The interactions described here and the high frequency of inhibition exhibited by single cell responses are consistent with previous interactions described in the macaques (Schroeder et al., Reference Schroeder, Tenke, Arezzo and Vaughan1990) and cats (Xue et al., Reference Xue, Ramoa, Carney and Freeman1987). Hence, a role of binocular convergence for enhancing detection of weak stimuli, as suggested by the rodent studies cited above, can be ruled out. A limitation to this conclusion is that most of our results were obtained using high-contrast stimuli and large (12–19° diameter) stimulus fields, which would activate extraclassical inhibition in all classes of LGN cells (Solomon et al., Reference Solomon, White and Martin2002), and could saturate the responses of cells with high contrast sensitivity. Further, subtle effects on contrast sensitivity with spatially restricted stimuli and/or low-contrast stimuli cannot be ruled out. It has been reported that binocular cells in the cat LGN have corresponding receptive fields in each eye (Sanderson et al., Reference Sanderson, Darian-Smith and Bishop1969; Singer, Reference Singer1970); however, this result has not been systematically tested in marmosets and remains a question for future studies.