INTRODUCTION
Variations in the atmospheric 14CO2 concentration over time are well known and have been the focus of radiocarbon (14C) research aimed at improving the conversion of measured 14C concentrations into calendar ages. The IntCal calibration synthesizes the available data, which is based on dendro-dated tree-ring 14C measurements for the Holocene period (Reimer et al. Reference Reimer, Bard, Bayliss, Beck, Blackwell, Bronk Ramsey, Buck, Cheng, Edwards, Friedrich, Grootes, Guilderson, Haflidason, Hajdas, Hatté, Heaton, Hoffmann, Hogg, Hughen, Kaiser, Kromer, Manning, Niu, Reimer, Richards, Scott, Southon, Staff, Turney and van der Plicht2013). With increasing demands on both accuracy and precision of the 14C calibration, the question whether discrepancies between different datasets used in IntCal result from measurement uncertainties or reflect real atmospheric differences becomes highly important.
A generally close agreement exists between the different datasets in the IntCal calibration curve, which are mostly from trees at mid-latitudes. In the late-19th and early-20th centuries, terrestrial tree-ring measurements from the Northern Hemisphere are derived from Douglas fir (Pseudotsuga menziesii) from Washington state and Oregon state, USA (Stuiver and Braziunas Reference Stuiver and Braziunas1993), Sitka spruce (Picea sitchensis) from Alaska, USA (Stuiver and Braziunas Reference Stuiver and Braziunas1998), and from oak (Quercus petraea) from the British Isles, approximately 25 km northwest of Belfast (McCormac et al. Reference McCormac, Hogg, Higham, Lynch-Stieglitz, Broecker, Baillie, Palmer, Xiong, Pilcher, Brown and Hoper1998). However, around AD 1895, there are differences in the single-year 14C content of the NW-American Douglas fir and Sitka spruce compared to decadal British oak ages. As a result, the 14C age of British oak differs in AD 1895 by 60 years from IntCal13, which is dominated by the American data, when decadal dates are smoothed according to Knox and McFadgen (Reference Knox and McFadgen2001).
Regional differences in 14C concentration have been documented between the Northern and the Southern Hemispheres due to for instance ocean upwelling (e.g. Damon et al. Reference Damon, Cheng and Linick1989; Hogg et al. Reference Hogg, McCormac, Higham, Reimer, Baillie and Palmer2002; McCormac et al. Reference McCormac, Reimer, Hogg, Higham, Baillie, Palmer and Stuiver2002; Hogg et al. Reference Hogg, Bronk Ramsey, Turney and Palmer2009), in the eastern Mediterranean related to differences in growing season (Kromer et al. Reference Kromer, Manning, Kuniholm, Newton, Spurk and Levin2001; Dee et al. Reference Dee, Brock, Harris, Bronk Ramsey, Shortland, Higham and Rowland2010; Manning et al. Reference Manning, Kromer, Bronk Ramsey, Pearson, Talamo, Trano and Watkins2010; Manning et al. Reference Manning, Griggs, Lorentzen, Bronk Ramsey, Chivall, Jull and Lange2018), and due to monsoon circulation (Hua et al. Reference Hua, Barbetti, Zoppi, Fink, Watanasak and Jacobsen2004a, Reference Hua, Barbetti and Zoppi2004b; Nakamura et al. Reference Nakamura, Masuda, Miyake, Nagaya and Yoshimitsu2013). Confirmation of such regional differences in atmospheric 14C concentration between Northern Ireland and the US Pacific coast would have major implications for the use of IntCal as a calibration tool. We propose that the cause of the dissimilarity between NW-American Douglas fir and Sitka spruce compared to British oak could be resolved by the analysis of a tree from a clean area at a different location during the same period. This might reduce the uncertainty in the calibration curve, and hence reduce uncertainty in calibrated ages.
Here, we present 14C measurements on selected tree-rings from northern Norway for the period AD 1864–1937. The tree grew in a remote location near the Norwegian Sea, with very little influence from local fossil fuel effects.
MATERIAL AND METHODS
Sample Description
One Scots pine tree (Pinus sylvestris) was felled at Vensmoen in Saltdal, northern Norway (66°59'34"N 15°19'03"E) at 52 m a.s.l. during the winter of 2005/2006. Saltdal municipality has a population of 4700 with a density of 2.1 inhabitants per square kilometer as of 2018 (Statistics Norway 2018) and the closest larger city is Bodø (51,500 inhabitants), approximately 50 km northwest of Vensmoen. Prevailing winds between Iceland and Norway are westerly or southwesterly (Førland et al. Reference Førland, Hanssen-Bauer and Nordli1997), from the Norwegian Sea. The tree therefore grew in a remote location with regard to possible sources of pollution and is presumably not influenced by local fossil fuel effects. A wood section containing 135 rings was sawn from the log at approximately knee height, with the innermost ring, which is close to the pith, dated to AD 1803. Mean ring width in the sample is 1.27 mm. The surrounding Scots pine forest in the area is relatively dense, with tall, fast-growing trees and has been standing without major logging activity since around AD 1900. The vegetation below the canopy mainly consists of heather, e.g. Vaccinium myrtillus and V. vitis-idaea and the area is characterized as slightly oceanic by Moen (Reference Moen1999), with a growing season, defined as the period of the year when the temperature does not go below 5°C, lasting from 160 to 170 days in the boreal warm season.
Dendrochronology
Due to missing outer rings, the wood sample was dated by dendrochronology. Ring widths were measured to a precision of 0.01 mm using a LINTAB-TSAP system (Rinn Reference Rinn2005) and compared to Scots pine reference chronologies from southern Norway (Thun Reference Thun2002), central Norway (Eidem Reference Eidem1953), Steigen in northern Norway (Aandstad Reference Aandstad1939), and Dividalen and Forfjorddalen in northern Norway (Kirchhefer Reference Kirchhefer1999). The dendrochronological match was determined by visual linkage with an overlap of 135 years, producing t-values (Baillie and Pilcher Reference Baillie and Pilcher1973) between 4.4 and 6.2, and Gleichläufigkeit values (Eckstein and Bauch Reference Eckstein and Bauch1969) between 60 and 64 with significance levels between 99.0% and 99.9% in the dated position.
Sample Preparation and AMS 14C Analysis
Annual rings, which are clearly distinguishable in Scots pine due to the dense and dark latewood, were cut from 66 of the 1864–1937 bands using a hand-held scalpel. Cellulose was extracted separately from each annual ring to retain the original isotopic composition of the plant material. Three methods for cellulose extraction were used. Cellulose was extracted according to the procedure of Stuiver et al. (Reference Stuiver, Burk and Quay1984) for 11 of the samples. This involves Soxhlet extraction with petroleum ether and ethanol to remove resins and other easily extractible compounds, and treatment with acid hypochlorite, sodium hypochlorite, sodium sulfite, and 17.5% sodium hydroxide to extract alpha-cellulose. Sixteen of the samples were cellulose extracted by using a base-acid-base-acid-bleaching method (BABAB; Seiler et al. Reference Seiler, Grootes, Haarsaker, Lélu, Rzadeczka-Juga, Stene, Svarva, Thun, Værnes and Nadeau2019; Němec et al. Reference Němec, Wacker, Hajdas and Gäggeler2010), which involves treatment with 4% sodium hydroxide, followed by short steps of 4% hydrogen chloride, 4% sodium hydroxide, and then 4% hydrogen chloride again at 75°C. A bleaching step with a mixture of 5% sodium chlorite and 4% hydrogen chloride at 75°C (pH ≤ 4), with an ultrasonic bath at room temperature, follows at the end. Thirty-six samples were Soxhlet extracted for oils, resin, and waxes using petroleum ether for four hours, then using ethanol for another four hours. Cellulose was subsequently extracted using the BABAB procedure. The remaining three samples were split and pretreated both with the Stuiver et al. (Reference Stuiver, Burk and Quay1984) method and with the Soxhlet-and-BABAB method.
After pretreatment, the cellulose was combusted in an elemental analyser (Elementar Microcube), and the CO2 was reduced to graphite by H2 gas over a Fe catalyst in an automated reduction system described by Ohneiser (Reference Ohneiser2006). Seiler et al. (Reference Seiler, Grootes, Haarsaker, Lélu, Rzadeczka-Juga, Stene, Svarva, Thun, Værnes and Nadeau2019) detail the procedures for sample treatment and graphitization. The 14C/12C ratio in the graphite was measured in the 1MV AMS system at the National Laboratory for Age Determination in Trondheim (Nadeau et al. Reference Nadeau, Værnes, Svarva, Larsen, Gulliksen, Klein and Mous2015). The 13C/12C ratio of each sample was measured on the AMS at the time of 14C/12C measurement and used to correct for isotopic fractionation to a δ13C value of −25‰ with respect to VPDB (Stuiver and Polach Reference Stuiver and Polach1977). Results are also corrected for process blank and are reported as conventional radiocarbon ages before present (BP). The measurement uncertainties were calculated according to Nadeau and Grootes (Reference Nadeau and Grootes2013) although the contributions from the fractionation correction and the normalization to the standards were omitted as they are very small compared to the other uncertainties. The measurements were normalized to the Oxalic Acid II primary standards (NIST SRM-4990C; Mann Reference Mann1983). The samples were measured in 10 different wheels together with other unknown samples as space permitted. Each wheel usually contains 10 (minimum eight) primary standards, five secondary standards, five process and machine blanks and 30 unknown samples. The blank correction was made assuming a modern contamination scaling inversely with the mass of the sample combusted (Seiler et al. Reference Seiler, Grootes, Haarsaker, Lélu, Rzadeczka-Juga, Stene, Svarva, Thun, Værnes and Nadeau2019). The process blank curve was derived from measurements of coal samples of different weights and measured over a few years as described by Seiler et al. (Reference Seiler, Grootes, Haarsaker, Lélu, Rzadeczka-Juga, Stene, Svarva, Thun, Værnes and Nadeau2019).
Fifty targets (50) made from five different secondary standard materials were measured together with the samples: FIRI samples D, E, H, and J (Scott Reference Scott2003), Oxalic Acid I (NIST SRM 4990B), and IAEA-C5, C7, and C8 (Rozanski Reference Rozanski1991; Rozanski et al. Reference Rozanski, Stichler, Gonfiantini, Scott, Beukens, Kromer and van der Plicht1992; Le Clercq et al. Reference Le Clercq, van der Plicht and Gröning1997). These have a 14C concentration ranging from 15 to 110 pMC. To compensate for the different radiocarbon concentrations and measurement uncertainties, the difference between measured and canonical values was normalized to the compounded uncertainty of the measurement and the canonical values (normalized deviation). The average of these should be centred around zero and the width of the distribution should be about 1 as it is in unit of σ. The average of the normalized deviations (n = 50) is 0.04 ± 0.14 σ indicating that there is no systematic offset. The standard deviation of the distribution is 0.87 σ indicating that the quoted uncertainties are representative of the true uncertainties of the measurements.
Duplicate graphitization and AMS measurements on the extracted cellulose were made on 30 samples, 10 of which were repeated a third time in view of inconsistent results. Duplicate measurements are presented as weighted averages, where the weights are the inverse square of the measurement uncertainty, and the errors are represented as whichever is largest of the combined error and the error of the mean. In addition, the 13C/12C ratio of the cellulose samples was measured in a Thermo Flash 2000 elemental analyser connected to a Thermo Delta V Advantage isotope-ratio mass spectrometer (IRMS). The results are reported relative to the VPDB standard.
RESULTS AND DISCUSSION
The cellulose extraction yields differ between the three pretreatment methods. For the Soxhlet-and-BABAB and BABAB methods, average yields were 62% and 75%, respectively. The more rigorous alpha-cellulose extraction of Stuiver et al. (Reference Stuiver, Burk and Quay1984) gave an average yield of 19%. Despite these differences, the final carbon content did not differ between cellulose extraction methods, and was on average 43%, with a range from 36 to 48%. Two of the three samples that were pretreated both with the Stuiver et al. (Reference Stuiver, Burk and Quay1984) method and the Soxhlet-and-BABAB method, gave results that were within the 1-sigma measurement error, while the third (AD 1914) gave radiocarbon ages that are outside the 2-sigma error range, with the youngest radiocarbon age obtained from the Stuiver et al. (Reference Stuiver, Burk and Quay1984) cellulose extraction method. Although we do not observe systematic differences between the results of the different pretreatment methods, an exhaustive analysis would require additional samples and is beyond the scope of this paper. For practical reasons, we prefer the Soxhlet-and-BABAB procedure.
From the 30 samples with replicate measurements (n = 32), we excluded five measurements, resulting in 27 samples with replicates, eight of which having three measurements per sample. Four of the excluded measurements had too low current during measurement compared to the standards, and one was likely influenced by sparks in the ion source. The difference between duplicate measurements (n = 19) is within 1-sigma uncertainty for 10 samples, between 1 and 2 sigma for six samples, and outside 2 sigma in one case. For the eight samples where a third measurement was made to clear up inconsistent results, six gave results where two of the repeats were within 2 sigma and the third was outside the 2-sigma error range of the others. For these samples, an explanation for the inconsistent results could not be found and all three measurements were averaged. For the AD 1935 sample, which also has three measurements, the spread in AMS δ13C measurements was large. The inconsistency between the 14C measurements was reduced to within the 1 sigma when using the IRMS δ13C values for isotopic fractionation correction. This leaves nine unexplained results outside normal statistical scatter in this series (Supplementary Table S1).
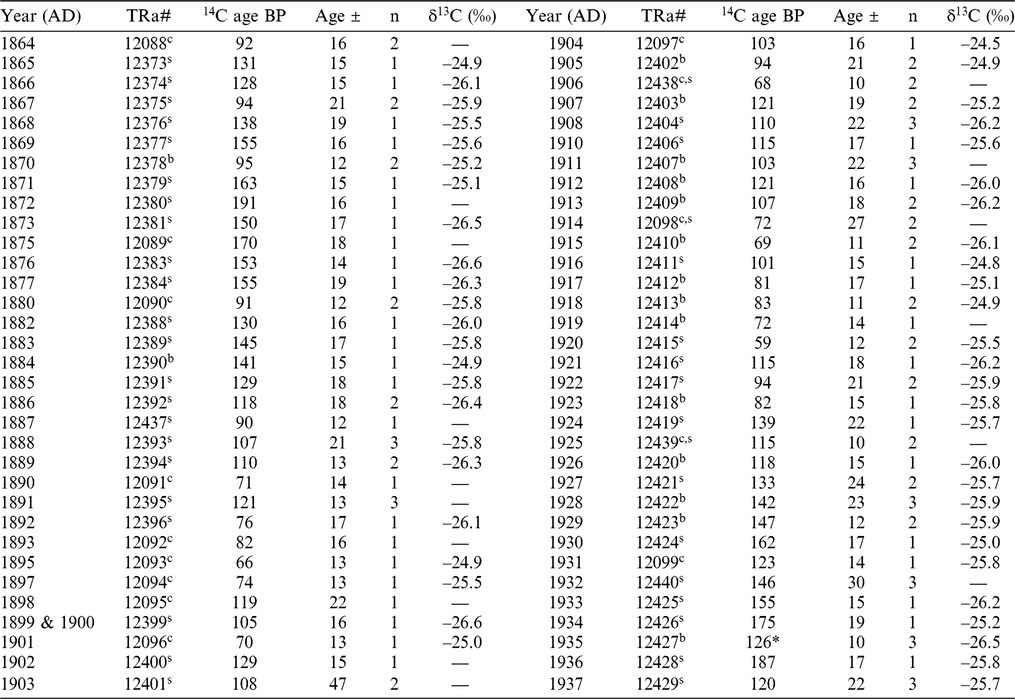
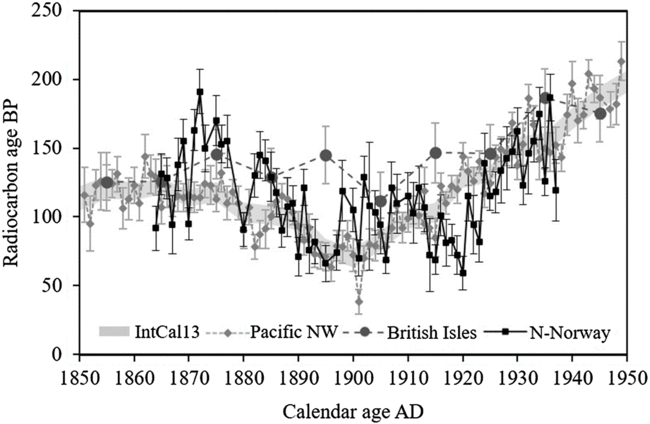
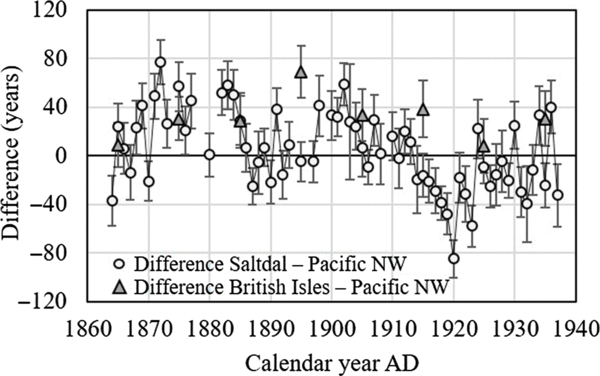
The radiocarbon ages obtained from the Saltdalen tree are presented in Table 1 and plotted along with measurements from the British Isles and the Pacific Northwest, USA (Figure 1; Supplementary Figure S1). The average difference between the British oak data and the decadal (Stuiver et al. Reference Stuiver, Reimer and Brazuinas1998) Pacific NW data is + 24 ± 8 years for the period 1855–1945 (Figure 2). In 1895, however, British oak is 88 years older than results from the Pacific NW when measured in Belfast and 50 years older when measured in Waikato. Around 1895, our Saltdalen results are in agreement with measurements from the Pacific NW, USA. The Saltdalen results are on average 5 ± 4 years older than the single-year Pacific NW dataset of Stuiver et al. (Reference Stuiver, Reimer and Brazuinas1998) for the whole period studied, the largest differences being 77 years older (AD 1872) and 85 years younger (AD 1920). On average, they are 18 ± 4 years older for the period before 1913, and 19 ± 6 years younger after 1913. Fifteen of the 66 differences are outside the 2-sigma uncertainty. We cannot explain the mechanisms behind these larger differences although cellulose inhomogeneity and growing-and regional weather-conditions could play a role.
Results of measurements on Scots pine tree-ring cellulose from northern Norway. Radiocarbon age BP, 1-sigma error (age ±), number of repeat measurements (n), lab ID (TRa#), and IRMS δ13C values (δ13C ‰). * indicates that the sample measurements were normalized using the δ13C value from IRMS. Pretreatment method is indicated next to the lab ID: c = Stuiver et al. (Reference Stuiver, Burk and Quay1984) alpha cellulose, s = Soxhlet and BABAB, b = BABAB.

Radiocarbon measurements on single-year tree rings from Saltdal, northern Norway (N-Norway; this study) compared to single-year measurements of Sitka spruce from Kodiak Island, Alaska and Olympic Peninsula, Washington State, USA (Pacific NW, USA; Stuiver et al. Reference Stuiver, Reimer and Brazuinas1998), and decadal measurements of British oak (British Isles; McCormac et al. Reference McCormac, Hogg, Higham, Lynch-Stieglitz, Broecker, Baillie, Palmer, Xiong, Pilcher, Brown and Hoper1998). The Alaska dates are normalized to the Washington dates by subtracting 14 ± 3 years (Stuiver and Braziunas Reference Stuiver and Braziunas1998), and the British Isles dates are the average of measurements obtained in Belfast and Waikato. The figure with all data points is available in color in the supplementary material.

Differences in radiocarbon ages of single-year tree rings from Saltdal, N-Norway and Pacific NW, USA and decadal tree rings from the British Isles and Pacific NW, USA for AD 1864–1937. Pacific NW datasets are from Stuiver et al. (Reference Stuiver, Reimer and Brazuinas1998); the British Isles data is the average of measurements from Waikato and Belfast. Error bars represent the combined 1-sigma uncertainties.

It has been suggested that temporal variation in upwelling along the NW coast of America could lead to regional differences in 14C levels (e.g. Knox and McFadgen Reference Knox and McFadgen2004), but this cannot explain the 1895 discrepancy between British oak and NW Pacific Douglas fir and Sitka spruce as it would generally lead to older ages along the Pacific Northwest. McCormac et al. (Reference McCormac, Hogg, Higham, Lynch-Stieglitz, Broecker, Baillie, Palmer, Xiong, Pilcher, Brown and Hoper1998) note a disappearance of hemispheric offset around 1895 when the British Isles (54°N) data are compared to cedar data (Libocedrus bidwillii) from New Zealand (39°S). British oak is 5.3 ± 8.5 years older than New Zealand cedar in the period from 1885 to 1945 compared to 27.2 ± 4.7 years younger between 1725 and 1885. McCormac et al. (Reference McCormac, Hogg, Higham, Lynch-Stieglitz, Broecker, Baillie, Palmer, Xiong, Pilcher, Brown and Hoper1998) attribute this change to anthropogenic input of fossil fuel CO2 in the Northern Hemisphere since the industrial revolution. A local fossil fuel effect in the British oak would explain the differences we observe with Saltdalen and Pacific NW results being younger than those of the oak from the British Isles around 1895. This fits an upsurge of the Belfast industry from the mid-19th century (O’Malley Reference O’Malley1981), which peaked in the early 1900s and lasted until the worldwide economic recession of the 1930s (Plöger Reference Plöger2007). The British oak sample was collected near Shane’s Castle, Co. Antrim, which is ~25 km northwest of Belfast. Prevailing winds in this area are south-westerly, however, with a high frequency of north, northeast, and easterly winds in spring (Met Office station Aldergrove; 54.65°N, 6.24°W; 68 m a.s.l.).
CONCLUSIONS
14C concentrations of cellulose from single tree rings of a Scots pine from northern Norway agree with single-year results from Douglas fir and Sitka spruce from the Pacific coast of the USA. This indicates that the AD 1895 discrepancy between the datasets from the NW Pacific coast and oak from the British Isles used in the IntCal radiocarbon calibration curve is most likely the result of a local fossil fuel influence in the oak in this period and therefore should not be incorporated in the IntCal calibration curve.
ACKNOWLEDGMENTS
The authors would like to thank Roald Renmælmo and Andreas Joachim Kirchhefer for providing the tree sample and the Norwegian University of Science and Technology and its University Museum for their support. Thank you also to two reviewers and to Paula Reimer for comments that helped improve the manuscript.
Supplementary material
To view supplementary material for this article, please visit https://doi.org/10.1017/RDC.2019.99