Implications
Goal of animal evaluation is to maximize accuracy of breeding value predictions for traits of interest. For milk production, random regression models of test-day records generally are used, which suitably models the dynamics of trait expression while controlling variation from environmental effects. Input information sources, the nation-wide domestic production records, results of Interbull international evaluation and a large number of single nucleotide polymorphism genetic markers were used for the predictions. Combining information from all of these sources improves prediction. For prediction of genomic enhanced breeding values, the single-step procedure ssGBLUP can be used, which effectively combines all available information.
Introduction
Genomic enhanced breeding values (GEBV) are frequently predicted by a multi-step procedure utilizing a regression-based methodology (Meuwissen et al., Reference Meuwissen, Hayes and Goddard2001; Colombani et al., Reference Colombani, Legarra, Fritz, Guillaume, Croiseau, Ducrocq and Robert-Granie2013) such as ridge regression RRBLUP, Bayesian procedures or the GBLUP method using a genomic relationship matrix (VanRaden, Reference VanRaden2008). Input pseudo-phenotypic data for the calculations are daughter yield deviations (DYD; Szyda et al., Reference Szyda, Żarnecki, Suchocki and Kaminski2011) or their approximations, deregressed proofs (DRP; Schaeffer, Reference Schaeffer1994) of genotyped bulls with high accuracy traditional proofs. Steps of multi-step procedure are dependent on many parameters and assumptions (Aguilar et al., Reference Aguilar, Misztal, Johnson, Legarra, Tsuruta and Lawlor2010). To obtain high reliability, these input parameters should be known without errors, which is difficult to achieve. Genetic markers also do not explain all genetic variability of an analysed trait (Liu et al., Reference Liu, Seefried, Reinhardt, Rensing, Thaller and Reents2011). Therefore, a residual polygenic effect is added to the direct genetic values (DGV) that are calculated from regression coefficients or from genomic relationship to produce GEBV. Genotyped animals are usually strongly preselected. Genetically inferior animals are not retained to have their own performance records and produce progenies, the remaining animals represent a biased sample of their parents’ progeny (Patry et al., Reference Patry, Hossein and Ducrocq2013). Higher accuracy of GEBV of genotyped animals also retroactively influences differences in prediction of estimated breeding value (EBV) from un-genotyped contemporary individuals and EBV of related animals in an evaluated population (Christensen and Lund, Reference Christensen and Lund2010; Patry and Ducrocq, Reference Patry and Ducrocq2011; Christensen et al., Reference Christensen, Madsen, Nielsen, Ostersen and Su2012).
Genomic evaluation usually uses as an input data DYD/DRP, a measure of the trait for the animal of interest, which has been adjusted for known fixed effects and other random effects apart from animal effect. It is easily computed from a single or repeated lactations. Test-day (TD) model or a multi-trait model may be a way to obtain a more accurate measure of the trait (Schaeffer et al., Reference Schaeffer, Jamrozik, Kistemaker and Van Doormaal2000; Lourenco et al., Reference Lourenco, Misztal, Tsuruta, Aguilar, Ezra, Ron, Shirak and Weller2014).
Misztal et al. (Reference Misztal, Legarra and Aguilar2009), Christensen and Lund (Reference Christensen and Lund2010) and Legarra and Ducrocq (Reference Legarra and Ducrocq2012) developed the single-step procedure ssGBLUP, which overcomes the problem that multi-step procedures do not consider all the information upon which selection was based and allows common ranking of all genotyped and un-genotyped animals in a population. This method effectively combines nation-wide production records and pedigree databases with genomic information to directly predict GEBV. Přibyl et al. (Reference Přibyl, Haman, Kott, Přibylová, Šimečková, Vostrý, Zavadilová, Čermák, Růžička, Šplíchal, Verner, Motyčka and Vondrášek2012) used this methodology for the genetic evaluation of the relatively small Czech Holstein population. Gao et al. (Reference Gao, Christensen, Madsen, Nielsen, Zhang, Lund and Su2012) and Su et al. (Reference Su, Madsen, Nielsen, Mäntysaari, Aamand, Christensen and Lund2012) used DRP of sires instead of phenotypic production records as input data in ssGBLUP, naming the procedure the one-step blending approach. Its goal was to maximize prediction accuracy by optimally utilizing all possible information sources. Přibyl et al. (Reference Přibyl, Madsen, Bauer, Přibylová, Šimečková, Vostrý and Zavadilová2013a, Reference Přibyl, Bauer, Přibylová, Vostrý, Zavadilová, Čermák, Růžička, Šplíchal, Verner, Motyčka and Vondrášek2013b and 2014) combined nation-wide databases of production with all available Interbull DRPs in ssGBLUP analyses. In those calculations for young animals, the single-step procedure achieved higher accuracy than BLUP or multi-stage procedures. In comparison with using domestic records only, combining domestic and Interbull files with proofs converted by multiple-trait across country evaluation (MACE) into a scale reflecting domestic production conditions improved accuracy of prediction of both EBV and GEBV.
New breeding value prediction procedures are often validated by comparing GEBV of young genotyped bulls with their subsequent progeny test results, with EBV or DYD calculated from daughter yield used as the response variable (Aguilar et al., Reference Aguilar, Misztal, Johnson, Legarra, Tsuruta and Lawlor2010). Validated reliability is calculated (Su et al., Reference Su, Madsen, Nielsen, Mäntysaari, Aamand, Christensen and Lund2012), which reflects the correlation of prediction to DYD under domestic conditions, an essential element for animal selection. Expected advantages from genotyping generally are lower in smaller than in larger populations, so modified strategies for small populations may be necessary (Jiménes-Montero et al., Reference Jiménes-Montero, Gonzáles-Recio and Alenda2012; Thomasen et al., Reference Thomasen, Guldbrandsen, Su, Brøndum and Lund2012; Lourenco et al., Reference Lourenco, Misztal, Tsuruta, Aguilar, Ezra, Ron, Shirak and Weller2014).
Dairy cattle breeding is an international enterprise, and there is considerable migration of genotypes through live animals, semen and embryos. Many bulls have progeny in several countries and therefore several published EBV predictions. The MACE method was developed to convert EBV of foreign bulls into domestic conditions (Schaeffer, Reference Schaeffer1994; Sullivan and Wilton, Reference Sullivan and Wilton2001). With this method, genetic correlations between predicted genetic merits in different countries are calculated. This method was adapted by Sullivan and Jakobsen (Reference Sullivan and Jakobsen2012) specifically for converting GEBV of young genotyped bulls to its GMACE counterpart. Like MACE, GMACE combines information across countries while avoiding double counting. Frequently, foreign bulls (or semen) are imported into a country with some time-delay, by which time a bull’s foreign EBV/GEBV may already be known. Accordingly, production records of their daughters in the importing country are utilized to calculate their additional domestic EBVs. In addition, domestic GEBVs, which reflect domestic production conditions, are calculated for imported young genotyped bulls.
Přibyl et al. (Reference Přibyl, Haman, Kott, Přibylová, Šimečková, Vostrý, Zavadilová, Čermák, Růžička, Šplíchal, Verner, Motyčka and Vondrášek2012, Reference Přibyl, Madsen, Bauer, Přibylová, Šimečková, Vostrý and Zavadilová2013a and Reference Přibyl, Bauer, Pešek, Přibylová, Vostrý and Zavadilová2014) verified genomic predictions for milk production in the Czech Holstein population using a cut-off study based on comparing results of young sires from an earlier span of years to those from a later span when their progeny results are known. With the passage of time, the number of genotyped animals increases, leading to increased reliability of results. Therefore, we are now using all available genotyped bulls proven through 2013 in the reference population; and for verification, we are using bulls imported into the country after previous Interbull evaluation.
The aim of this study was to calculate GEBV of young bulls using several methodologies and two information sources (domestic production data and global Interbull data from August 2013). Resultant predictions were compared with Interbull GEBV of young bulls, calculated using only foreign information sources but transformed by GMACE (August 2013) into a scale used in the Czech Republic.
Material and methods
Data used for predictions
-
I. First lactation milk yield of 1 257 462 Czech Holstein cows, calving years 1991 to 2013, with 2 314 856 animals in the pedigree file.
-
II. Files for routine nation-wide evaluation of milk traits by multi-trait random regression test-day model (MT-RRTDM) with each of the first three lactations considered as a separate trait. This consisted of 19 435 367 TD records from 1 086 267 Czech Holstein cows, calving years 1995 to 2013, with 2 142 354 animals in the pedigree file.
-
III. Interbull EBVs of 112 880 Holstein bulls file (August 2013), average reliability 0.72 (minimum reliability 0.28), converted by MACE into a national scale, with 291 977 animals in the pedigree file. To facilitate comparability of domestic and foreign databases, values were modified by multiplicative constant in order that variability of EBVs of domestic proven bulls and EBVs of Interbull bulls with similar reliability was similar. Bulls originating from countries with very different production conditions from the Czech Republic, Israel and New Zealand, for example, were eliminated because of lower Interbull correlation with Czech Republic evaluations. From the Interbull file were also eliminated bulls with greater than four lactating daughters in domestic file, to avoid double counting. EBVs were deregressed (Rozzi et al., Reference Rozzi, Schaeffer, Burnside and Schlote1990; Schaeffer, Reference Schaeffer1994) and pseudo-phenotypic data reflecting yield deviation (DRP) and effective record contributions (ERC) were calculated, considering sire as animal with its own production:
(1)where rel=reliability of EBV. $${\rm ERC}=\left( {\left( {{\rm 1}\,{\minus}\,{\rm}h^{{\rm 2}} } \right){\rm }/{\rm }h^{{\rm 2}} } \right){\times}\left( {{\rm rel}/\left( {{\rm 1}\,{\minus}\,{\rm rel}} \right)} \right)$$
-
IV. Bulls were genotyped by Illumina BovineSNP50 BeadChip V2 (Illumina Inc., San Diego, CA, USA). To eliminate possible input errors, data were edited for: minor allele frequency<0.05, number of loci per bull <90% of all possible loci, number of bulls per locus <90% of all possible bulls and large discrepancy of pedigree relationship A 22 (see below) and genomic relationship G. If absolute difference in relationship to others for more than three animals was >0.30, then the genotyped individual was eliminated. An animal also was eliminated if the proportion of Holstein genes was <85%. Predicted genetic merit of some proportion of ‘proven’ sires disagreed with input data (Pešek et al., Reference Pešek, Přibyl and Vostrý2015) and has substantial error of prediction (outlying values). Therefore, old proven genotyped bulls in the training set with absolute difference of input DRP with predicted DGV greater than 539 kg were also eliminated. The reason of outlying values can be various, for example lower reliability of Interbull proofs, or very diverse genetic background from other population. After editing, 40 409 loci for 2627 bulls, from which 2189 were already proven in the Czech Republic in 2013 (training set), were used.
Data used for verification
-
V. GMACE GEBV of 96 foreign genotyped young bulls from preliminary Interbull run (August 2013), which do not have phenotypic records in our evaluated files I, II and III, mentioned above.

Methods of prediction
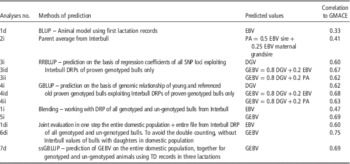
Several methods were used for prediction of EBV/GEBV of young animals using different methodology and different sources of information. Criterion for suitability of models was the correlation to international Interbull values of young bulls. Data were evaluated by weighted analysis using several statistical procedures. ERC was used as the weight for individual DRP records of sires and was set equal to 1 for all domestic phenotypic production records of cows (Přibyl et al., Reference Přibyl, Madsen, Bauer, Přibylová, Šimečková, Vostrý and Zavadilová2013a and Reference Přibyl, Bauer, Pešek, Přibylová, Vostrý and Zavadilová2014). Procedures are summarized in Table 1.
Correlations of domestic genetic prediction for 96 young genotyped bulls with foreign genomic enhanced breeding value transformed by GMACE into a domestic Czech scale

d=domestic data; i=Interbull data; EBV=estimated breeding value; DGV=direct genetic value; GEBV=genomic enhanced breeding value; TD records=test day within lactation records; DRP=deregressed proofs; SNP=single nucleotide polymorphism.
(1) BLUP=best linear unbiased prediction with pedigree relationship matrix A; (2) PA=parent average; (3) RRBLUP=ridge regression BLUP with genetic regression coefficients; (4) GBLUP=genomic BLUP with genomic relationship matrix G; (5, 6, 7) ssGBLUP=single-step genomic BLUP with combined relationship matrix H.
Approaches
-
1. BLUP – Animal Model – prediction of EBV of young animals according to conventional pedigree value. Domestic first lactation records were used in analysis 1d (BLUP with domestic data), Interbull DRP data were used in analysis 1i (BLUP with Interbull data) and both sources were used in analysis 1di. Evaluation was according to the model:
(2)where Y is the vector of first lactation milk yield of cow, or DRP of milk production of bull; X, Z the design matrices for fixed and random effects, respectively (Přibyl et al., Reference Přibyl, Haman, Kott, Přibylová, Šimečková, Vostrý, Zavadilová, Čermák, Růžička, Šplíchal, Verner, Motyčka and Vondrášek2012 and Reference Přibyl, Madsen, Bauer, Přibylová, Šimečková, Vostrý and Zavadilová2013a); β the vector of fixed effects covering contemporary groups within a herd in a 3-month calving period (HYS), linear and quadratic regression for calving age and linear and quadratic regression for days open; an the EBV of animal, random effect with assumption of covariance structure an~N(0, A σ 2 a ); A the pedigree additive relationship matrix, covering up to six known ancestral generations; σ 2 a the additive genetic variance of trait; e the vector of residuals with assumption of covariance structure; e~N(0, D σ 2 e ); D the diagonal matrix with reciprocal weights. Weights are 1.0 for phenotypic data and ERC for pseudo-data DRP; σ 2 e the residual variance of trait.
$${\bf Y}={\bf X}{\bbeta} {\plus}{\bf Zan}{\plus}{\bf e}$$
DRPs processed from MACE values are free from the influence of systematic environmental effects and are all on the same scale. For inclusion into domestic BLUP calculations, DRPs are therefore included in an additional class of HYS, while average values from the domestic population are used for the independent variables, calving age and days open.
-
2. PA – parent average from Interbull file calculated according to
(3)
$${\rm PA}=0.{\rm 5}{\times}{\rm EBV \, sire}{\plus}0.{\rm 25}{\times}{\rm EBV \, maternal \, grandsire}$$
-
3. RRBLUP – prediction on the basis of regression coefficients of all single nucleotide polymorphism (SNP) loci exploiting of pseudo-phenotype data DRPs of proven genotyped bulls only. In the reference population of 2189 proven genotyped bulls, regression coefficients were estimated according to
(4)where Y is the vector of DRP of milk production from Interbull file; X 1 the design matrix of fixed effects with one column of unity and n1 rows; n1 the number of genotyped proven bulls with DRP; μ the common constant as a fixed effect; T 1 the design (n1×m) matrix for SNP genotypes with values <0, 1, 2> part of matrix T of all genotyped animals; m the number of loci; g the vector of random regression coefficients for SNP additive effects; with covariance structure g~N(0, I σ 2 a /m); I is an identity matrix of size n1; e the vector of residuals with covariance structure e~N(0, D σ 2 e); D the diagonal matrix containing reciprocals of ERC.
$${\bf Y}={\bf X}_{{\bf 1}} \bf \bmu {\plus}{\bf T}_{{\bf 1}} {\bf g}{\plus}{\bf e}$$
Estimated and predicted right-hand side terms from equation (4) are used to predict DGV of n2 young genotyped animals (matrices X and T connected with proven reference animals have index 1, matrices connected with young animals have index 2):
(5)Calculation of DGV itself is analysis 3i. The pedigree based EBV of young bulls from analysis 1d are added to this DGV, and GEBV is calculated (analysis 3id). Weights of 80% and 20% are assigned to DGV and EBV, respectively, to achieve similar weighting of the two sources like in the following ssGBLUP method. Alternatively, DGV can be added to parent average (PA) from the Interbull file (analysis 3ii). These weights are in agreement with previously reported values of Szyda et al. (Reference Szyda, Żarnecki, Suchocki and Kaminski2011).
$${\bf DGV}={\bf X}_{2} \bmu {\plus}{\bf T}_{2} {\bf g}$$
-
4. GBLUP – prediction on the basis of genomic relationship of young bulls to bulls that are referenced, proven and genotyped, exploiting only DRPs of proven genotyped bulls.
Model equation is
(6)Z the design matrix (n1×(n1+n2)), for random effect of animals; an the vector of DGV of (n1+n2) genotyped animals, random effect with covariance structure an~N(0, G σ 2 a ); G the realized genomic relationship matrix ((n1+n2)×(n1+n2)). Matrix G was constructed from matrix T according to deviations from the averages of observed allele frequencies for given loci in the analysed population and was standardized by division by the average value of the diagonal of G (Forni et al., Reference Forni, Aguilar and Misztal2011), then shifted, so that the elements of the pedigree relationship matrix for only the genotyped animals A 22 and elements of G would have the same average (Vitezica et al., Reference Vitezica, Aguilar, Misztal and Legarra2011).
$${\bf Y}={\bf X}_{{\bf 1}} \bmu {\plus}{\bf Zan}{\plus}{\bf e}$$
Calculation of DGV itself is analysis 4i and calculations of GEBVs are analyses 4id and 4ii, conducted similarly as in the previous method.
-
5. Blending ssGBLUP – calculation of GEBV, utilizing DRP of all 112 880 genotyped and un-genotyped bulls from Interbull (analysis 5i). Evaluation is according to analysis 1i (approach 1), but with relationship matrix H substituted for matrix A, where H is the pedigree additive relationship matrix A augmented by genomic relationship matrix G. Weights of 80% G and 20% additive pedigree relationship matrix, only for genotyped animals A 22 was used for incorporation into H (Misztal et al, Reference Misztal, Legarra and Aguilar2009; Christensen and Lund, Reference Christensen and Lund2010; Přibyl et al., Reference Přibyl, Haman, Kott, Přibylová, Šimečková, Vostrý, Zavadilová, Čermák, Růžička, Šplíchal, Verner, Motyčka and Vondrášek2012);
-
6. ssGBLUP with combined data – calculation of GEBV, joint evaluation in one step of the entire domestic population and entire Interbull file (analysis 6di). To avoid double counting in these combined analyses, Interbull DRPs were used only when sires did not have daughters in the domestic population.
-
7. ssGBLUP with entire domestic TD record from first three lactations (analysis 7d). Legendre polynomials (LP) with four parameters were used for modelling the lactation curve for TD model data:
(7)
$$f={\bf p}\prime{\bf b}$$
where b is the vector of regression coefficients (b fg for fixed group according to management classes; b pe for random permanent environmental effect of cow within lactation; b an for random genetic effect of animal within lactation); p the vectors of parameters of the function according to stage of lactation.
P terms in LP were calculated according to standardized days in lactation from the formula of Rodriguez (Rektorys, Reference Rektorys1963) and were standardized for the variability of each parameter close to 1 (Kirkpatrick et al., Reference Kirkpatrick, Lofsvold and Bulmer1990; Schaeffer et al., Reference Schaeffer, Jamrozik, Kistemaker and Van Doormaal2000).
Evaluation is according to three lactations RRTD animal model (Plemdat, 2014):
(8)
$${\bf Y}={\bf X}_{{{\bf TD}}} \bbeta {\plus}{\bf X}_{{{\bf fg}}} f_{{{\bf fg},{\bf k}}} {\plus}{\bf Z}_{{{\bf pe}}} f_{{{\bf pe},{\bf k}}} {\plus}{\bf Z}_{{{\bf an}}} f_{{{\bf an},{\bf k}}} {\plus}{\bf e}$$
where Y is the TD record of milk yield of cow in lactation k <1,2,3>; X TD the design matrix for herd-test days; β the vector of herd-test day contemporary groups within a herd in lactation k (fixed effect); X fg,k the design matrix for average LP of lactation curve according to groups of cows within management classes sharing similar environment (Zavadilová et al., Reference Zavadilová, Němcová, Přibyl and Wolf2005b; Plemdat, 2014); ƒ fg,k the fixed within lactation LP of lactation curve of cows within management classes of similar environment in lactation k; Z pe the design matrix for LP of lactation curve according to permanent environmental effect of the cow; ƒ pe,k the permanent environmental within lactation LP of lactation curve of cows in lactation k (Zavadilová et al., Reference Zavadilová, Jamrozik and Schaeffer2005a), random effect with assumption of covariance structure b pe ~N(0, I ¤ LE); ¤ the direct matrix multiplication; LE the (12×12) covariance matrix of Legendre random regression coefficients for permanent environment over all three lactations; Z an the design matrix for LP of lactation curve according to genetic effect of animal; ƒ an,k the genetic within lactation LP of lactation curve of animal in lactation k, random effect with assumption of covariance structure b an ~N(0, H ¤ LG); LG the (12×12) covariance matrix of genetic Legendre random regression coefficients over all three lactations; e the vector of random residuals of TD records within lactation k with assumption of covariance structure e~N(0, D σ 2 rk); D the diagonal matrix with reciprocal weights reflecting changes of variability throughout the course of lactation; σ 2 rk the residual variance of records within lactation k.
GEBV is determinate directly, by exploring all pedigree and genomic relationship trough matrix H. GEBV is calculated in this case by an index summing values of genetic polynomials for 305 days of lactation and three lactations, and calculating the average from these three lactations:
(9)
$${\bf GEBV}=\left( {\sum\sum{{{\bi f_{{\rm \bf an},{\bf k}}}}} } \right)/3$$


All procedures were validated by calculating correlations among predictors of genetic merit for 96 young bulls using the same criterion, which were their international Interbull values transformed by GMACE onto a domestic Czech Republic scale. Our presumption is that whichever procedure has the highest correlation has also the smallest noise.
Our own programmes for routine RRTD animal model evaluation were used. For research comparison, the programme G-matrix (Su and Madsen, Reference Su and Madsen2011) was used for construction of the G relationship matrix, and the DMU (Madsen and Jensen, Reference Madsen and Jensen2010) and BLUPF90 (Misztal et al., Reference Misztal, Tsuruta, Strabel, Auvray, Druet and Lee2002) packages were used for genetic prediction.
Results and discussion
Predictions of merit of genotyped young bulls were compared with Interbull GEBV, based upon analysis of foreign data files, and transformed by GMACE into domestic Czech conditions. Results are summarized in Table 1.
Prediction by EBV
Predictions by pedigree-based EBVs using domestic first lactation milk yield only (analysis 1d) were correlated by 0.33 with GMACE predictions based on foreign data files, suggesting that relationships between foreign bulls and the domestic population were not strong. Breeding value predictions based upon parent average from Interbull files (analysis 2i) were correlated with GMACE values by 0.41, suggesting that sires of the young bulls were generally well proven through international use. Predictions by EBVs resulting from the blending procedure (analysis 1i), which takes into account the entire Interbull file (II), were correlated with GMACE by 0.47. Predictions by EBVs combining information from domestic first lactation records with the entire Interbull file (analysis 1di) were correlated with GMACE by 0.60. For prediction, this procedure utilizes information from pedigree relationships, nation-wide domestic sources of phenotypic information and the entire Interbull file of globally proven bulls. Increasing the quantity of phenotypic information connected directly with evaluated sires (analyses 1i and 1di) improved the prediction, which is in agreement with conclusions of Přibyl et al. (Reference Přibyl, Bauer, Pešek, Přibylová, Vostrý and Zavadilová2014).
Prediction by multi-step procedures
When using genomic information, correlations among breeding value predictions with GMACE are less variable than predictions with EBV described above.
Predictions by DGVs based upon regression coefficients were correlated with GMACE by 0.60 (analysis 3i) and by 0.62 with predictions based upon GBLUP methods (analysis 4i).
These values were calculated using data from a reference population of 2189 mature bulls that were both proven and genotyped. Predictions by GEBV calculated according to selection indexes were correlated by 0.67 and 0.68, respectively, with the index combining DGV with pedigree-based EBV from domestic population records (analyses 3id and 4id) and by 0.62 and 0.63, respectively, for the index combining DGV with parent average from Interbull (analyses 3ii and 4ii). Our observation of higher correlations for predictions using more information sources is in agreement with Liu et al. (Reference Liu, Seefried, Reinhardt, Rensing, Thaller and Reents2011). In indexes used for all animals, constant overall weights were 80% for DGV and 20% for pedigree value, which corresponds to combining the pedigree and genomic relationship matrices into H in a single-step procedure. Analyses 3ii and 4ii exploit information value of the contribution of foreign bulls to the domestic population and the sample of DRPs of reference bulls from the Interbull file. Analyses 3id and 4id exploit both domestic (for pedigree based EBV) and international (for DGV) information. RRBLUP and GBLUP methods, which have the same sources of information, resulted in essentially the same correlations.
Prediction by single-step procedures
Prediction of GEBV with the ssGBLUP method from domestic TD records using RRTDM (analysis 7d) resulted in a correlation with GMACE of 0.69, which is little better than selection indexes of GEBV in multi-step procedures. Prediction by GEBV with a blending procedure using all available Interbull DRP (analysis 5i) also resulted in a correlation of 0.69. These results reflect the substantial information content of internationally proven genotyped and un-genotyped bulls. Predictions based on ssGBLUP of combined data (analysis 6di) achieved the highest correlation of 0.75. Both of the single-step analyses with Interbull data used a larger volume of input phenotypic values directly connected to sires, which for the majority of sires are at least moderately reliable. Thus, these procedures surpass multi-step procedures. The highest correlation is achieved with combined sources of information.
Prediction based only upon EBV (analysis 1di) achieved the same accuracy as prediction by DGV in analyses 3i and 4i. Correlations of predictions of EBV with GMACE differed according to sources of phenotypic information much more than correlations of predictions according to GEBV. Using genetic SNP markers in an evaluation reduced differences among analyses. All of the analytical models for breeding value prediction in our analyses included pedigree values as an information source, but they utilized them in different ways. Current results are preliminary. Manifestation of greater differences among methods would be expected as first lactation records of daughters became available. On the other hand, we are using more proven genotyped sires in reference population than in previous studies (Přibyl et al., Reference Přibyl, Haman, Kott, Přibylová, Šimečková, Vostrý, Zavadilová, Čermák, Růžička, Šplíchal, Verner, Motyčka and Vondrášek2012, Reference Přibyl, Madsen, Bauer, Přibylová, Šimečková, Vostrý and Zavadilová2013a and Reference Přibyl, Bauer, Pešek, Přibylová, Vostrý and Zavadilová2014). If the number of proven genotyped sires increased in the reference population, results improved as well.
GMACE values, used here for comparison with other predictions, are for foreign bulls not having a close connection with the domestic population. Some changes in ranking of animals are therefore expected, because genetic correlations among countries are not unity. Nevertheless, the rank of effectiveness of methods in the current experiment is the same as in previous studies (Přibyl et al., Reference Přibyl, Madsen, Bauer, Přibylová, Šimečková, Vostrý and Zavadilová2013a and Reference Přibyl, Bauer, Pešek, Přibylová, Vostrý and Zavadilová2014) in which methods were compared based upon progeny test results. The number of genotyped animals and the volume of phenotypic records are larger than in previous studies. Because the amount of such information is growing rapidly, higher accuracy of prediction is expected in the future.
Correlation between predictions
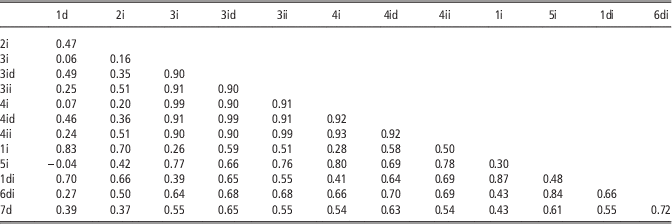
Because the various methods of predictions use similar sources of information and because methods are somewhat related, different analytic models should produce similar results. Correlations observed between genetic predictions from different analytical models are shown in Table 2.
Correlations between analyses of prediction for milk yieldFootnote 1

1 Explanation of analyses in Table 1.
The highest correlations, which were among similar methods, exceeded 0.90, and were observed only among multi-step procedures. Predictions with RRBLUP and GBLUP had correlations of 0.99 (analyses 3i v. 4i; 3id v. 4id; 3ii v. 4ii), which documented identity of results. Predictions by a single-step procedure using Interbull and combined data achieved correlations over 0.80 (e.g. analyses 5i v. 6di). Procedures calculating EBV from Interbull and combined data were correlated by 0.87 (analyses 1i v. 1di), whereas EBV calculated from domestic data v. Interbull data were correlated by 0.83 (analyses 1d v. 1i). Other correlations were lower. The correlation of EBV predicted from domestic population records and prediction of GEBV by the Blending ssGBLUP method from Interbull files was −0.04 (analyses 1d v. 5i), which reflects the distant genetic relationship of young foreign genotyped bulls to the domestic population. Correlations of domestic EBV with DGV based on Interbull data (RRBLUP and GBLUP methods) also were low (0.06 and 0.07 for analyses 1d v. 3i; 1d v. 4i, respectively).
Predicting production of milk components with RR-TDM
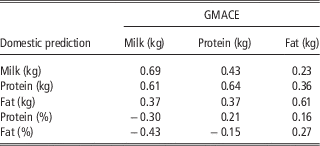
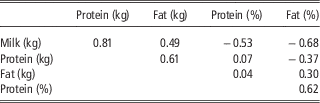
An ssGBLUP analysis of TD records (analysis 7d) provided effective characterization of domestic production conditions and had, in comparison with other methods, superior predictive ability. This model was used to predict GEBV for milk, fat and protein yields using nationwide TD data. Results of cross-wise comparisons are shown in Table 3. The correlation between GEBV prediction and GMACE value for milk yield was 0.69. Predictions for protein and fat yields had lower correlations to the GMACE predictions of 0.64 and 0.61, respectively (Table 3). From cross-wise comparison, it follows that domestic predictions of milk and protein yields reflect Interbull GMACE predictions more closely than does domestic prediction of fat yield. The largest negative correlation was between domestic prediction of Interbull GEBV for milk yield with fat % (−0.43). Table 4 presents mutual correlations of domestic predictions for milk traits. The highest correlation was between predictions of milk and protein yields (0.81), and largest negative correlation was between milk yield and fat % (−0.68). GEBVs of protein % and fat % were correlated by 0.62.
Correlations of domestic prediction of genomic enhanced breeding values by ssGBLUP procedure of random regression test-day model for milk traits with foreign genomic enhanced breeding values transformed by GMACE into domestic scale

Correlations among milk traits of domestic predictions of genomic enhanced breeding values by ssGBLUP procedure for a random regression test-day model

GEBVs in the present experiment were calculated independently for each trait. Our reported values of correlations among these GEBVs do not contradict generally accepted correlations among milk traits.
Conclusions
Current results and those from previous studies confirm findings of other authors and yield the following conclusions. All genomic predictions of merit of young bulls have higher accuracy than their pedigree-based breeding values. Single-step procedures have higher accuracy than multi-step procedures. Addition of pedigree-based EBV, based either upon domestic production records or upon Interbull files to the DGV in multi-step procedures, increases accuracy of prediction of GEBV. Combining DGV with pedigree-based EBV from the domestic population is better than combining DGV with parent average from Interbull. Combining information from Interbull data with domestic records increases accuracy of prediction of both EBV and GEBV.
The Interbull genetic correlation between foreign countries and Czech Republic is about 0.85, meaning that reliability of predicted merit of foreign bulls decreases after import to ∼72% of the reliability in their country of origin. Because breeding values are regressed values, the genetic impact of foreign bulls in the importing country is reduced. It is therefore important that genetic evaluation be based upon domestic production files. Our recommendation is the ssGBLUP method for TD model, which optimally reflects domestic production conditions. With this procedure, it is also possible to directly calculate GEBV of females within the same joint analysis.
For genotyped animals that do not have sufficient connection to the domestic population and therefore insufficient connection to the file of phenotypic domestic records, the combination of domestic production records with the Interbull file of DRPs is optimal.
Acknowledgements
The authors thank the Czech Moravian Breeding Corporation (Hradištko, Czech Republic) and the Holstein Cattle Breeders Association of the Czech Republic (Prague, Czech Republic) for supply of data files. The authors are grateful to Dr Per Madsen, University of Aarhus, Denmark, and to Prof. Ignacy Misztal, University of Georgia, USA, for methodological support and for provision of computer programs. The authors thank W. D. Hohenboken (Philomath, OR) for language and editing the paper and for valuable comments. They gratefully acknowledge the helpful comments of anonymous reviewers. Supported by the Ministry of Agriculture of the Czech Republic, Prague (Projects no. QJ1510139 and MZE RO0714).