


On March 9, 2001, less than three months after taking office following one of the most bruising presidential campaigns in American history, President George W. Bush already sounded like a man very much on the reelection trail. After touring a community health center in Sioux Falls, South Dakota, President Bush addressed the crowd and discussed the federal budget. Consistent with a main theme from the 2000 campaign, the president emphasized the need for tax relief, yet he also stressed the importance of wisely targeted spending. “If you listen to the voices of those who would rather keep your money in Washington, DC,” the president warned, “they say we can't meet the needs (of the nation). I'm telling you, we can meet the needs with the right kind of priorities.”
Many of the priorities that the president highlighted would benefit South Dakota. President Bush proposed additional funding for community health centers like the one in Sioux Falls to allow them to double the number of patients they see. He also stressed the importance of working with states on the “right kind” of development projects, “and the Lewis and Clark Rural Water Project (which would deliver water to more than 300,000 people in Minnesota, Iowa and South Dakota) is a project that will be in my budget and something that we can work together on.”Footnote 1 Bush's rhetoric is far from unique;Footnote 2 presidents frequently emphasize to voters how their budget priorities fit the needs of local constituencies. But do voters reward presidents for the share of federal spending that they receive?
Virtually every academic inquiry into the electoral consequences of federal spending has focused on Congress. The image of pork-barreling legislators jockeying to channel federal dollars to their districts to secure reelection is firmly entrenched in both the popular and the academic consciousness (e.g., Mayhew Reference Mayhew1974a, and the importance of securing “particularized benefits”. Yet, in stark contrast to this conventional wisdom, most studies have found scant evidence that increased federal spending translates into extra votes for congressional incumbents. Summarizing the literature, Lazarus and Reilly (Reference Lazarus and Reilly2010, 344) describe the results of these primarily House-centered studies as exhibiting a general “pattern of non-findings.”Footnote 3 We argue that one of the most important reasons for the relative dearth of evidence for federal spending's electoral consequence is that past scholarship has looked for it in the wrong place.
In a county-level analysis of the last six presidential elections, we show that incumbent presidents or their party's nominee received increased electoral support in counties that enjoyed rising levels of federal spending. We also replicate this finding using individual-level survey data from the 2008 election. Our results complement recent studies of the federal budget that have highlighted the influence of the president in the geographic distribution of federal spending (Berry, Burden, and Howell Reference Berry, Burden and Howell2010; Larcinese, Rizzo, and Testa Reference Larcinese, Rizzo and Testa2006). However, we ask a related though separate question: Do voters reward the commander-in-chief for the share of federal outlays they receive?
In addition to measuring the influence of federal spending on presidential elections, we investigate the mechanisms through which voters reward presidents for spending. Federal dollars are an electoral currency whose worth depends on both the clarity of partisan responsibility for its provision and the characteristics of those voters receiving it. We hypothesize and present evidence that presidents enjoy a greater boost from spending in counties represented by members of Congress from their party—that is where partisan accountability for federal performance is most clear. We also posit that the effect of spending is conditional on ideology. First, we show that this is true on a contextual level. Conservative counties reward presidents at substantially lower levels than moderate or liberal counties. We also show that this hypothesis holds at the individual level. The more conservative a voter, the less likely he or she is to reward a president for federal spending.
PRESIDENTS AND FEDERAL SPENDING
We exist in an increasingly president-focused political environment. For decades, scholars have examined the central role of presidents in American politics (e.g., Rossiter Reference Rossiter1960) and noted the increasingly heavy weight of expectations heaped on them by an anxious public. In Neustadt's memorable phrase, “everybody now expects the man inside the White House to do something about everything” (Neustadt Reference Neustadt1990, 7). Against the backdrop of these lofty expectations, presidential power has grown dramatically in the modern era (inter alia, Dickinson Reference Dickinson1999; Howell Reference Howell2003; Rudalevige Reference Rudalevige2002). Nevertheless, until recently the study of budgetary politics and their electoral consequences has focused almost exclusively on the opposite end of Pennsylvania Avenue.
A lengthy literature has examined the variable capacity of members of Congress to channel distributive benefits to their districts (Anzia and Berry Reference Anzia and Berry2011; Atlas et al. Reference Atlas, Gilligan, Hendershott and Zupan1995; Balla et al. Reference Balla, Lawrence, Maltzman and Sigelman2002; Bickers and Stein Reference Bickers and Stein2000; Ferejohn Reference Ferejohn1974; Lee Reference Lee2000, Reference Lee2004; Lee and Oppenheimer Reference Lee and Oppenheimer1999; Levitt and Poterba Reference Levitt and Poterba1999; Stein and Bickers Reference Stein and Bickers1994). Much scholarship has also focused on whether House members who bring home larger shares of federal spending to their districts enjoy an electoral edge, but with decidedly mixed results (Alvarez and Saving Reference Alvarez and Saving1997; Alvarez and Schousen Reference Alvarez and Schousen1993; Bickers and Stein Reference Bickers and Stein1996; Lazarus and Reilly Reference Lazarus and Reilly2010; Levitt and Snyder Reference Levitt and Snyder1997; Sellers Reference Sellers1997). According to Sellers (Reference Sellers1997, 1026), “most studies” that examine the potential linkage between federal spending and electoral payoff “have failed to find a significant relationship between electoral vulnerability and pork.”Footnote 4
Despite the emphasis on Congress, studies have occasionally acknowledged the significance of the president in the distribution of federal resources. For example, Levitt and Snyder (Reference Levitt and Snyder1997) note, “The inflow of federal funds to a district is affected by the decisions of a large number of actors. . . . The president plays a major role, both in the budget process and as chief executive” (32). Moreover, recent studies provide a corrective to the Congress-centric view of the distribution of federal spending (Berry, Burden, and Howell Reference Berry, Burden and Howell2010; Hudak Reference Hudak2010; Larcinese, Rizzo, and Testa Reference Larcinese, Rizzo and Testa2006; Taylor Reference Taylor2008; Reference Taylor2010). For example, in a state-level analysis from 1982 to 2000, Larcinese, Rizzo, and Testa (Reference Larcinese, Rizzo and Testa2006, 447) find evidence that presidents engage in the “tactical distribution of federal funds” and target states that were supportive of them in the previous election or that have a co-partisan governor. In a similar vein, Berry, Burden, and Howell (Reference Berry, Burden and Howell2010) analyze federal spending from 1984 to 2007 at the county and congressional district level and find that presidents exert substantial control of the distribution of funds. Most notably, constituencies represented by legislators of the president's party receive more federal resources.Footnote 5
Although this literature highlights the influence that presidents hold over the distribution of federal resources, no study has yet investigated in detail the extent to which the electorate holds the president accountable for federal spending. There are several reasons to expect spending to influence presidential election outcomes.
First, given the demonstrated importance of the president's role in determining the distribution of federal spending, voters are likely to hold presidents functionally responsible for federal spending and therefore to reward them for increased spending in their home counties (Arceneaux Reference Arceneaux2006; Stein Reference Stein1990). Studies of presidential voting have long emphasized that the public holds the president responsible for the state of the economy, both for individual economic fortunes (Fiorina Reference Fiorina1981; Key Reference Key1966) and for the overall health of the macro-economy (Erikson Reference Erikson1989; Hibbs Reference Hibbs2000). Although the debate continues over the degree of influence that presidents actually wield over economic outcomes, they do significantly influence the distribution of federal largesse across the country. Accordingly, there are strong reasons to expect voters to hold presidents accountable for the share of federal grants that their communities receive.
Second, even setting functional responsibility aside, federal spending may ameliorate local economies by providing additional projects ranging from programs pursuant to the Job Training Partnership Act to microenterprise development grants. To the extent that voters are purely retrospective and cast a “finger to the wind” to make a decision, they may reward incumbents instinctively for increased local benefits.
Finally, recent scholarship argues that presidents are held accountable for politically irrelevant factors like severe weather (Achen and Bartels Reference Achen and Bartels2004; Gasper and Reeves Reference Gasper and Reeves2011), sporting events (Healy, Malhotra, and Mo Reference Healy, Malhotra and Mo2010), and even shark attacks (Achen and Bartels Reference Achen and Bartels2004). Across the gamut of issues, citizens expect presidential action. As an article in The Economist noted, even after the aggressive presidency of George W. Bush, “Americans still want their commander-in-chief to take command. It is pointless for a modern president to plead that some things, such as the business cycle, are beyond his control” (“The Obama Cult” 2009, 32). In short, for the general public the president is the focal point of national politics and is likely to be blamed or rewarded for changes in federal spending in a constituency.
Contrasted with the clear reasons to expect a linkage, the dearth of previous studies on the influence of federal spending on presidential elections is striking. One study that does make such an inquiry is that by Wright (Reference Wright1974), which analyzes state-level data during the New Deal (1933 to 1940) and finds paltry evidence that federal spending influenced Roosevelt's vote share. Other studies have focused on narrow aspects of federal spending. For instance, Gasper and Reeves (Reference Gasper and Reeves2011) and Reeves (Reference Reeves2011) find evidence at the county and state levels that presidents are rewarded for decisions to provide federal aid in the aftermath of a natural disaster. Healy and Malhotra (Reference Healy and Malhotra2009) offer further evidence that county-level electorates reward incumbent presidents and their party for actual levels of disbursement of federal disaster aid, and Chen (Reference Chen2011) finds an effect of FEMA payouts on turnout at the individual level for Florida voters in 2004. Yet, these prior studies are limited in scope. One explanation for the scarcity of research in this vein is the modern scholarly conception of the president as a seeker of broad policy goals who provides a counterbalance to the particularistic aims of members of Congress (e.g., Acemoglu and Robinson Reference Acemoglu and Robinson2006; Cameron Reference Cameron2000; Hansen Reference Hansen1998; Moe Reference Moe1990; Moe and Howell Reference Moe and Howell1999).Footnote 6 Because the literature has focused on congressional efforts to target spending for electoral gain, it has also logically focused on whether members of Congress, not presidents, have reaped any electoral reward from their efforts.
In sum, we argue that there are strong reasons to expect electorates to reward presidents for federal spending. However, the benefit that presidents secure from increased spending may differ across specific electoral contexts and among different types of voters.
VOTERS AND FEDERAL SPENDING
Although our primary inquiry is the influence of federal spending on presidential election outcomes and its magnitude, we also consider the mechanisms that drive and condition these electoral effects. In thinking about how the distribution of federal grant spending across the country might influence vote choice, we draw on insights from recent scholarship on how voters assess two issues long held to influence voting: the economy and war (e.g., Hibbs Reference Hibbs2000). While much scholarship has focused on the effect of national circumstances on voters (sociotropic voting), other scholars emphasize that different citizens may experience political phenomena such as economic conditions or military conflict in fundamentally different ways.
One branch of scholarship argues that personal experiences with the economy and war are most influential in shaping popular assessments of these policy areas and in informing vote choice. For example, scholars have long emphasized the importance of “pocketbook” concerns: Citizens evaluate the economy and the national political leaders charged with its maintenance through the lens of their personal economic experiences (e.g., Kramer Reference Kramer1971; Lewis-Beck Reference Lewis-Beck1985; Popkin et al. Reference Popkin, Gorman, Phillips and Smith1976; Tufte Reference Tufte1978). In a similar vein, several recent studies suggest that citizens most directly affected by a war—such as those who are eligible for a military draft (Erikson and Stoker Reference Erikson and Stoker2011; Horowitz and Levendusky Reference Horowitz and Levendusky2011) or those who report personally knowing someone killed or wounded in a war (Kriner and Shen Reference Kriner and Shen2010)—hold significantly different opinions and exhibit different voting behaviors than their peers without such direct wartime experience.
A second branch of scholarship argues that how citizens respond to the economy and armed conflict is also mediated by the experiences of their local communities. For example, research has shown that citizens' assessments of the state of the economy are significantly shaped by economic conditions in their communities, such as local unemployment, the state of the housing market, and even gas prices (Books and Prysby Reference Books and Prysby1999; Mondak, Mutz, and Huckfeldt Reference Mondak, Mutz, Huckfeldt, Mutz, Sniderman and Brody1996, Reeves and Gimpel Reference Reeves and Gimpel2012). Similarly, scholars have found considerable evidence that the significant variation in casualty rates across states and counties affects both Americans' policy assessments and their voting behavior at the ballot box (Gartner Reference Gartner2008; Gartner, Segura, and Barratt Reference Gartner, Segura and Barratt2004; Gartner, Segura, and Wilkening Reference Gartner, Segura and Wilkening1997; Grose and Oppenheimer Reference Grose and Oppenheimer2007; Karol and Miguel Reference Karol and Miguel2007; Kriner and Shen Reference Kriner and Shen2007).
This research thus suggests two ways in which the uneven distribution of grant spending across the country might influence presidential voting patterns. First, residents of counties that receive an infusion of election-year grant spending may be more likely to perceive direct personal benefits from federal spending than residents of counties that did not receive increased grant spending. Such voters might judge the administration more responsive to their needs, evaluate its performance more favorably, and become increasingly likely to vote for the incumbent party. Second, past research suggests that voters need not personally receive federal benefits to be influenced by increased federal spending in their community. Rather, through personal networks of family and friends, as well as local news coverage of the impact of recent federal spending in their communities, voters in high-spending communities may perceive the incumbent administration in a more favorable light. Thus, regardless of whether voters actually hold the president functionally responsible for such increased benefits (to themselves or their communities) or whether voters are simply retrospective, for many Americans increased grant spending in their home county may increase their likelihood of voting for the incumbent party's candidate in the upcoming election.
Although previous scholarship suggests a baseline expectation that increased grant spending in a county should increase the incumbent party's vote share in that locality, we argue that not all voters should respond to federal spending in the same way. As a result, the electoral effects of grant spending should be greater in some communities and among some types of voters than others. First, we consider the political context in which voters process information about their local community's share of federal funding as part of their electoral calculus. We argue that the president will receive the greatest electoral benefits from increased grant spending in communities where voters are clearly able to attribute responsibility for that spending to the president and his party. The more responsible voters believe that presidents are for delivering benefits to their community, the more likely they should be to reward them accordingly. Given presidents' strong institutional role in shaping the distribution of federal spending (Schick and LoStracco Reference Schick and LoStracco2000), all voters may logically hold them accountable for it (Powell and Whitten Reference Powell and Whitten1993; Rudolph Reference Rudolph2003). However, because responsibility for the distribution of federal spending is ultimately shared between the executive and legislative branches, we posit that the partisan composition of a county's congressional representatives will influence the likelihood that voters will attribute spending to presidents and their party.
Each voter is represented by one member of the House of Representatives and two senators. Voters represented by Democrats in both chambers may reward a Republican president differently for increased federal spending in their county than voters in counties represented exclusively by Republicans.Footnote 7 We posit that as the number of presidential co-partisans in a congressional delegation increases, lines of partisan accountability become clearer, and presidents will reap a greater electoral benefit from increased federal spending accordingly.
Second, we consider the role of ideology and its influence on the response of voters to spending. Federal spending may provide important information about how well administration policies are responding to the needs of a voter's community. However, whether an individual voter is inclined to support increased federal spending may also be a function of that individual's ideological preferences (Haselswerdt and Bartels Reference Haselswerdt and Bartels2011; Lazarus and Reilly Reference Lazarus and Reilly2010; Sidman and Mak Reference Sidman and Mak2006). Specifically, conservative voters may be less inclined to reward federal spending than liberal voters. Lazarus and Reilly (Reference Lazarus and Reilly2010) find that voters respond to different types of spending projects based on their ideological orientation. Sidman and Mak (Reference Sidman and Mak2006, 8) present a similar hypothesis with respect to how voters respond to fiscal spending and members of Congress: “[A] fiscally conservative voter should not vote for an incumbent that is spending at high amounts and a fiscally liberal voter should not vote for an incumbent that has decreased spending significantly.”
If individual voters' ideological orientations mediate the influence of federal spending on their decision calculus, then presidents should enjoy a greater electoral advantage from increased grant spending in more liberal communities and among liberal voters than in more conservative places and with conservative voters. In the analyses that follow, we look for indirect evidence consistent with this mechanism in the county-level results and for direct evidence of it in analysis of individual-level data.
DATA AND METHODS
Drawing on comprehensive election and federal spending data at the county level for all presidential contests from 1988 to 2008, we examine the electoral consequences of federal spending. Throughout our aggregate-level analysis, the dependent variable is the change in the two-party vote share received by the incumbent party's presidential candidate in a county from the preceding to the current election. Our independent variable of interest is the percentage change in federal grant spending in a county over the year preceding the presidential election contest.Footnote 8
We operationalize the dependent variable as the change in two-party vote share in a county for several reasons. First, the percentage a party receives in one presidential election is highly correlated with the percentage that party received in the county in the preceding election. Using the change in two-party vote share both alleviates potential difficulties in modeling and allows us to focus on the more politically relevant variable–the influence of spending on the change in vote share above or below its “baseline” level in a constituency.
Second, using the change in vote share helps address potential concerns about endogeneity in the relationship between spending and electoral outcomes. Previous research suggests that presidents may consider the political leanings of a constituency when seeking to influence the distribution of federal funds (Larcinese, Rizzo, and Testa Reference Larcinese, Rizzo and Testa2006). For example, presidents may endeavor to reward loyal constituencies and target funds toward swing places, while largely ignoring communities that voted heavily against them. Because the two-party vote share in a county in an election is highly correlated with the vote in that county in the preceding contest, a simple model with vote share as the dependent variable and change in spending as the independent variable of interest would raise concerns about endogeneity. However, using the change in vote share as the dependent variable significantly reduces such concerns. For endogeneity to be present in such a model, presidents would have to be able to anticipate not baseline levels of electoral support in the county, but the change in the county's vote share from the preceding election. Moreover, even if presidents could make such a calculation, they would also have to respond by seeking to raise or lower grant spending in that county accordingly. We believe that both are unlikely.Footnote 9
Measures of federal grant spending, our key independent variable, come from the Consolidated Federal Funds Reports (CFFR). We follow Berry, Burden, and Howell (Reference Berry, Burden and Howell2010, 790) and examine grants from this source because this is “the category of spending most amenable to pork-barreling.”Footnote 10 In the presidential election years that we examine, federal grants spending represents between 11% and 14.4% of total federal spending reported in the CFFR. For instance, in 2008 of a total federal budget of $4.42 trillion, $576 billion (or approximately 13%) was allocated to grants for hundreds of specific programs.Footnote 11
We formulate our independent variable of interest as the change in grant spending between the election year and the year immediately prior.Footnote 12 This emphasis on the most recent changes in grant spending is in keeping with a lengthy literature on voting behavior and electoral forecasting that emphasizes the importance of only the most recent economic trends to voters' decision calculus. Summarizing the literature, Bartels (Reference Bartels2008) describes “myopic voters” who fail to take into account economic performance over the entire course of an administration and instead respond only to the most recent changes in the state of the economy (see also Bartels and Zaller Reference Bartels and Zaller2001; Erikson Reference Erikson1989; Erikson, Bafumi, and Wilson Reference Erikson, Bafumi and Wilson2001; Lewis-Beck and Stegmaier Reference Lewis-Beck and Stegmaier2000).Footnote 13 We use the percentage change to provide a standard measure of change in spending across counties, because the amounts of federal grants that counties receive vary widely both in terms of raw funding totals and in terms of grant dollars per capita.Footnote 14 However, to ensure the robustness of our results to alternative specifications, we also reestimate all of the models that follow using the change in per capita grant spending in a county as the independent variable of interest. These models, presented in the Online Appendix, yield virtually identical results to those presented here.
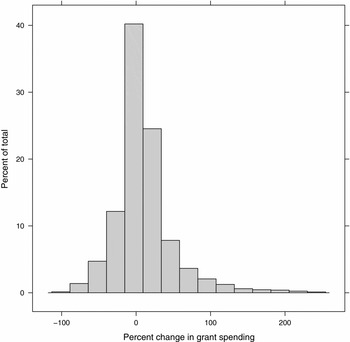
Figure 1 illustrates the distribution of changes in federal grant spending at the county level for presidential elections years from 1988 to 2008.Footnote 15 The median county sees a 10% increase in grants spending, and there is substantial variation across the country and from year to year in spending. Changes range from a decline of nearly 100% to an increase of more than 240%. This range reflects the sometimes dramatic changes in year-to-year spending levels. The changing distribution of grant spending is aptly characterized as “hyperincrementalism” by Jones and Baumgartner (Reference Jones and Baumgartner2005, 112), who also point out that “sometimes programs received huge boosts, propelling them to double or triple their original sizes or more. Sometimes, but less often, programs lost half or more of their funding.”
Distribution of Election Year Change in Grant Spending at the County Level, 1988 to 2008

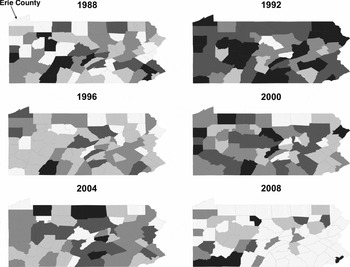
To illustrate the significant variation in our independent variable (even within a single county across repeated electoral contests), we present the changing distribution of funds among counties over time. Because changes are difficult to observe in a national map, we present data from Pennsylvania, a large swing state with a representative mix of urban and rural regions. Figure 2 shows the change in grants that Pennsylvania counties saw in the fiscal year preceding presidential elections from 1988 though 2008. There is substantial variation across this time period. The five shades of gray (lightest to darkest) represent five quintiles of changes in spending (lowest to highest) observed over the full dataset. Consider Erie County, the northernmost county on the western border of Pennsylvania, which has a population of more than 280,000. In some years (1988, 2004, and 2008), Erie saw decreases in grant spending from the previous year. In 2000, Erie saw a modest 3% increase, whereas in 1992 and 1996 it saw 30% and 13% increases, respectively. Federal grant spending varies dramatically across time and space; counties might see large increases in spending in the year of one presidential election, but may see a decrease in spending in other years.
Change in Grant Spending in Pennsylvania Counties, 1988 to 2008

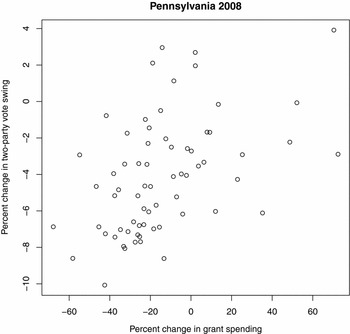
Our broadest hypothesis is that changes in federal grant spending will translate into electoral support for the president. By way of example, this bivariate relationship from Pennsylvania in 2008 is presented in Figure 3. The x-axis shows the change in federal grant spending between fiscal year 2007 and 2008, and the y-axis shows the change between George W. Bush's vote in 2004 and John McCain's vote share in 2008. That McCain almost universally underperformed Bush is of little surprise; more provocative is the finding that these deficits were minimized in counties that saw substantial increases in federal spending.
Effect of Changes in Federal Grant Spending on McCain's Share of the Two-Party Vote in 2008 in Pennsylvania Counties

EFFECT OF FEDERAL SPENDING ON PRESIDENTIAL ELECTIONS
To assess the effect of federal grant spending on presidential electoral fortunes, we estimate a series of least squares models. As an initial inquiry, we begin by modeling the change in the incumbent party's vote share within a county solely as a function of the percentage change in federal grant spending within that county over the preceding year.Footnote 16 Because we use time-series, cross-sectional data, all models also include both county and year fixed effects and report standard errors clustered on the county.Footnote 17
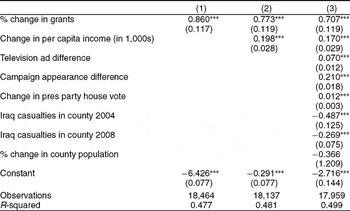
The first column in Table 1 presents the bivariate results for our base model of all counties in all presidential elections from 1988 to 2008. Consistent with our theory that voters will reward presidents for increases in federal largesse in their local communities, the coefficient for the change in federal grant spending in the county is positive and highly statistically significant.Footnote 18 To ensure that this result is not an artifact of failing to control for other factors that drive electoral outcomes, the final two columns add several control variables. Given the long documented retrospective tendencies of many American voters (inter alia, Erikson Reference Erikson1989; Fiorina Reference Fiorina1981; Hibbs Reference Hibbs1987), the model in column 2 also includes the percentage change in per capita personal income (in constant 2008 dollars) obtained from the Bureau of Economic Analysis in each county during the year immediately preceding each election contest. The coefficient for increasing income levels is positive and statistically significant as expected, and the coefficient for federal spending also remains substantively large and statistically significant.
Effect of Federal Spending on Incumbent Presidential Vote Share, U.S. Counties, 1988 to 2008

***p < 0.01. **p < 0.05. *p < 0.10.
Notes: Least squares model with fixed effects for counties and years. Dependent variable is the percent change in county-level vote for the incumbent president (or the incumbent party) since the previous presidential election. Increased grant spending leads to increased incumbent presidential vote share. Robust standard errors clustered on county in parentheses.
The third model specification adds a number of control variables to account for other factors, including campaign activity, that might also drive electoral outcomes. First, this model includes two measures of campaign activity drawn from Shaw (Reference Shaw1999a; Reference Shaw2006) and Huang and Shaw (Reference Huang and Shaw2009): the differentials in state-level TV advertising and campaign appearances between the incumbent party candidate and the challenger. In addition to the state of the economy, elections scholars have also shown that war can significantly influence the incumbent's prospects at the ballot box (e.g., Aldrich, Sullivan, and Borgida Reference Aldrich, Sullivan and Borgida1989; Hibbs Reference Hibbs2000; Reference Hibbs2008). Moreover, a growing literature asserts that the uneven distribution of a war's costs, particularly casualties, across the country can significantly affect variation in electoral outcomes (Gartner, Segura, and Barratt Reference Gartner, Segura and Barratt2004; Grose and Oppenheimer Reference Grose and Oppenheimer2007; Karol and Miguel Reference Karol and Miguel2007; Kriner and Shen Reference Kriner and Shen2007). To account for this effect, we include the number of Iraq War casualties from each county as of the 2004 and 2008 elections.
Finally, this specification includes two additional variables to account for possible changing political dynamics within a county: the change in vote share secured by the House candidate of the incumbent president's party from the midterm to the current election and the percentage change in county population over the year preceding the election. The change in the House vote affords a strong control for recent changing political dynamics within a county. The two variables together also afford a test for an alternate causal story emphasizing changing population flows into and out of a county that might explain the previously observed correlation between spending and presidential vote share.Footnote 19
Even in this expanded model specification, we continue to find a strong and statistically significant positive relationship between federal spending and incumbent vote share. Moreover, the control variables all largely accord with theoretical expectations derived from past research. The greater the incumbent party candidate's campaign efforts in a state relative to the challenger, the stronger the electoral performance. President Bush and John McCain performed worse, ceteris paribus, in counties that had suffered greater numbers of casualties in the Iraq War in 2004 and 2008, respectively. Presidents also enjoyed greater electoral success in counties where their party's House candidate also enjoyed increasing electoral fortunes. Finally, we find no evidence that incumbent party candidates are simply enjoying greater electoral success in counties that had experienced significant changes in population.Footnote 20
As a final robustness check on an alternative programmatic hypothesis, we also reestimate the model including an additional variable: the percentage change in nongrant federal spending that a county received in the year preceding the presidential election. Including this variable controls for the possibility that changes in grant spending may be serving as a proxy for other forms of federal spending that are less amenable to political control. Results are virtually identical to those reported in Table 1. Federal grant spending continues to have a strong, statistically significant effect on presidential vote share. The coefficient for nongrant spending is also positive; however, it is substantively small and fails to reach conventional levels of statistical significance.
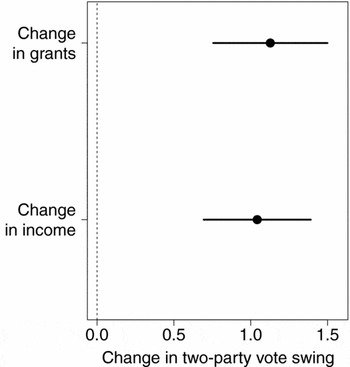
Figure 4 presents the substantive effects of the model. Because our dependent variable is the share of the two-party vote received by the president (or the party's designate) in each county, each estimated effect can be doubled to calculate the vote swing between the two candidates. For example, a 1% increase in the Republican candidate's two-party vote share also decreases the Democrat's share by 1%; this yields a 2% swing in the final result. For our independent variable of interest—the percent change in federal grant spending—we present the effect of moving from a standard deviation below the mean to a standard deviation above the mean on the change in the two-party presidential vote swing. As a basis of comparison, we also present the effect of a two-standard deviation increase in per capita income. We show that the estimated effect of federal spending on election outcomes is noteworthy. An 80% increase in federal grant spending, which represents an increase from one standard deviation below to one standard deviation above the mean value, increases the incumbent's party vote by more than 0.5%. This translates into a more than 1.1% swing in the two-party vote share in that county.Footnote 21 This change is comparable to the estimated effect of an identical shift in per capita income on the vote, a factor long held to significantly influence voting behavior in presidential elections.Footnote 22 A two-standard deviation increase in per capita income yields a 1% swing in the two-party vote, which is slightly smaller than the point estimate for the effect of grant spending.Footnote 23
Effect of Federal Spending on Incumbent Presidential Vote Share, U.S. Counties, 1988 to 2008

These findings show that voters reward or punish presidents accordingly for changing patterns of federal spending. This dynamic is strongly consistent with both a long literature emphasizing the increasing “presidentialization” of our politics (Neustadt Reference Neustadt1990; Rossiter Reference Rossiter1960) and with recent studies demonstrating the important role that the president plays in the distribution of federal grant dollars across the country (Berry, Burden, and Howell Reference Berry, Burden and Howell2010; Larcinese, Rizzo, and Testa Reference Larcinese, Rizzo and Testa2006).
How consequential are the effects observed in Table 1 and Figure 4? A 1.1% swing in the national two-party vote share is potentially decisive in an era of razor-thin presidential electoral margins. However, because of the nature of presidential elections the importance of a 1.1% swing at the county level depends on the competitiveness of the state in which it is located. If presidents simply reap electoral rewards for increased spending in states where the final outcome is not in doubt, then the electoral consequences of spending would be minimal.
Thus, to examine the real-world importance of the spending effect we consider the differential effects of federal spending in battleground and nonbattleground states. There are strong reasons to expect that the effects of increased federal spending may be even larger in competitive battleground states where campaigns explicitly prime voters to consider the achievements of the incumbent administration, including its ability to direct federal grants to voters. Presidential candidates spend most of their time in battleground states (Shaw Reference Shaw2006) and target their advertising dollars there (Goldstein and Freedman Reference Goldstein and Freedman2002), highlighting their qualifications to be president. Incumbent party candidates may tout increased levels of federal spending and the associated economic benefits, including jobs or improved public resources. For instance, in 2004 George W. Bush announced a $1.5 billion plan for the restoration of the Florida Everglades. The announcement, covered extensively in local media outlets, was made at Boynton Beach in Palm Beach County, the epicenter of the battle for the 2000 election. The potential electoral impact did not go unnoticed by Bush's opponents, who attempted to counteract that announcement with local appearances by Ted Danson and other celebrities (Pittman Reference Pittman2004). Given the disproportionate elite mobilization in battleground states, voters in these areas may be primed to consider the role of presidents in providing federal dollars and therefore more likely to reward them for those grants.Footnote 24
When voters are primed to link increased federal spending to the president's actions, presidents should be more likely to receive credit. This assumption is echoed by Arceneaux (Reference Arceneaux2006), who finds that voters can distinguish between the roles of politicians when casting votes only when the “issue attitudes are highly accessible” (731). Likewise, Malhotra and Kuo (Reference Malhotra and Kuo2008) show in an experimental setting that voters who are given cues about the responsibility of a politician are more likely to hold them accountable. Accordingly, because battleground voters are more likely to receive stronger cues both on increased federal spending in their communities and on the role of the president in increasing federal aid, we posit that they should be more likely to reward the incumbent president for spending.
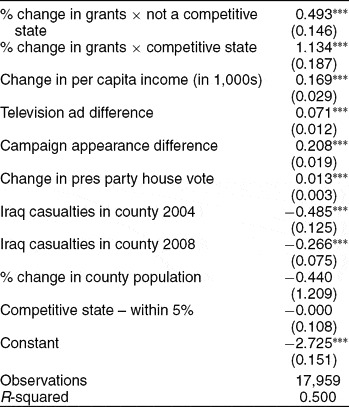
To test the importance of electoral context, the model in Table 2 includes two new terms: an indicator variable identifying whether a county is in one of the most competitive states and the interaction of this variable with the change in federal grant spending in the county. We define competitive states as those in which the losing candidate averaged 45% or more of the two-party vote share in the preceding three electoral contests.Footnote 25
Effect of Federal Spending and Electoral Competitiveness on Incumbent Presidential Vote Share, U.S. Counties, 1988 to 2008

***p < 0.01. **p < 0.05. *p < 0.10.
Notes: Least squares model with fixed effects for counties and years. Dependent variable is the percent change in county-level vote for the incumbent president (or the incumbent party) since the previous presidential election. Competitive states are those in which the losing candidate averaged 45% or more of the two-party vote in the preceding three presidential elections. Counties in competitive states reward presidents for federal spending at higher levels than counties in uncompetitive states. Robust standard errors clustered on county in parentheses.
Consistent with our hypothesis, the coefficients for change in grant spending are positive and statistically significant in both competitive and noncompetitive states; however, the coefficient is more than twice as large in competitive states. This shows that, although incumbent presidents (or their party's nominee) enjoyed an electoral advantage from federal spending in counties from nonswing states, the electoral boost from grant spending is even larger in counties from swing states.
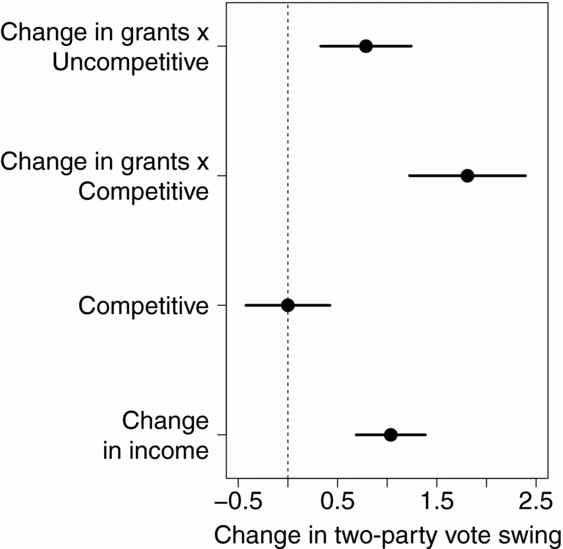
Figure 5 presents the effects of grant spending, personal income, and state competitiveness on the change in the two-party vote swing. For grant spending and per capita income, the effects are generated by increasing the variables from one standard deviation below their respective means to one standard deviation above their mean. Because competitiveness is a binary indicator, we present the effect of a one-unit increase for its individual effect. For states that were not competitive, we see that the percent change in grants is still a statistically significant predictor of vote swings. In noncompetitive states, a two-standard deviation increase in grant spending yields a .79% swing in the two-party vote.Footnote 26 In competitive states, a similar increase causes an estimated 1.8% shift in the two-party vote, an electoral boost that is more than twice the magnitude of that observed in noncompetitive states.Footnote 27 This effect is substantively much greater than an equivalent shift in the county's personal per capita income.
Effect of Federal Spending and Electoral Competitiveness on Incumbent Presidential Vote Share, U.S. Counties, 1988 to 2008
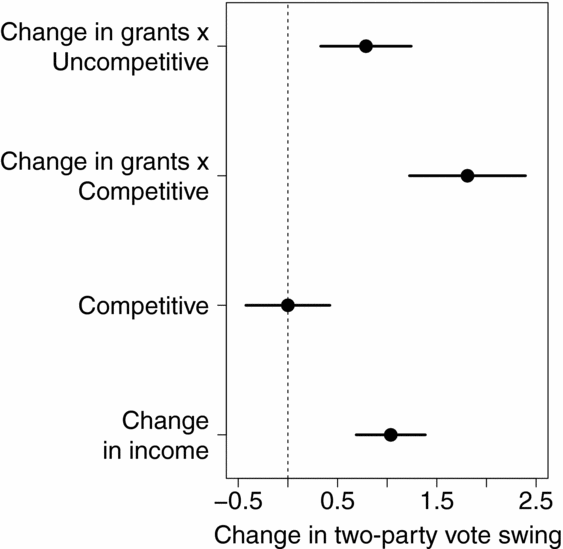
Politically, swings of this magnitude are plainly significant. In 2004, a 1.8% swing in the two-party vote could have flipped nine states, including delegate-rich Michigan, Ohio, and Pennsylvania, from one column to the other. Moreover, even within individual counties, a shift of this size could be consequential. For example, a 1.8% swing for President Bush in Milwaukee and Dane Counties in Wisconsin in 2004 would have netted him more than 13,500 additional votes.Footnote 28 Senator Kerry won the state by less than 12,000 votes that year. Any similar shift in almost any Florida county in 2000 would also have changed the outcome of the election.Footnote 29
MECHANISMS OF INFLUENCE
How do federal dollars translate into an increased willingness for voters to support the incumbent administration and its successors? Here, we explore two possible mechanisms that influence the size of the electoral award that presidents receive from increased federal spending. First, we examine how the clarity of partisan accountability mediates the electoral consequences of federal spending. Second, we examine how the ideological predispositions of individual voters shape the influence of federal spending on vote choice.
Clarity of Partisan Accountability
Our analysis suggests that voters use levels of federal spending in their community to evaluate the incumbent president. Increased spending encourages voters to reward incumbents, and decreased spending leads them to punish incumbent administrations. However, when factoring spending patterns into their presidential vote, individuals may take into account the partisanship of their representatives in Congress. If they are represented by members who are not of the president's party, then voters might be hesitant to attribute increased federal largesse to the president and to reward him accordingly.
As a result, we hypothesize that the electoral rewards from federal spending should be stronger in counties that are also represented by the president's co-partisans on Capitol Hill. For example, voters in a county with a Democratic representative and two Democratic senators may attribute responsibility for increased federal spending to their members of Congress instead of the Republican president. For these voters, patterns in federal spending may not send an overly clear signal about how well the incumbent administration's policies match the needs of their community. By contrast, in counties represented by only Republicans in Congress, the partisan lines of accountability are clear and spending patterns provide a direct signal.
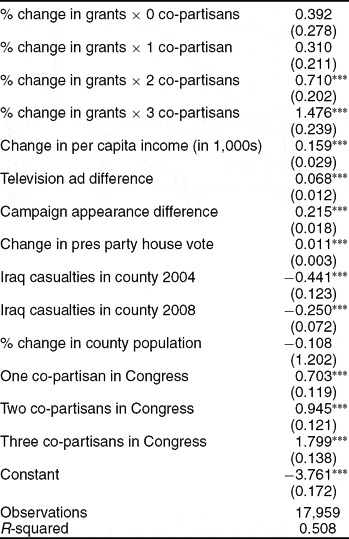
To test this expectation, Table 3 estimates the fully specified model (from column 3 in Table 1) with several new variables: three indicator variables for the number of congressional representatives who share the president's partisan affiliation in each county and the interaction of each indicator with the change in federal spending measure.Footnote 30 For all four interaction variables, the coefficient is positive; however, the model suggests that the relationship between federal grant spending and presidential electoral success is only statistically significant in counties that are represented by two or more members of the president's party in Congress.Footnote 31 Moreover, the magnitude of the spending effect is greatest when partisan accountability is clearest, that is, in counties that are completely represented by the president's party in Congress.
Effect of Spending and Partisan Accountability on Incumbent Presidential Vote Share, U.S. Counties, 1988 to 2008

***p < 0.01. **p < 0.05. *p < 0.10.
Notes: Least squares model with fixed effects for counties and years. Dependent variable is the percent change in county-level vote for the incumbent president (or the incumbent party) since the previous presidential election. Each county can be represented by between zero and three members of the president's party in Congress (one representative and two senators) who share the same party as the president. As partisan accountability becomes clearer, voters more strongly reward incumbent presidents for increased grant spending. Robust standard errors clustered on county in parentheses.
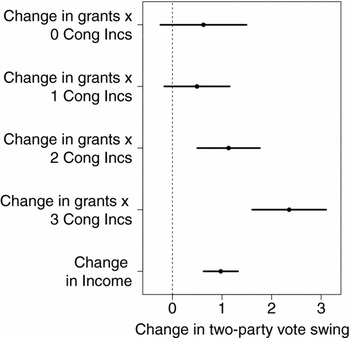
Figure 6 presents the effect of federal spending on incumbent party vote share according to each of the four levels of partisan accountability. The first four rows in Figure 6 present estimates for the interaction between a two-standard deviation increase in spending and the number of presidential co-partisans in Congress (ranging from zero to three). For a county with zero or one co-partisans, the effect is relatively small at about a half-point. For counties with two and three co-partisans, we see increases of 1.1% and 2.4%, respectively.Footnote 32 These increases are in addition to the already sizable effects of having congressional co-partisans represent the county. The results suggest that credit for federal spending is mediated by the ability of voters to attribute awards to presidents and their party. When presidents have to battle other-party members of Congress for a share of the credit, the electoral benefits are diminished. In counties represented by presidential co-partisans, partisan responsibility for a new or expanded federal project is clear and voters reward the president with considerable additional support.
Effect of Spending and Partisan Accountability on Incumbent Presidential Vote Share, U.S. Counties, 1988 to 2008

Influence of Ideology at the Contextual Level
The results of the preceding section strongly suggest that the partisan context in which voters evaluate federal spending mediates the degree to which they reward the president for increases in federal grants in their community. We now examine how ideology mediates the relationship between spending and votes.
As described previously, liberal voters may be more ideologically predisposed than conservative voters to reward an incumbent administration for increased federal spending. This mechanism may manifest itself in two ways. First, incumbent presidents (or their party's nominees) should reap a greater electoral reward from increased spending in more ideologically liberal counties than in conservative counties. Second, at the individual level, federal spending in a voter's constituency should have more influence on the vote choice of self-identified liberals than on the voting calculus of self-identified conservatives. Here, we examine whether presidents enjoy a greater electoral reward for federal spending in liberal and moderate counties than in conservative counties. In the following section, we employ a more direct test for the role of ideology and examine whether individual voters with more conservative ideologies are indeed less likely to reward presidents for federal spending in their communities than liberal and moderate voters.
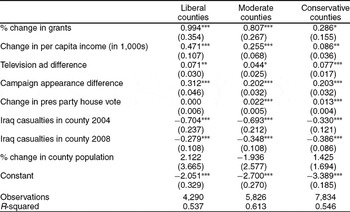
As an initial test of the posited mechanism, we examine the differential effect of spending in liberal, moderate, and conservative counties. We base these designations on the normal vote (Converse Reference Converse, Campbell, Converse, Miller and Stokes1966). For each county we calculated the average percentage of the two-party vote that the Republican candidate received in the preceding three presidential elections. Following a long line of scholarship (e.g., Ansolabehere and Snyer Reference Ansolabehere and Snyder2004; Boyd Reference Boyd1972; Levendusky, Pope, and Jackman Reference Levendusky, Pope and Jackman2008; Nardulli Reference Nardulli1994), we rely on this measure as an indicator for county ideology. We divide all counties in each year into three groups weighted by population: The first group comprises the bottom third of counties in terms of average GOP vote share, the second group the middle third, and the final group the top third in terms of GOP vote share. We then estimate separate regressions for each of the groups. If our hypothesis is correct, the relationship between grant spending and presidential election outcomes should be stronger in liberal counties than in conservative counties.
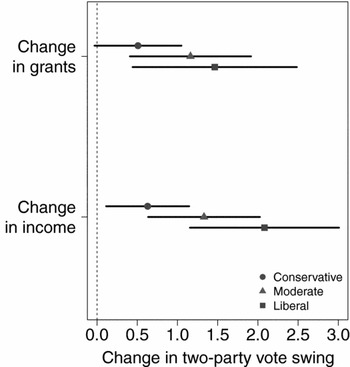
The results presented in Table 4 are broadly consistent with our hypothesis. Although the effect of grant spending is statistically significant in each of our models, the magnitude of the effect is significantly smaller in conservative counties, as shown in Figure 7. In the most conservative counties, the estimated effect of increased spending is quite small: A two-standard deviation increase in spending yields only a half-point swing in the incumbent's two-party vote share.Footnote 33 By contrast, in liberal and moderate counties, the effect of federal spending is well over twice as large.
Effect of Federal Spending and Ideology on Incumbent Presidential Vote Share, U.S. Counties, 1998 to 2008

***p < 0.01. **p < 0.05. *p < 0.10.
Notes: Least squares model with fixed effects for counties and years. Dependent variable is the percent change in county-level vote for the incumbent president (or the incumbent party) since the previous presidential election. We divide all counties into three groups (liberal, moderate, and conservative) weighted by population based on their normal vote. Presidents reap smaller electoral rewards from increased spending in conservative counties. Robust standard errors clustered on county in parentheses.
Effect of Federal Spending and Ideology on Incumbent Presidential Vote Share, U.S. Counties, 1998 to 2008

These results again clearly demonstrate that the electoral consequences of federal spending depend on context; presidents enjoy significantly greater advantages from federal spending in liberal and moderate counties than they do in conservative counties. This pattern is consistent with our theoretical emphasis on the mediating influence of ideology. However, because of barriers to ecological inference, we cannot make any direct conclusions about ideology's role from aggregate data alone. Accordingly, the analysis now shifts to the individual level using survey data from the 2008 election.
Influence of Ideology at the Individual Level
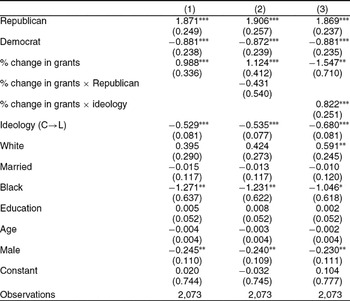
In the previous sections, we examined county-level data to assess the magnitude of the effects of federal spending on presidential elections. We now consider individual-level survey data to further understand the mechanisms at work. First, we investigate whether the relationship between federal grant spending and the likelihood of voting for the incumbent presidential party holds at the individual level, even after controlling for individual respondents' partisanship and other demographic characteristics. At least since Kramer (Reference Kramer1983), scholars have documented how strong correlations between economic variables and voting patterns at the aggregate level sometimes fail to reappear in analyses of individual-level vote choice. At the individual level, research shows that partisanship substantially influences economic attitudes and evaluations (e.g., Conover, Feldman, and Knight Reference Conover, Feldman and Knight1987; Evans and Andersen Reference Evans and Andersen2006; Gerber and Huber Reference Gerber and Huber2010; Lewis-Beck, Nadeau, and Elias Reference Lewis-Beck, Nadeau and Elias2008). As a result, we first consider whether federal spending in a respondent's congressional district influences vote choice independent of standard explanatory factors of voting. Second, if there is an effect for federal spending, we examine whether that effect is conditional on respondent partisanship. Do only presidential co-partisan voters, or alternatively voters who are affiliated with the opposition party, reward the president for increased federal spending? Or do voters of all partisan stripes reward the incumbent party equally for increased federal dollars channeled to their communities? Finally, we investigate directly the relationship between voter ideology and the influence of federal spending on vote choice. Specifically, we examine whether conservatives are less likely to reward presidents for increased federal spending than liberal or moderate voters.
To test these hypotheses, we use Gallup polling data from the eve of the 2008 election to examine whether voters rewarded the Republican nominee, John McCain, for increases in federal spending in their constituencies.Footnote 34 The dependent variable is whether the respondent said that he or she intended to vote for John McCain.Footnote 35 We use a probit model to assess the influence of federal spending on vote choice even after controlling for partisanship and a host of other demographic characteristics. Specifically, we operationalize the probability of voting for McCain as a function of the percentage change in federal spending in the respondent's constituency over the preceding year, his or her partisan affiliation, ideology, race, marital status, educational attainment, age, and gender.Footnote 36
Table 5 presents the results. Even after controlling for a respondent's partisanship and demographic background, we find strong evidence of a contextual effect for federal spending. Increased federal spending in a respondent's district during the last year of the Bush administration significantly raises the probability of that respondent voting for John McCain. A two-standard deviation increase in federal grant spending increases the predicted probability of an average Republican respondent voting for McCain from .82 to .93, all else being equal; the same shift increased the predicted probability of an average Democratic voter supporting McCain from .04 to .11.Footnote 37
Effect of Federal Spending and Ideology on Presidential Vote Choice, Individual-Level Analysis, 2008

***p < 0.01. **p < 0.05, *p < 0.1.
Notes: Estimates from a probit model with fixed effects for state. Dependent variable is vote intention for McCain. Robust standard errors in parentheses.
Although the individual-level results provide an important robustness check on our county-level results, they also allow us to investigate whether individual voters' partisanship mediates their electoral responsiveness to federal spending. To test this, the model in column 2 includes an additional variable: the interaction of the spending measure and the Republican party indicator variable. The main effect for federal spending remains positive and statistically significant, whereas the coefficient for the interaction term is statistically insignificant; indeed, the coefficient is smaller than its standard error. In 2008 voters of all partisan stripes rewarded the Republican candidate in districts where federal spending had increased under the incumbent Republican administration.
Finally, the individual-level data also afford a direct test of our hypothesis that liberals are more willing to reward incumbent party presidential candidates—even a Republican candidate—for increased federal spending in their constituency. Accordingly, the third column in Table 5 reestimates the model with an additional term: an interaction between grant spending and an individual's self-placement on a 5-point ideology scale ranging from very conservative (1) to very liberal (5). Consistent with expectations, the interaction term is positive and statistically significant.
First differences from simulations again illustrate the estimated size of the effect. More than 70% of Republicans in the sample identified as strongly conservative or conservative. Among this subset of respondents, increases in federal spending had virtually no effect on vote choice. For all respondents in these categories, the predicted probability of voting for McCain was in excess of .95. For the 27% of Republicans who identified as ideological moderates, however, federal spending had a significant influence on their predicted vote choice. For these respondents, a two-standard deviation increase in grant spending raised the predicted probability of voting for McCain from .79 to .90. By contrast, whereas 15% of Democrats identified themselves as conservatives, 39% identified themselves as moderates and 34% as liberals. Among conservative Democrats, the estimated effect of increased spending was modest, raising the predicted probability of voting for McCain from .14 to .16. Among moderate Democrats, the effect was considerably larger, as a two-standard deviation shift in grant spending increased the probability of voting for McCain from .03 to .08. Among liberal Democrats, a two-standard deviation increase in spending increased the probability of voting for McCain from less than .01 to just under .04.
Thus, the evidence is consistent with our posited theoretical mechanism at the individual level. Citizens process information about increased federal spending differently. Self-identified liberals and moderates, who are not ideologically predisposed to disapprove of federal spending, significantly reward presidents for increased federal dollars sent to their communities. However, voters who identify as conservatives give incumbent administrations very little if any electoral boost in response to increased spending in their districts.
DISCUSSION
In this article, we have shown that presidents are rewarded at the ballot box for federal spending. The effect is particularly dramatic in battleground states. Given that relatively small vote margins in competitive states determined the presidential elections of 2000 and 2004, the allocation of federal funds may be pivotal in determining who wins the White House.
These findings provide insight into the role of the president and the behavior of voters. As recent research has found, presidents exert substantial control over the distribution of federal resources. Although Congress and the bureaucracy act as checks on this power, voters take notice of the president. In contrast to studies that find weak or highly contingent electoral benefits from pork barrel politics for members of Congress, we find relatively strong and consistent effects for presidents. As the national debt and government spending increasingly become hot button issues, it remains to be seen whether voters will continue to reward presidents for pork. Perhaps so. Republican presidents may continue to reject federal largesse in the abstract but, like President George W. Bush, extol specific projects such as the community health center in Sioux Falls. Similarly, Democratic presidents with a base ideologically predisposed to approve of increased federal spending may also have incentives to spend generously.
In addition to providing estimates of the magnitude of the electoral effects of federal spending, we also examined the mechanisms behind it. Clarity of accountability determines the extent to which voters reward the president. When politicians of different parties compete for credit, the effect is diminished. Yet when a county is also represented by presidential co-partisans in Congress, increases in federal spending may cause large vote swings in the president's favor. We also find that the characteristics of the places and voters receiving the funds condition the effect. Both conservative counties and individuals offer decidedly more tepid support for federal spending than liberal and moderate counties and voters. This suggests that the political ire driving groups like the Tea Party is more than confusion typified by the plea to “keep your government hands off my Medicare.”Footnote 38 Our findings show that conservative voters are relatively unresponsive to federal largesse when compared to liberals and moderates.
What of members of Congress? Article I grants the power of the purse to the legislature, and directing federal resources to home districts is a most basic reelection activity. Yet, our results suggest that, in the contemporary era of “presidentialized” politics, voters readily reward or punish the president for the localized distribution of federal grant spending. Has this fundamentally diminished the gains legislators stand to reap from engaging in distributive politics? Future research should expand the scope of analysis to examine the electoral influence of spending across levels of government. Additional work is needed to assess the relative ballot box rewards that senators, representatives, governors, and presidents enjoy from securing federal benefits, as well as how these dynamics differ across political contexts and over time.



Comments
No Comments have been published for this article.