


%20--%3e%3c!DOCTYPE%20svg%20PUBLIC%20'-//W3C//DTD%20SVG%201.0//EN'%20'http://www.w3.org/TR/2001/REC-SVG-20010904/DTD/svg10.dtd'%3e%3csvg%20version='1.0'%20id='Layer_1'%20xmlns='http://www.w3.org/2000/svg'%20xmlns:xlink='http://www.w3.org/1999/xlink'%20x='0px'%20y='0px'%20width='64px'%20height='64px'%20viewBox='5.5%20-3.5%2064%2064'%20enable-background='new%205.5%20-3.5%2064%2064'%20xml:space='preserve'%3e%3cg%3e%3ccircle%20fill='%23FFFFFF'%20fill-opacity='0'%20cx='37.785'%20cy='28.501'%20r='28.836'/%3e%3cpath%20fill='%23595959'%20d='M37.441-3.5c8.951,0,16.572,3.125,22.857,9.372c3.008,3.009,5.295,6.448,6.857,10.314%20c1.561,3.867,2.344,7.971,2.344,12.314c0,4.381-0.773,8.486-2.314,12.313c-1.543,3.828-3.82,7.21-6.828,10.143%20c-3.123,3.085-6.666,5.448-10.629,7.086c-3.961,1.638-8.057,2.457-12.285,2.457s-8.276-0.808-12.143-2.429%20c-3.866-1.618-7.333-3.961-10.4-7.027c-3.067-3.066-5.4-6.524-7-10.372S5.5,32.767,5.5,28.5c0-4.229,0.809-8.295,2.428-12.2%20c1.619-3.905,3.972-7.4,7.057-10.486C21.08-0.394,28.565-3.5,37.441-3.5z%20M37.557,2.272c-7.314,0-13.467,2.553-18.458,7.657%20c-2.515,2.553-4.448,5.419-5.8,8.6c-1.354,3.181-2.029,6.505-2.029,9.972c0,3.429,0.675,6.734,2.029,9.913%20c1.353,3.183,3.285,6.021,5.8,8.516c2.514,2.496,5.351,4.399,8.515,5.715c3.161,1.314,6.476,1.971,9.943,1.971%20c3.428,0,6.75-0.665,9.973-1.999c3.219-1.335,6.121-3.257,8.713-5.771c4.99-4.876,7.484-10.99,7.484-18.344%20c0-3.543-0.648-6.895-1.943-10.057c-1.293-3.162-3.18-5.98-5.654-8.458C50.984,4.844,44.795,2.272,37.557,2.272z%20M37.156,23.187%20l-4.287,2.229c-0.458-0.951-1.019-1.619-1.685-2c-0.667-0.38-1.286-0.571-1.858-0.571c-2.856,0-4.286,1.885-4.286,5.657%20c0,1.714,0.362,3.084,1.085,4.113c0.724,1.029,1.791,1.544,3.201,1.544c1.867,0,3.181-0.915,3.944-2.743l3.942,2%20c-0.838,1.563-2,2.791-3.486,3.686c-1.484,0.896-3.123,1.343-4.914,1.343c-2.857,0-5.163-0.875-6.915-2.629%20c-1.752-1.752-2.628-4.19-2.628-7.313c0-3.048,0.886-5.466,2.657-7.257c1.771-1.79,4.009-2.686,6.715-2.686%20C32.604,18.558,35.441,20.101,37.156,23.187z%20M55.613,23.187l-4.229,2.229c-0.457-0.951-1.02-1.619-1.686-2%20c-0.668-0.38-1.307-0.571-1.914-0.571c-2.857,0-4.287,1.885-4.287,5.657c0,1.714,0.363,3.084,1.086,4.113%20c0.723,1.029,1.789,1.544,3.201,1.544c1.865,0,3.18-0.915,3.941-2.743l4,2c-0.875,1.563-2.057,2.791-3.541,3.686%20c-1.486,0.896-3.105,1.343-4.857,1.343c-2.896,0-5.209-0.875-6.941-2.629c-1.736-1.752-2.602-4.19-2.602-7.313%20c0-3.048,0.885-5.466,2.658-7.257c1.77-1.79,4.008-2.686,6.713-2.686C51.117,18.558,53.938,20.101,55.613,23.187z'/%3e%3c/g%3e%3c/svg%3e)
%20--%3e%3c!DOCTYPE%20svg%20PUBLIC%20'-//W3C//DTD%20SVG%201.0//EN'%20'http://www.w3.org/TR/2001/REC-SVG-20010904/DTD/svg10.dtd'%3e%3csvg%20version='1.0'%20id='Layer_1'%20xmlns='http://www.w3.org/2000/svg'%20xmlns:xlink='http://www.w3.org/1999/xlink'%20x='0px'%20y='0px'%20width='64px'%20height='64px'%20viewBox='5.5%20-3.5%2064%2064'%20enable-background='new%205.5%20-3.5%2064%2064'%20xml:space='preserve'%3e%3cg%3e%3ccircle%20fill='%23FFFFFF'%20fill-opacity='0'%20cx='37.637'%20cy='28.806'%20r='28.276'/%3e%3cg%3e%3cpath%20fill='%23595959'%20d='M37.443-3.5c8.988,0,16.57,3.085,22.742,9.257C66.393,11.967,69.5,19.548,69.5,28.5c0,8.991-3.049,16.476-9.145,22.456%20C53.879,57.319,46.242,60.5,37.443,60.5c-8.649,0-16.153-3.144-22.514-9.43C8.644,44.784,5.5,37.262,5.5,28.5%20c0-8.761,3.144-16.342,9.429-22.742C21.101-0.415,28.604-3.5,37.443-3.5z%20M37.557,2.272c-7.276,0-13.428,2.553-18.457,7.657%20c-5.22,5.334-7.829,11.525-7.829,18.572c0,7.086,2.59,13.22,7.77,18.398c5.181,5.182,11.352,7.771,18.514,7.771%20c7.123,0,13.334-2.607,18.629-7.828c5.029-4.838,7.543-10.952,7.543-18.343c0-7.276-2.553-13.465-7.656-18.571%20C50.967,4.824,44.795,2.272,37.557,2.272z%20M46.129,20.557v13.085h-3.656v15.542h-9.944V33.643h-3.656V20.557%20c0-0.572,0.2-1.057,0.599-1.457c0.401-0.399,0.887-0.6,1.457-0.6h13.144c0.533,0,1.01,0.2,1.428,0.6%20C45.918,19.5,46.129,19.986,46.129,20.557z%20M33.042,12.329c0-3.008,1.485-4.514,4.458-4.514s4.457,1.504,4.457,4.514%20c0,2.971-1.486,4.457-4.457,4.457S33.042,15.3,33.042,12.329z'/%3e%3c/g%3e%3c/g%3e%3c/svg%3e)
Did the striking of preclearance reduce the number of Latino elected officials? In 1965, Congress passed the Voting Rights Act (VRA) to address state-sanctioned disenfranchisement of non-white voters and ensure equal access to the electoral process. Key provisions of the VRA are Sections 4 and 5, which require jurisdictions with documented histories of systemic racism and voter suppression to obtain federal preclearance before implementing new voting policies or procedures. However, nearly five decades after the Act passed with bipartisan approval, a 2013 Supreme Court decision in Shelby v. Holder (Shelby) invalidated Section 4, which in effect suspended the preclearance process contained within Section 5 and weakened the protections offered by the VRA. This decision allows jurisdictions with a history of voter disenfranchisement to alter voting laws without pre-emptive federal oversight.
Despite widespread fear of voter disenfranchisement following Shelby, the existing literature suggests that Shelby’s immediate effects might not be as dire as initially anticipated. The general consensus from previous research is that post-Shelby minority voting behavior, specifically registration and turnout, has not significantly changed (the exception being Morris and Miller Reference Morris and Miller2024). However, solely focusing on registration and turnout might be an overly narrow way of viewing the scope of protections offered by Sections 4 and 5. Justice O’Connor, writing for the majority opinion in Shaw v. Reno (1993), acknowledged that the Act made significant progress in dismantling voting barriers, but because discriminators are quick to find new ways to discriminate, practices evolved into voter dilution (Charles and Fuentes-Rohwer Reference Charles and Fuentes-Rohwer2018).
To fully understand the impact of the Shelby decision on minority voting rights, I argue that we must shift our focus to its implications for minority voters’ ability to elect their preferred candidate. In this note, I explore how Shelby impacts Latino descriptive representation using individual-level data from the National Association of Latino Elected Officials directory. I leverage this data to measure the number of Latino elected officials within a county from 2000 to 2021 and use a difference-in-difference (DiD) design to estimate the effect of Shelby on Latino representation. I find that the Shelby decision ultimately reduced the number of Latino elected officials in previously protected counties. Given these results, I argue that scholars looking to understand how policy affects minority voting rights should consider the full range of protections.
Background
The Fifteenth Amendment, ratified February 3rd, 1870, prohibits federal and state governments from denying a citizen’s right to vote based on their race, color, or previous condition of servitude. While this amendment provides racial minorities the right to vote, they still faced discriminatory barriers during the voting process. To address this disenfranchisement, the VRA was signed into law by President Lyndon B. Johnson in 1965 and codified that no person should be denied the right to vote because of their race or skin color. This legislation is widely regarded as the most impactful civil rights legislation in US history and remains a pivotal milestone in ensuring equal access to the ballot and representation.
The VRA offers voter protections through various provisions, but two key provisions of the Act are Sections 4 and 5. Section 5 requires that certain jurisdictions with a history of voter discrimination must receive approval from the federal government (preclearance) when altering voting laws. Congress intended Section 5 scrutiny to apply to “all changes, no matter how small,”Footnote 1 including changing polling place locations, statewide redistricting plans, and voter ID requirements. Jurisdictions subjected to Section 5 oversight were required to bring preclearance requests to the Department of Justice (DOJ) or the U.S. District Court for the District of Columbia, which could deny preclearance requests if the proposed change might have racially discriminatory effects. Section 4(b) of the VRA contained the coverage formula that determined which states or counties would be covered Footnote 2 by Section 5. Initially, the formula in Section 4 was based on the 1964 election, extending coverage to jurisdictions that used a “test or device” for voting and had less than 50% of voting-age citizens registered or turnout.
Based on the original formula, the provisions largely applied to jurisdictions in Southern states but underwent several changes leading up to the Shelby decision. The 1975 renewal of the VRA expanded its protections to include language minorities across multiple states, based on substantial evidence of discrimination against voters of Mexican descent in Texas (Tucker Reference Tucker2009a, 65). Congress voted to extend the coverage formula through Section 4(f)4 provided if a state or political subdivision meets three criteria: (1) more than 5% of the citizens voting-age population are members of a single language minority in 1972; (2) fewer than 50% of the voting-age citizens were registered to vote or less than 50% voted in the 1972 presidential election; and (3) the jurisdiction used English-only election material in 1972 (Hunter Reference Hunter1976). These special provisions extended preclearance coverage to jurisdictions Footnote 3 with a significant Latino presence but not covered through the original Section 4 formula.
In April 2010, Shelby County, Alabama, challenged the VRA’s preclearance clause in a lawsuit against the Justice Department, claiming Sections 5 and 4(b) were unconstitutional. In a 5–4 decision, the Supreme Court held that Section 4(b), the formula used to determine which jurisdictions were covered, was outdated, and, therefore, unconstitutional. Chief Justice John G. Roberts, Jr. wrote that Section 4 imposed burdens no longer responsive to the current conditions in the voting districts in question. Justice Clarence Thomas wrote that discrimination against minority voters in 1965 was no longer evident. In her dissent, Justice Ruth Bader Ginsburg argued that discrimination and racial disparities had not disappeared, and continuation of Section 5 was necessary to guard against retrogression. Footnote 4 Since the formula used to determine which jurisdictions were covered was unconstitutional, Section 5 became unenforceable. Therefore, previously covered jurisdictions were no longer required to gain preclearance before changing election-related laws.
Motivation
Voting Rights in the Post-Shelby Landscape
After the Shelby decision, previously covered jurisdictions swiftly moved to implement voting changes that would have previously been blocked by federal oversight (Brennan Center for Justice 2023). Studies examining Shelby’s impact emphasize changes to ballot access and minority registration and turnout.
Raze (Reference Raze2022) finds no discernible impact on the Black–white turnout gap in partially and fully covered states compared to uncovered states by using validated turnout data from the Cooperative Congressional Election Study to estimate state-level effects. However, previous studies have raised concerns about identifying the effects of Shelby at the state level because election administration is highly decentralized. Federal and state laws mainly provide guidelines to local election officials, but routine decisions are made by county or municipal-level officials (Miller and Morris Reference Morris and Miller2024). Several studies address these concerns by analyzing the effects of Shelby at the county level, but the results remain mixed.
De Rienzo, Jr. (Reference De Rienzo2022), using a sample of eligible voters from the Current Population Survey, finds that Shelby is associated with a slight decrease in turnout post-Shelby for all racial groups but more pronounced effects for Black-eligible voters. Moreover, De Rienzo, Jr. (Reference De Rienzo2022) analyzes how Shelby has influenced issues pertaining to ballot access, such as polling location convenience, registration, and election-day barriers, but does not find substantial evidence that Shelby resulted in these ballot access issues becoming more burdensome after Shelby. However, Komisarchik and White (2025) find that previously covered states adopted strict voter ID requirements and covered counties removed substantially more voters from the voter rolls than those unaffected by Shelby. They also report that the racial gap in turnout and the Democratic vote share largely remained the same, unlike Morris and Miller (Reference Morris and Miller2024), who find that the turnout gap increases in previously covered and uncovered counties using individual-level administrative voter files.
Partially covered states offer a unique opportunity to explore Shelby’s effect by comparing covered counties to uncovered counties while controlling for state-level characteristics. Exploiting these determinations, Gibson (Reference Gibson2020) estimates turnout from statewide elections in North Carolina, where 40 of the 100 counties were individually bailed-in and covered by Section 5. The author finds that there was no substantial difference between turnout across covered and uncovered counties in elections before (2010 and 2012) or after (2014 and 2016) Shelby. Moreover, the results suggest no significant difference in turnout among the population of voting-age citizens of whites, non-whites, blacks, or Hispanics.
The general consensus of this work is that the effects of Shelby may not be as dire as initially anticipated. But does this work too narrowly focus on vote denial by primarily focusing on changes to minority registration and turnout? I argue that, given the scope of preclearance protections, the focus must shift away from vote denial to vote dilution.
Why Representation?
The purpose of Section 5 was to ensure that no voting procedure would lead to a retrogressive dilution of racial minority voting power. Footnote 5 Voter dilution claims often arise in contexts of racial polarization, where white voters and minority voters consistently prefer different candidates. When racial polarization is present, it is possible to exploit this voting pattern to undermine the political power of minority group members, even when all voters have an equal opportunity to cast their votes (Gerken Reference Gerken2001).
Vote dilution occurs when electoral arrangements reduce the ability of minority groups to translate votes into representation. Unlike electoral procedures that deny access to the ballot, vote dilution allows participation but diminishes the voting power of the overall minority group. Common mechanisms that lead to vote dilution include at-large election schemes, municipal annexation, and racial gerrymandering.
Cities in the U.S. generally elect their councils using either single-member districts or at-large systems. Single-member districts divide a municipality into geographical constituencies, each electing one representative. By contrast, at-large elections require all candidates to run citywide, meaning the majority can win most, if not all, seats. In racially polarized settings, this scheme dilutes minority votes and is consistently associated with lower descriptive representation for Black and Latino voters (Berry and Dye Reference Berry and Dye1979; Collingwood and Long Reference Collingwood and Long2021; Trounstine and Valdini Reference Trounstine and Valdini2008; Welch Reference Welch1990). Municipal annexation similarly alters the composition of the electorate. By expanding city boundaries to incorporate predominantly white surrounding areas, annexation reduces the electoral strength of minority communities and contributes to their underrepresentation in local government. Evidence is mixed on whether or not municipal annexation significantly changed post-Shelby, but Section 5 cities did annex predominantly Black neighborhoods at higher rates than non-covered cities before 2013 (Durst Reference Durst2019; Zhang Reference Zhang2024).
Redistricting, though required every decade to reflect population shifts, allows states to redraw district maps in favor of certain candidates or political parties. States redraw congressional and state legislative districts, but it also occurs locally for county commissions, city councils, and school boards. Maps can dilute minority voting power through “cracking” and “packing.” Cracking spreads minority voters across districts, making it impossible for minority voters to elect their preferred candidate. Packing concentrates minority voters into a few districts, wasting votes in non-competitive elections. Post-Shelby, Section 5 jurisdictions no longer need federal approval for new maps. Section 2 prohibits racial discrimination, but in Rucho v. Common Clause (2019), the Court ruled partisan gerrymandering claims are outside the scope of its power. Since it is difficult to disentangle race from partisanship, it allows states to defend racially discriminatory maps by claiming lawful partisanship rather than on the basis of race.
Under preclearance, jurisdictions had to demonstrate that proposed election changes would not have discriminatory effects. As articulated in Beer v. United States (1976), such effects were defined as “a retrogression in the position of racial minorities with respect to their effective exercise of the electoral franchise.” Operationally, this meant that federal authorities blocked changes that would reduce minority voters’ opportunities to elect their candidates of choice (Shuit and Rogowski Reference Schuit and Rogowski2017).
Theoretical Expectation for Latino Descriptive Representation
In this note, I examine Shelby’s impact on Latino voters’ ability to elect their preferred candidate through Latino descriptive representation. Descriptive representation occurs when a representative shares ascriptive traits with their constituents, and research demonstrates that it improves political outcomes for minority voters (Bobo and Gilliam Reference Bobo and Gilliam1990; Canon Reference Canon1999; Gay Reference Gay2001; Gilliam Reference Gilliam1996; Hero and Tolbert Reference Hero and Tolbert1995; Mansbridge Reference Mansbridge1999; Pantoja and Segura Reference Pantoja and Segura2003).
Although the Latino vote is not a monolith (Ocampo and Ocampo Reference Ocampo and Ocampo2020), descriptive representation is important to Latino voters (Casellas and Wallace Reference Casellas and Wallace2015). A shared identity between voters and candidates also provides key political cues to minority voters (Gay et al. Reference Gay, Hochschild and White2016; McConnaughy et al. Reference McConnaughy, White, Leal and Casellas2010). For Latino voters, specifically, these cues occur because voters see ethnicity as an indicator for structuring values, opinions, and attitudes, and group members perceive an additional benefit in voting for co-ethnic candidates (Barreto Reference Barreto2007; Leighley Reference Leighley2001). In addition to providing political cues, co-ethnic candidates are often considered a mobilizing influence on Latino voters (Barreto et al. Reference Barreto, Villarreal and Woods2005; Barreto Reference Barreto2007).
The Latino population also has specific characteristics that suggest the group can mobilize and participate effectively to elect their preferred candidates. Latino voters are the second-largest group of voting-age Americans, and the 2020 election marked the first time in U.S. history that Latinos made up the largest ethno-racial minority group in the electorate (Ocampo et al. Reference Ocampo, Garcia-Rios and Gutierrez2021). Latino elected officials in Congress have seen large and steady growth since the 1950s, suggesting that Latino voters are influential in U.S. elections (Phan Reference Phan2024). However, the ability of historically marginalized groups to effectively translate votes into legislative seats depends on state and local electoral policies (Marschall and Rutherford Reference Marschall and Rutherford2016).
Evidence suggests that preclearance effectively protected minority voting rights (Fraga and Ocampo Reference Fraga and Ocampo2007; Grofman and Handley Reference Grofman and Handley1991; Lublin Reference Lublin1997; Marschall and Rutherford Reference Marschall and Rutherford2016; Shah et al. Reference Shah, Marschall and Ruhil2013; Shuit and Rogowski Reference Schuit and Rogowski2017). After Shelby, previously covered jurisdictions quickly implemented new voting procedures, some of which courts later struck down as racially discriminatory. Yet even as litigation blocked certain changes, the Supreme Court has continued to narrow the scope of the VRA. In Brnovich v. Democratic National Committee (2021), the Supreme Court made it more difficult to challenge discriminatory voting laws under Section 2, and in Alexander v. South Carolina Conference of the NAACP (2024), it further limited protections by presuming states legislatures act in “good faith” when redrawing maps. Together, these rulings have made it increasingly difficult for minority voters to seek and secure judicial relief.
In sum, Shelby changed the electoral decision-making process, making it easier to implement electoral schemes that dilute the Latino vote. I hypothesize that we will see the number of Latinos elected to office in counties previously subject to federal oversight decrease compared to counties unaffected by preclearance removal.
H1: Post-Shelby, the average change in previously covered jurisdictions of Latino descriptive representation will be greater than in non-covered jurisdictions.
Data and Methods
Measuring Latino Descriptive Representation
To measure Latino descriptive representation, I use the NALEO directory of Latino elected officials. This data includes all federal, state, and local Latino elected officials between 2000 and 2021, providing individual-level information such as office level, title, and district.
I measure descriptive representation as the number of Latino elected officials Footnote 6 within a county-year. Studies of minority representation have moved away from using a proportion between the number of elected officials and population size because it assumes that minority representation and the probability of winning a seat are linearly related (Marschall et al. Reference Marschall, Ruhil and Shah2010; Marschall and Rutherford Reference Marschall and Rutherford2016). Instead, scholars measure representation as a count to account for the nonlinear relationship between Latino voting strength and Latino descriptive representation (Sass and Pittman Reference Sass and Pittman2000; Shah et al. Reference Shah, Marschall and Ruhil2013).
The literature on minority representation raises another concern, arguing that minority representation is a two-step process dependent on a group’s ability to elect the first co-ethnic candidate (Marschall et al. Reference Marschall, Ruhil and Shah2010). During the first stage of representation, an unrepresented group must overcome the challenge of electing the first minority representative. This depends on the minority group’s ability to garner enough votes to elect a co-ethnic candidate. Recognizing this, the analysis only includes counties that have overcome or can overcome this hurdle. A county is considered to have met these requirements if the county elected at least one Latino representative during the 2000–2021 period and/or the Latino population is large enough to garner enough votes to translate into elected seats (Marschall and Rutherford Reference Marschall and Rutherford2016). Counties failing to meet these requirements are dropped from the analysis.
Model and Model Specifications
Difference-in-difference (DiD) is a popular econometric method in policy analysis that estimates the effect of a specific policy intervention by comparing the set of units that are affected (treatment) to those that are not (control). The underlying logic is that if the intervention had not occurred, the difference between the treatment and control group should stay the same over time. However, this estimation strategy is predicated on satisfying the parallel trends assumption, Footnote 7 implying that selection effects can be adequately controlled (Arkhangelsky et al. Reference Arkhangelsky, Athey, Hirshberg, Imbens and Wager2021).
Recent advances in DiD estimation incorporate features of the Synthetic Control (SC) method to allow more flexibility of the parallel trends assumption (Arkhangelsky et al. Reference Arkhangelsky, Athey, Hirshberg, Imbens and Wager2021). Synthetic Difference-in-Difference (SDiD) combines the generalized DiD and SC methods to allow multiple treated units, combining unit-specific weights with time weights Footnote 8 to balance the pretreatment time trends of the average outcome with those in the posttreatment period (Malmberg Reference Malmberg2025). The time weights draw more weight from the pretreatment periods that are more similar in the posttreatment period. The unit weights ensure that the comparison between control and treated units approximately follows parallel trends before the intervention. Together, these weights make DiD more plausible and robust even in cases where the parallel trends assumption might not be satisfied (Arkhangelsky et al. Reference Arkhangelsky, Athey, Hirshberg, Imbens and Wager2021).
Conditioning on Covariates
Covariate adjustment in SDiD is used as a pre-processing task to remove the time-variant trends of covariates from the outcome of interest (Clarke et al. Reference Clarke, Pailañir, Athey and Imbens2023). This pre-processing task ensures that these covariates closely match across treated and SC units by conditioning out these variables before calculating the SC. I use estimates from the 5-year American Community Survey (ACS) to control for the electoral environment of counties in the treatment and control groups. These estimates include the logged population, the share of the population that is non-Hispanic white, the percent Black, the percent foreign born, and those who hold a bachelor’s degree or higher. By leveraging data from the MIT Election Data and Science Lab, I include the Republican vote share in each county in all Presidential elections from 2000 to 2020. Lastly, I include an indicator identifying which counties were covered under Section 203, based on determinations made between 1992 and 2021. Figure 1 illustrates the pre-treatment trends for treated and control units in the synthetic difference-in-differences model after applying unit and time weights.
Parallel trends plot. Note: The solid red line plots the observed outcome for treated units, while the dashed blue line plots the observed outcome for control units. The vertical dashed line marks the onset of treatment. The size and shape of the green triangle at the bottom represent the weighting structure, with height corresponding to the relative weight assigned to pretreatment periods in constructing the synthetic control units. The y-axis represents the number of Latino elected officials in a county.

Results
In this section, I compare the SDiD results to a standard DiD model that estimates Shelby’s effects on the number of Latino elected officials using a two-way fixed effects (TWFE) model. Under the simplest setting, where there are two groups and one treatment period, the DiD estimator is numerically equivalent to the TWFE estimator after controlling for the same unit-level characteristics if the parallel trends assumption is satisfied (Wing et al. Reference Wing, Kosali and Bello-Gomez2018).
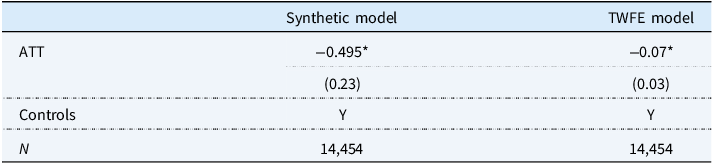
Table 1 reports the estimates from two models. Counties are coded as treated if they were covered Footnote 9 by Section 5, either through state- or county-level coverage. The SDiD indicates a moderate reduction in the average number of Latino elected officials in covered counties relative to uncovered ones (ATT = –0.495), while the TWFE model shows that after Shelby, counties experienced approximately a 7% decrease in the expected number of Latino representatives, relative to non-Shelby counties. Taken together, the models suggest that the Shelby decision dampened previous gains (Fraga and Ocampo Reference Fraga and Ocampo2007; Grofman and Handley Reference Grofman and Handley1991; Lublin Reference Lublin1997; Marschall and Rutherford Reference Marschall and Rutherford2016; Shah et al. Reference Shah, Marschall and Ruhil2013; Shuit and Rogowski Reference Schuit and Rogowski2017) in Latino representation, with statistically significant effects across specifications.
Difference-in-difference modeling effects of Shelby on county LEO

* p < 0.05.
Note: Standard errors in parenthesis. SDiD uses bootstrap variance estimation. TWFE model is estimated using a Poisson distribution. I exclude Connecticut because the state switched from counties to planning regions during the analysis period.
Conclusion
The Shelby decision ultimately weakened the VRA by ending the preclearance process for political jurisdictions with a history of racially disenfranchising certain groups of voters. Previous work dedicated to understanding the effect of this Supreme Court decision on minority voting rights suggests that the impact on minority registration rates and turnout is not as dire as anticipated (Gibson Reference Gibson2020; Raze Reference Raze2022; De Rienzo, Jr. Reference De Rienzo2022), apart from Miller and Morris (Reference Morris and Miller2024). In this study, I argue that past work views Shelby’s implications through a lens that is too narrow, given the range of protections offered by Section 2 and enforced through Section 5. I leverage individual data on Latino elected officials over time to examine the impact of the Shelby decision on Latino descriptive representation using two DiD models and find that Shelby is associated with a decrease in the number of Latino elected officials. Given these results, voting rights scholars need to look beyond registration and turnout when considering policy impacts on minority voting rights.
Acknowledgments
I would like to thank the anonymous reviewers for their helpful feedback. I am grateful to the participants at the 2025 Southern Political Science Conference for their valuable feedback and to the discussants for their careful engagement and constructive suggestions, which helped improve this article. In particular, I want to thank Peter Miller at the Brennan Center for Justice for his expertise and for reviewing this manuscript in its early stages. Finally, I want to thank my advisor, Rene Rocha, for his constant support, encouragement, and mentorship in the development of this project.
Competing interests
None.
Appendix A.
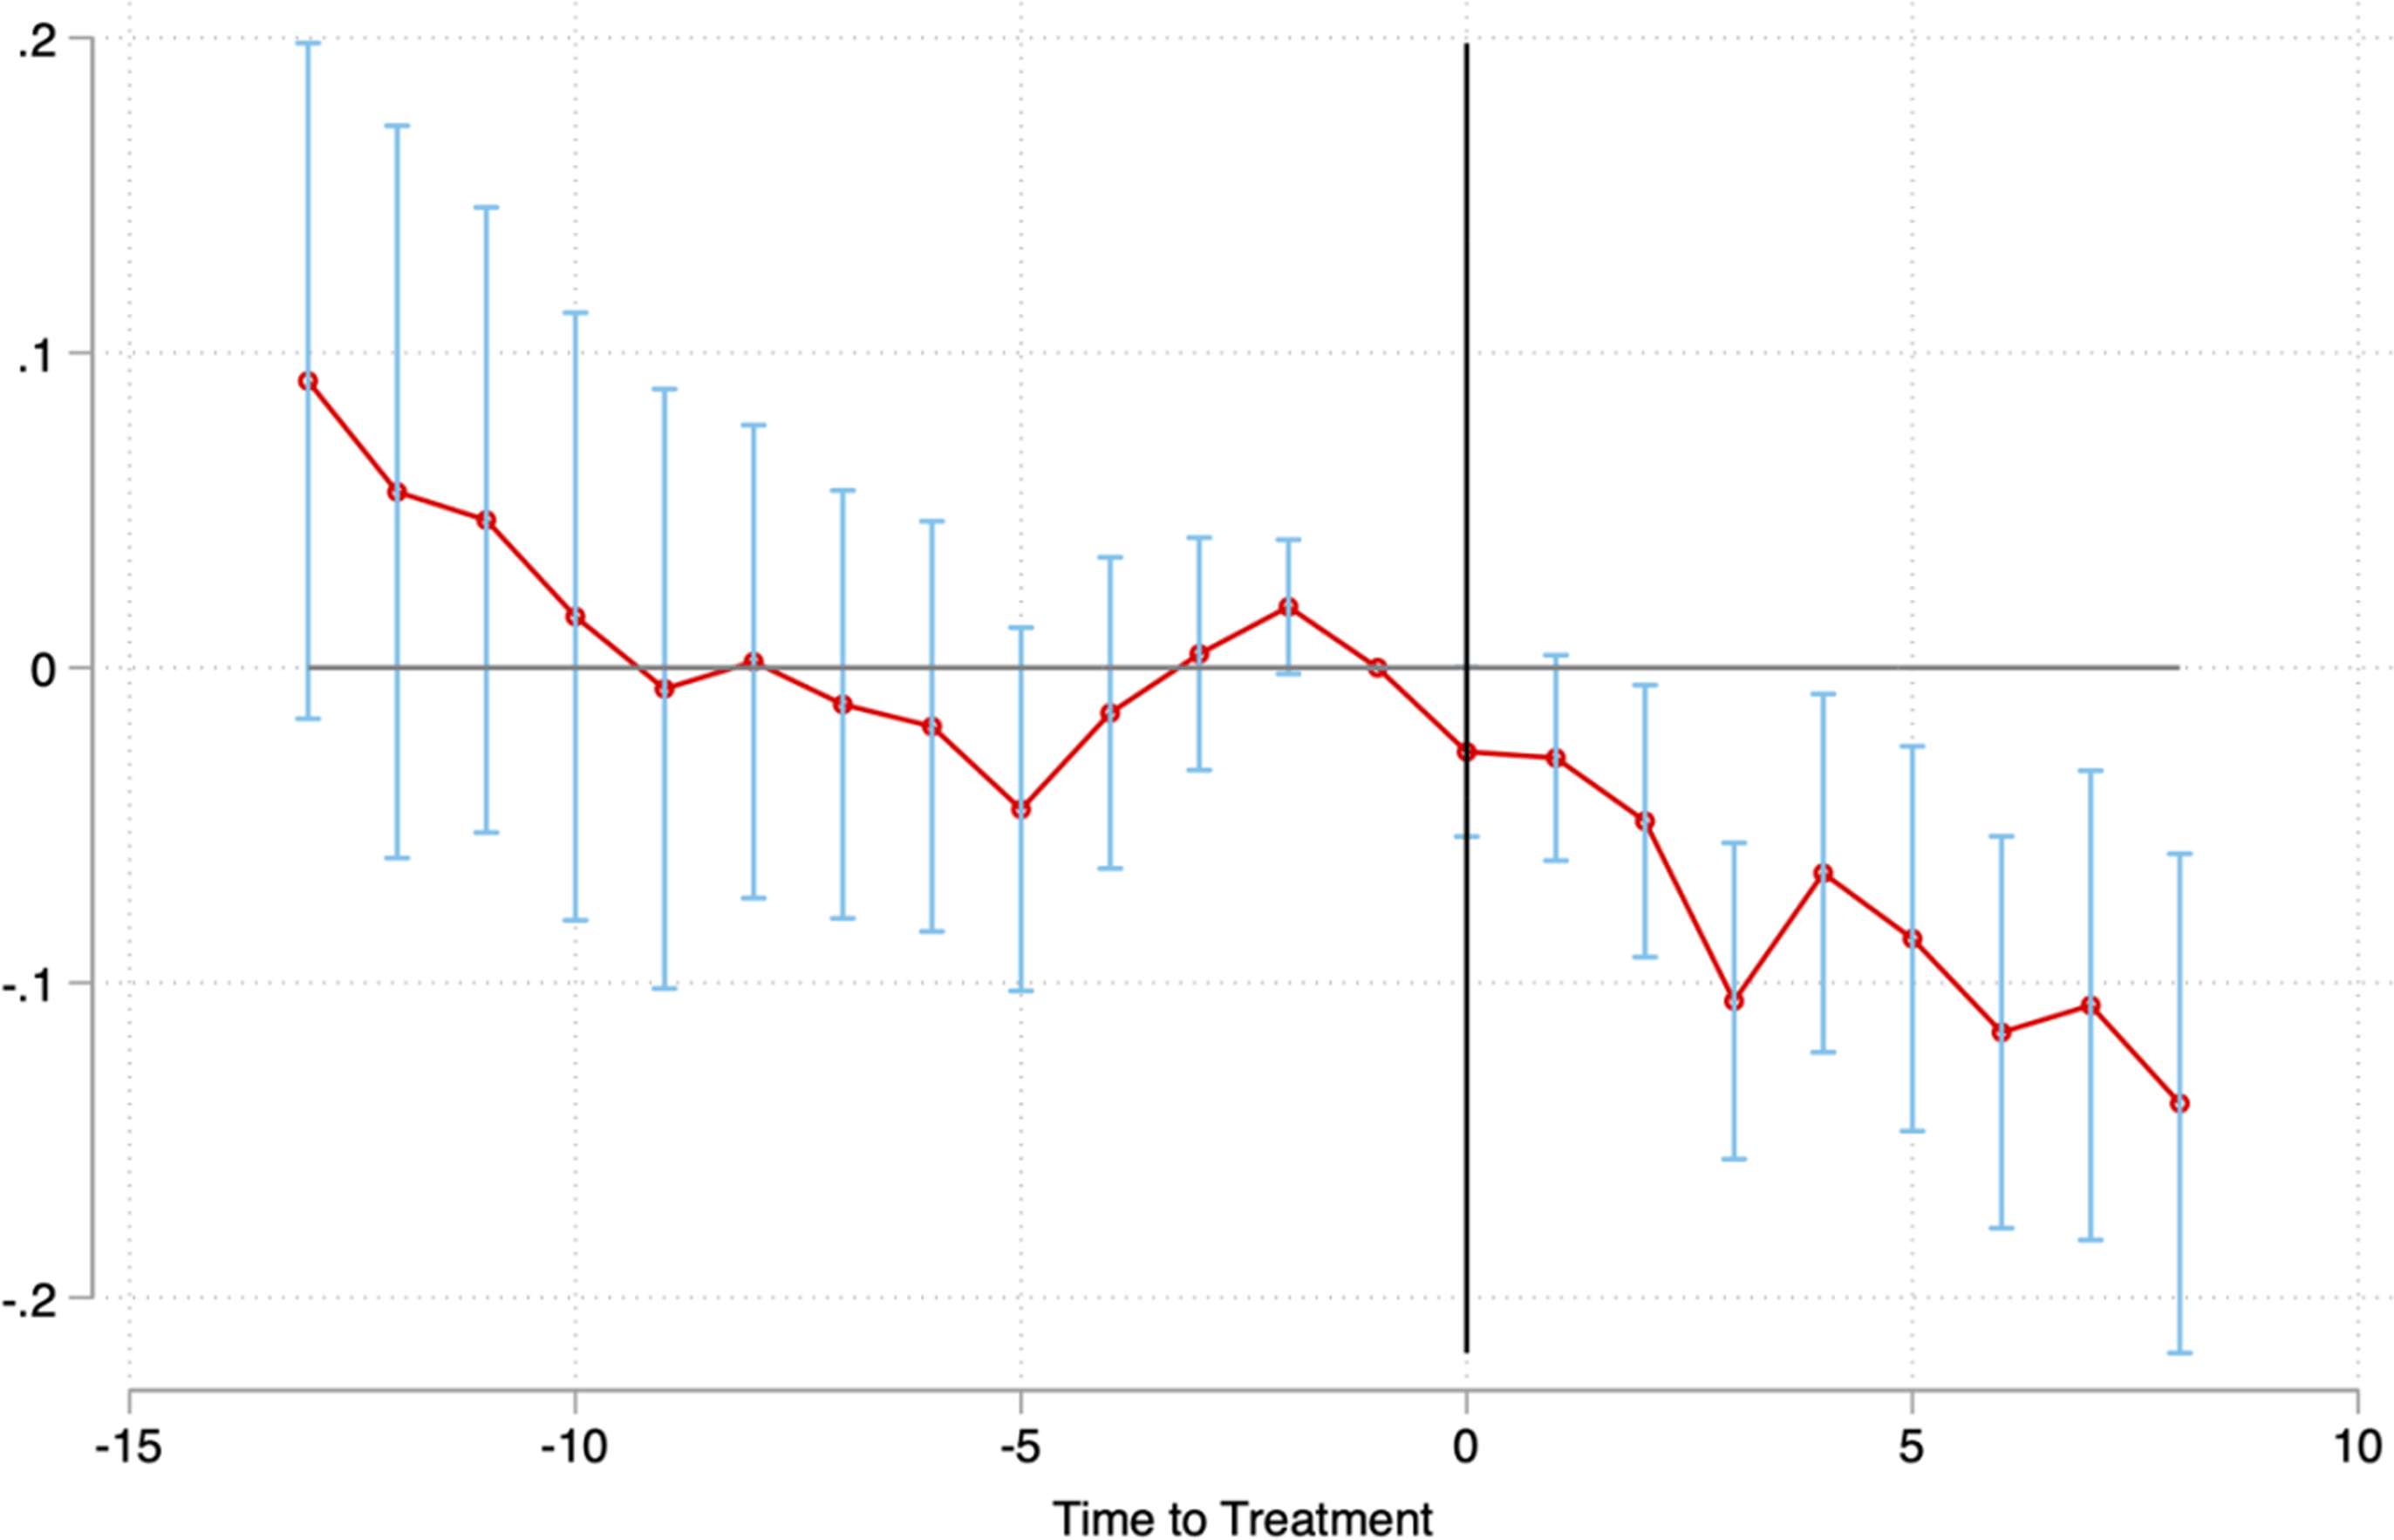
See Figure 2.
Event study plot. Note: The plot provides the difference in mean values between covered and uncovered counties for the TWFE model. The x-line represents the Shelby decision. The blue lines represent the 95% confidence intervals and the red line shows the mean value trend.

Appendix B.
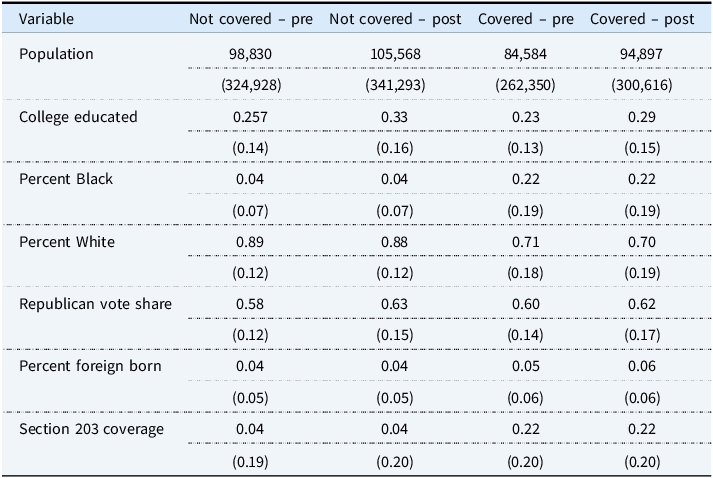
See Table 2.
Summary statistics of control variables (non-weighted)

Note: The table provides the mean value for each group for the controls used to match treated and non-treated units for the SDiD model. Section 203 coverage is coded 1/0 and reported as means (proportions). Standard errors are in parenthesis.


 Open access

