Metabolic syndrome (MetS) is a cluster of conditions that increase the risk of CVD, type 2 diabetes and all-cause mortality(Reference Morvaridi, Rayyani and Jaafari1,Reference Karimi, Gholizadeh and Abdolahi2) . With the global rise in the prevalence of sedentary lifestyles and obesity, MetS has become a significant public health concern(Reference Jemal, Girum and Kedir3). The syndrome encompasses central obesity, insulin resistance, dyslipidaemia and hypertension, affecting approximately 25 % of the global adult population(Reference Morvaridi, Rayyani and Jaafari1,Reference Jemal, Girum and Kedir3) . Despite advances in understanding MetS pathophysiology, effective prevention and treatment strategies remain limited, highlighting the need for novel therapeutic approaches.
Recent research has increasingly focused on the potential role of ketone bodies, particularly β-hydroxybutyrate (BHB), in metabolic health regulation(Reference Qi, Gan and Fang4,Reference Lopaschuk and Dyck5) . BHB, the most abundant ketone body in human blood, is primarily produced in the liver from fatty acids during periods of fasting or carbohydrate (CHO) restriction(Reference Park, Zhang and Wu6,Reference Park, Kim and Kang7) . While ketosis has traditionally been associated with pathological states, mounting evidence suggests that mild physiological ketosis may confer metabolic benefits. Several studies have demonstrated associations between elevated BHB levels and improved glucose homoeostasis, enhanced lipid profiles and reduced inflammatory markers(Reference Hur, Wu and Yang8). BHB functions not only as an alternative energy substrate but also as a signalling molecule that modulates cellular processes through inhibition of histone deacetylases and suppression of inflammatory pathways(Reference Park, Kim and Daily9,Reference Madhavan and Stubbs10) .
However, significant research gaps remain in understanding the relationship between endogenous BHB levels and MetS risk. First, the association between BHB and MetS has not been systematically examined in large population-based studies. Second, the genetic architecture underlying ketone metabolism and its relationship with MetS components remains poorly characterised. While genome-wide association studies (GWAS) have identified numerous SNP associated with individual MetS components(Reference Zhou, Song and Park11,Reference Park, Kim and Kang12) , limited research has examined genetic determinants of BHB levels specifically. Third, the complex interplay between genetic predisposition, lifestyle factors and ketone metabolism for MetS risk has not been systematically investigated.
Lifestyle factors, particularly dietary patterns and physical activity, significantly influence both ketone production and MetS risk. While restrictive ketogenic diets can effectively induce ketosis, their long-term sustainability and population-level applicability remain questionable. Recent evidence suggests that specific dietary patterns, even those with moderate CHO content, may promote mild ketosis when combined with appropriate food quality and timing(Reference Morvaridi, Rayyani and Jaafari1,Reference Hur, Wu and Yang8,Reference Keshavarz, Rahimlou and Farjam13) . However, comprehensive analyses of how various lifestyle factors interact with genetic predisposition to influence BHB levels and subsequent MetS risk are lacking.
Therefore, the present study aimed to investigate the complex relationships between mild ketosis, MetS, lifestyle factors and genetic variants using the UK Biobank dataset. We hypothesised that elevated BHB levels would be inversely associated with MetS prevalence, that genetic variants influencing ketone metabolism would modulate both BHB levels and MetS risk and that dietary patterns emphasising healthy fats and moderate CHO intake would interact with genetic predisposition to enhance BHB levels with differential protective effects against MetS. We further hypothesised that individuals with favourable genetic variants would demonstrate stronger associations between ketosis-promoting lifestyle factors and metabolic protection. Specific objectives were to (1) characterise associations between serum BHB levels and MetS prevalence and components, (2) identify genetic variants associated with BHB levels and develop a polygenic risk score (PRS), (3) investigate genetic–environment interactions between genetics, dietary patterns and lifestyle factors on BHB levels and MetS risk and (4) explore clinical implications for personalised interventions targeting ketone metabolism for MetS prevention and management.
Subjects and methods
General and lifestyle data of participants
This study utilised data from the UKBB, a large-scale prospective cohort study with 502 536 participants aged 40–69 years, recruited from across the UK between 2006 and 2010. The flow chart for selecting the participants is presented in online Supplementary Figure S1. We included 269 178 participants who measured serum BHB levels by NMR in the initial recruitment. The sample size (n 269 188) was sufficient to satisfy significance at α = 0·05 and β = 0·99 at an OR of 1·02 while calculating the sample size using a G-power calculator (G*power Software, the University of Dusseldorf). This research was conducted using the UKBB resource under application no. 154356. All clinical investigations were conducted according to the principles expressed in the Declaration of Helsinki as revised in 2013. Ethical approval for the UK Biobank study was granted by the North West Multi-Center Research Ethics Committee (11/NW/0382) and Hoseo University (1041231-240820-BR-183-01). All participants provided written informed consent.
Complete information on demographic, lifestyle, dietary and metabolic parameters, as well as genotyping data, was available for all included participants. For further analysis, the education levels of the participants were categorised into three groups: low (no qualifications, Certificate of Secondary Education (CSE) or General Certificate of Secondary Education (GCSE); basic school-leaving qualifications at 16 years of age), intermediate (A levels or equivalent, and other professional qualifications; pre-university qualifications, typically at 18 years of age) and high (college or university degree). Annual income levels were similarly divided into three categories: low (> £18 000), middle (£18 000–£51 999) and high (≥ £52 000).
Body weight, height, waist circumference, body fat and blood pressure were measured according to specifications in the UKBB manual. Blood biochemistry parameters including glucose, HbA1c, lipid profiles and WBC were also assessed in designated analysis centres according to the UKBB manual. Participants reported their consumption of various alcoholic beverages, including beer, wine, champagne and spirits. Alcohol intake was quantified in units of alcohol per week, with one unit equivalent to 10 ml (8 g) of pure alcohol. Alcohol consumption was calculated based on standard conversion factors: 1 pint of beer/cider equals 2·0 units, 1 glass of red wine equals 2·3 units, 1 glass of white wine/champagne equals 2·0 units and 1 measure of spirits equals 1·0 units. Smoking status was provided as non-smokers, former smokers (not smoking for the last 6 months) and current smokers. Physical activity was assessed using self-reported data on the frequency and duration of mild (walking), moderate and vigorous physical activities. Total physical activity was expressed in metabolic equivalent of task (MET)-minutes per week. Walking was assigned a MET value of 3·3, moderate activities a MET of 4·0 and vigorous activities a MET of 8·0. The total MET minutes per week were calculated by multiplying the time spent on each activity by its respective MET value and summing these across activities.
Measurement of serum ketone bodies
Serum concentrations of BHB, acetoacetate and acetone were measured using NMR spectroscopy as part of the UK Biobank’s standard metabolomic profiling, with concentrations quantified in millimolar (mM) units. The NMR-based method provides precise and high-throughput quantification (a detection limit of 0·01 mM) of these ketone bodies as part of the broad metabolic profile measurement(Reference Julkunen, Cichońska and Tiainen14).
Categorisation of the ketone body status using serum β-hydroxybutyrate concentrations and metabolic syndrome
Participants were categorised into low-BHB (< 0·12 mM) and high-BHB (≥ 0·12 mM) groups. The 0·12 mM cut-off was selected based on established ketone physiology, where healthy individuals typically exhibit fasting BHB levels of 0·05–0·10 mM under normal metabolic conditions(Reference Hirschberger, Effinger and Yoncheva15). This threshold represents the upper boundary of normal physiological baseline levels, distinguishing standard fasting ketone production from mild physiological ketosis. The cut-off is substantially lower than clinical thresholds used for nutritional ketosis (≥ 0·5 mM) or therapeutic ketosis (≥ 1·0–3·0 mM), reflecting our focus on investigating metabolic effects of subtle BHB elevations within the physiological range rather than pharmacological ketosis(Reference Qi, Gan and Fang4,Reference Evans, Cogan and Egan16) . The 0·12 mM cut-off corresponded to approximately the 10th percentile of our study population, ensuring adequate sample sizes for statistical analysis while capturing individuals with endogenous BHB levels at the higher end of the normal spectrum. This percentile-based approach is particularly appropriate for population-based studies examining naturally occurring variations in ketone metabolism.
According to the Adult Treatment Panel III (ATP III), the expert panel set up under the aegis of the National Cholesterol Education Program (NCEP), a diagnosis of MetS is confirmed when an individual meets at least three of five specified criteria(Reference Huang17). The five criteria have been defined as follows: abdominal obesity is defined by a waist circumference of ≥ 102 cm for men and ≥ 88 cm for women. For Asians, waist circumferences to define abdominal obesity are ≥ 95 cm for men and ≥ 85 cm for women. Elevated TAG are defined as serum TAG levels ≥ 150 mg/dl (1·7 mmol/l) or treatment being received for elevated TAG. Reduced HDL-cholesterol is defined as serum HDL-cholesterol levels < 40 mg/dl (1·03 mmol/l) for men and < 50 mg/dl (1·29 mmol/l) for women, or treatment being received for low HDL-cholesterol. Diagnosis of elevated blood pressure is made if systolic blood pressure is ≥ 130 mmHg, diastolic blood pressure is ≥ 85 mmHg or if the individual is on antihypertensive medication. Finally, elevated fasting glucose is defined as ≥ 100 mg/dl (5·6 mmol/l) or receipt of treatment for elevated blood glucose levels.
Estimation of food intake using a semi-quantitative FFQ
Dietary intake was assessed using a semi-quantitative FFQ developed for the UK Biobank. Participants were asked to report their average weekly consumption frequency of each food item over the past year. The SQFFQ has been validated against 24-h dietary recalls by 42 % of SQFFQ participants and is considered reproducible and reliable for large-scale epidemiological studies(Reference Carter, Lewington and Piernas18). Nutrient intake, including total energy, macronutrients (CHO, fats and proteins) and key micronutrients, was calculated using standard nutrient composition tables.
For dietary pattern analysis, thirty-three predefined food groups were created based on the nutritional content and culinary usage of individual food items. Principal component analysis was conducted on energy-adjusted food group intakes (using the residual method) to derive dietary patterns. Components with eigenvalues ≥ 1·5 were retained to capture patterns explaining more variance than would be expected by chance while avoiding over-extraction of components, as this threshold is commonly used in nutritional epidemiology for dietary pattern analysis(Reference Yong, Mohd Shariff and Mohd Yusof19). Varimax rotation was applied to improve interpretability. Food groups with absolute factor loadings ≥ 0·4 were considered key contributors to each pattern (online Supplementary Table S1).
Dietary patterns were named based on their predominant food group characteristics, resulting in three major patterns: plant-based dietary pattern (characterised by high loadings for vegetables, fruits and fish; PBD), meat-based dietary pattern (characterised by high loadings for various meat products; MBD) and coffee-preferring dietary pattern (characterised by high coffee consumption and low tea consumption: HCD). Individual dietary pattern scores were calculated for each participant by summing intakes weighted by factor loadings. Participants were categorised into quartiles, with high adherence further defined using the 75th percentile cut-off. Additionally, composite intakes were calculated for CHO-rich foods (cereals, breads, fresh and dried fruits), fat-rich foods (oily fish, beef, pork, chicken, lamb, processed meats and cheese) and vegetables (raw and cooked).
Genotyping and quality control
Genotyping was performed using the UKBB Axiom Array or the UK BiLEVE array, both of which capture a broad range of common genetic variants(Reference Bycroft, Freeman and Petkova20). Quality control procedures included the removal of individuals with a high proportion of missing genotype data, related individuals and participants with sex mismatches. SNP were excluded if they had a minor allele frequency of < 1 %, a Hardy–Weinberg equilibrium (HWE) P-value of < 0·05 or a genotyping call rate of < 95 %. After quality control, imputation was conducted using the Haplotype Reference Consortium reference panel.
Genome-wide association study
We conducted a GWAS to investigate the genetic determinants of serum BHB concentrations using UK Biobank data. The analysis was performed using PLINK2 (www.cog-genomics.org/plink/2.0/). We adjusted for potential confounders, including age, sex, educational attainment, ethnicity, dietary factors (grain and fruit intake), total energy intake, alcohol consumption, physical activity levels, smoking status and metabolic disease medication use including antihypertensive, antidiabetic, lipid-lowering and cardiovascular medications. The adjustment of medication use effectively controlled for participants with pre-existing CVD, diabetes and other metabolic conditions. The significance of these analyses was determined using a Bonferroni-corrected P-value < 5 × 10⁻⁸.
The quality of the GWAS results was assessed using Manhattan and Quantile-Quantile (Q–Q) plots. The genomic inflation factor (λ) was calculated to evaluate the potential population stratification, with a value close to 1·0 indicating minimal inflation. The SNP were filtered based on linkage disequilibrium to remove redundant genetic information. We used Haploview 4.2 integrated within PLINK to exclude SNP with high linkage disequilibrium (D’ < 0·3, r2 > 0·05). The locations of remaining genetic variants and corresponding gene names were found in g:profiler (https://biit.cs.ut.ee/gprofiler/snpense). We removed the genetic variants without annotated gene names.
Genetic interaction analysis by generalised multifactor dimensionality reduction
To identify genetic variants that interact to influence serum BHB levels, we employed the generalised multifactor dimensionality reduction (GMDR) method. GMDR is a statistical approach that can detect complex interactions between multiple genetic variants that may not be apparent when examining individual SNP alone(Reference Xu, Xu and Hou21). Unlike traditional linear regression methods that assume additive effects, GMDR can identify non-linear relationships where the combined effect of multiple genetic variants differs from the sum of their individual effects.
The GMDR method works by dividing participants into high-risk and low-risk groups based on their serum BHB levels, testing all possible combinations of genetic variants from 1-SNP to multi-SNP models, using cross-validation to evaluate how well each combination predicts BHB levels and selecting the model with the best predictive performance and statistical significance. We used GMDR software (version 1.0) to systematically evaluate interactions between the top-ranking SNP identified from our GWAS analysis. Models ranging from 1-SNP to 6-SNP combinations were tested. The optimal model was selected based on training balance accuracy > 0·55, test balance accuracy > 0·55, cross-validation consistency ≥ 9 out of ten cross-validation runs and statistical significance (P < 0·05) for the sign test.
Polygenic risk score calculation and validation
A PRS was constructed for each participant based on the six SNP identified in the best-performing GMDR interaction model. For each SNP, the risk allele was defined based on its association with BHB levels: the major allele was designated as the risk allele when its OR was less than 1 (OR < 1), and the minor allele was designated as the risk allele when its OR was greater than 1 (OR > 1).
To justify the selection of the 6-SNP PRS model, we compared its predictive performance with alternative models including individual SNP models and models with different SNP combinations. Discriminative performance was assessed using the area under the receiver operating characteristic curve with 95 % CI for predicting elevated BHB levels (≥ 0·12 mM). Logistic regression models adjusted for age, sex, BMI and lifestyle factors evaluated the association between different PRS models and high BHB risk.
The PRS was calculated as an unweighted sum of risk alleles. Each SNP contributed 0, 1 or 2 points to the total score, reflecting the number of risk alleles present (0 for no risk alleles, 1 for one risk allele and 2 for two risk alleles). We employed an unweighted approach because the effect sizes across the selected SNP were relatively similar when consistently oriented to reflect risk. The risk allele effect sizes ranged from 1·048 to 1·161 (mean = 1·083, sd = 0·044), indicating that no single variant had a disproportionately large effect that would warrant differential weighting. This approach is supported by previous studies demonstrating that unweighted PRS can perform comparably to weighted methods when individual SNP effects are of similar magnitude, particularly in exploratory analyses focused on capturing overall genetic liability rather than optimising predictive accuracy(Reference Torkamani, Wineinger and Topol22,Reference Choi, Mak and O’Reilly23) . Additionally, unweighted scores are more reliable and less susceptible to overfitting and winner’s curse bias that can affect weighted approaches in discovery datasets(Reference Dudbridge24).
The final PRS ranged from 0 to 12, with higher scores indicating a greater genetic predisposition to elevated serum BHB levels. Participants were stratified into three risk categories (low-PRS, medium-PRS and high-PRS) using tertiles, with thresholds determined to ensure adequate group sizes while maintaining biological interpretability. To validate the PRS performance, we examined the association between PRS categories and mean serum BHB levels, calculated the variance in BHB levels explained by the PRS using R2 and tested for linear trends across PRS categories using linear regression. The validated 6-SNP PRS was subsequently used in all analyses examining the cumulative genetic risk associated with serum BHB levels.
Functional analysis of genetic variants
To interpret the genetic variants associated with serum BHB concentrations, we used the Functional Mapping and Annotation of Genome-Wide Association Studies (FUMA) web application (https://fuma.ctglab.nl/). FUMA’s SNP2GENE process annotated our GWAS summary statistics, identifying significant SNP and mapping them to genes. We utilised Genotype-Tissue Expression (GTEx v8) data for gene expression analysis across fifty-four tissue types, including genes with an average read per kilobase per million (RPKM) mapped reads ≥ 1 in at least one tissue. The gene set and pathway analyses were performed using FUMA’s GENE2FUNC feature, assessing enrichment in predefined gene sets including Gene Ontology terms and Kyoto Encyclopedia of Genes and Genomes (KEGG) pathways. We also employed Multi-marker Analysis of GenoMic Annotation (MAGMA) for gene-based and gene-set analyses, accounting for linkage disequilibrium and gene size. Significance was determined using a Bonferroni-corrected P-value < 0·05. This approach elucidated the functional implications of our GWAS findings, including the tissue-specific effects and relevant biological pathways.
Sensitivity analysis
To evaluate the robustness of gene–environment interactions, we conducted sensitivity analyses using stratified random subsampling at 20 %, 40 %, 60 %, 80 % and 100 % of the total cohort. We examined the association between serum BHB levels (categorised by percentiles) and MetS risk across all sample fractions to evaluate the stability of the main effect (online Supplementary Figure S3). Additionally, for each subsample, we examined SNP–SNP interactions between the 6-SNP PRS and serum BHB levels across three PRS categories (low, middle and high). Heterogeneity between subsamples was assessed using Cochran’s Q test and I2 statistics. Both covariate adjustment models were applied to each subsample to ensure consistency.
Statistical analysis
All statistical analyses were performed using SAS version 9.4 (SAS Institute). Participants were included in the analysis only if they had measured serum BHB concentrations and complete genotype data. For statistical models, particularly the GWAS, missing values in independent variables (covariates) were handled through a complete-case approach (listwise deletion) within each SAS procedure. This ensured that only participants with complete data for all variables in a specific model were included in that analysis. The final analytical sample size for the GWAS was 269 178. While complete-case analysis maintains sample homogeneity for each model, it may potentially introduce bias if missingness is not entirely random; however, given our substantial remaining sample size, we expect this impact to be minimal.
For genetic analysis, the study population was stratified into three groups based on the 6-SNP PRS: low (≤ 5), medium (6–7) and high (≥ 8). To examine the distribution of categorical variables (such as sex, education levels and smoking status) across PRS categories, we employed χ 2 tests. For continuous variables, including age, serum BHB levels and energy intake, we utilised one-way ANOVA to compare means across PRS groups. We constructed two sequential models to systematically evaluate the independent effect of PRS while controlling for potential confounders. Model 1 adjusted for basic demographic covariates (age, sex, educational attainment, income and ethnicity) to establish the fundamental association between PRS and BHB levels. Model 2 additionally adjusted for lifestyle factors (grain and fruit intake, total energy intake, alcohol consumption, physical activity levels, smoking status and metabolic disease-related medication use) to determine whether the primary effects remained significant after accounting for modifiable risk factors.
In serum BHB and MetS analysis, participants were categorised into low-BHB and high-BHB groups based on serum BHB concentrations. The descriptive statistics for categorical variables were calculated to show frequency distributions, and statistical differences between low- and high-BHB levels were analysed using χ 2 tests. For continuous metabolic parameters, independent t tests were used to compare means between BHB groups. The association between serum BHB categories and MetS and its individual components was examined using logistic regression analysis with comprehensive confounder adjustment (Model 2) to isolate the independent effect of BHB status by controlling for potential confounding variables that could influence both BHB levels and metabolic outcomes.
In dietary intake and serum BHB analysis, the relationship between dietary patterns/nutrient intake and serum BHB categories was assessed using logistic regression analysis. We applied model 2 adjustments to exclude the confounding effects of demographic and lifestyle factors, thereby demonstrating the independent association between specific dietary components and BHB status while controlling for variables that could simultaneously influence both dietary choices and ketone production. This comprehensive adjustment approach was designed to exclude the influence of confounding variables and isolate the independent effects of the primary exposures (PRS, BHB status or dietary factors) on the outcomes of interest. By controlling for these potential confounders, we aimed to demonstrate that observed associations were not merely due to shared risk factors but represented genuine biological relationships.
To investigate the potential interactions between the PRS and lifestyle factors in influencing high serum BHB concentration, we employed a multivariate general linear model including the main effects of the PRS and lifestyle factors, their interaction effect, along with the model 2 covariates. When significant interactions were detected in the general linear model, we conducted stratified logistic regression analyses for more detailed examination of the interaction patterns. For stratified analyses, lifestyle parameters were dichotomised based on established thresholds or distribution-based cut-offs depending on the parameter type. Dietary pattern variables were dichotomised using the 75th percentile as the cut-off, with values ≥ 75th percentile classified as ‘high’ dietary pattern adherence. For other nutrients and lifestyle-related parameters, we used established recommended amounts or guidelines where available to define ‘adequate’ v. ‘inadequate’ categories.
For all analyses, we considered P-values ≤ 0·05 as statistically significant for main effects and other statistical analyses. Multiple testing corrections were applied as follows: Bonferroni correction with a significance threshold of P < 5 × 10⁻⁸ for GWAS analysis; P < 0·001 for GMDR interaction analysis to account for testing ten SNP combinations (combined with the cross-validation approach inherent in the GMDR method).
Results
Demographic and clinical characteristics
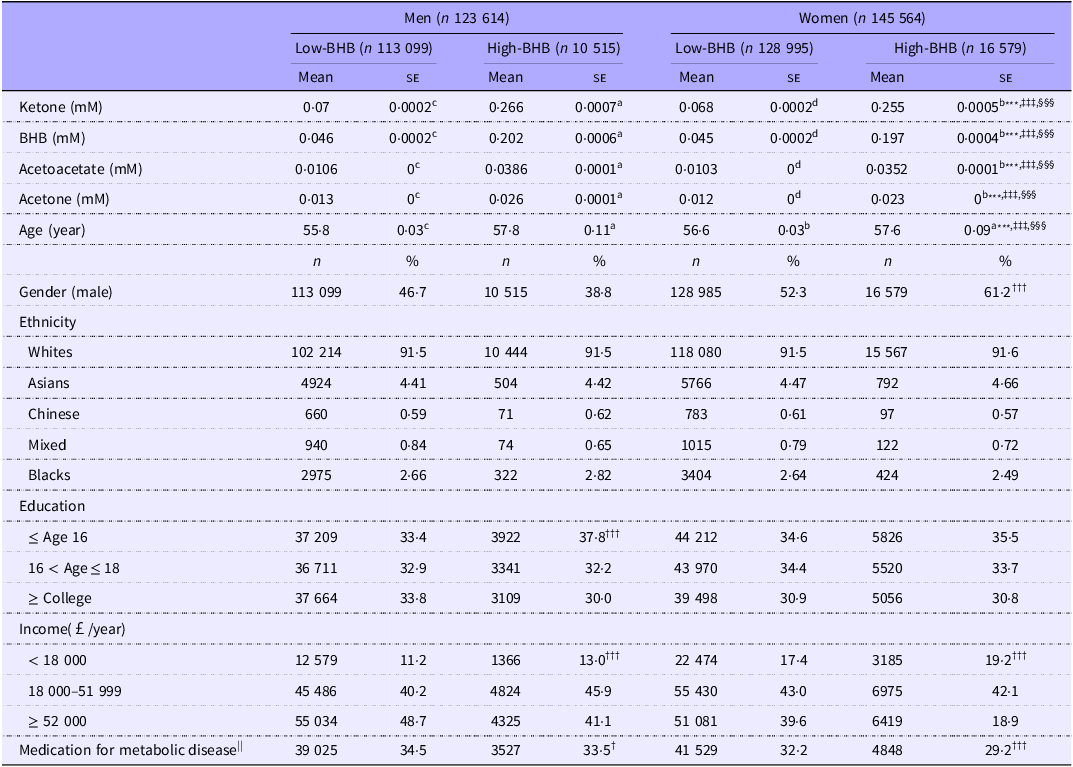
This study included 269 178 UK Biobank participants (123 614 men and 145 564 women), with the high-BHB group comprising more women than men. The majority of participants were of White ethnicity (91·5 %), reflecting the overall UK Biobank population composition, with no significant differences in ethnic distribution between BHB groups (Table 1). Participants with elevated serum BHB levels were significantly older and had lower educational attainment and income levels compared with the low-BHB group (Table 1). Notably, the high-BHB group showed lower prevalence of metabolic disease-related medication use, particularly among women, suggesting better baseline metabolic health profiles despite higher ketone levels (Table 1). Key finding: The high-BHB group demonstrated favourable baseline characteristics with reduced medication use, indicating a metabolically distinct population subgroup.
Characteristics of participants according to serum β-hydroxybutyrate (BHB) concentration

Table 1 Long description
A table comparing characteristics of participants based on serum BHB concentration. The table has 12 rows and 12 columns. Column headers include Men (n 123 614) and Women (n 145 564), each with sub-columns Low-BHB and High-BHB, further divided into Mean and SE. Row labels include Ketone (mM), BHB (mM), Acetoacetate (mM), Acetone (mM), Age (year), Gender (male), Ethnicity, Education, Income (£/year), and Medication for metabolic disease. Each row provides specific values for the categories. Notable trends include higher ketone and BHB levels in the High-BHB group compared to the Low-BHB group for both men and women. The high-BHB group also shows older age, different educational attainment, and income levels, and a lower prevalence of metabolic disease-related medication use.
Adjusted means and standard error (se) are reported. Covariates included age, sex, educational attainment, ethnicity, carbohydrate (grain, breads and fruit) intake, total energy intake, alcohol consumption, physical activity levels, smoking status and medication use. Low-BHB and high-BHB groups are categorised with a cut-off of 0·12 mmol/l (0·18 mmol/l of serum ketone concentration). Ketone was the sum of BHB, acetoacetate and acetone.
||Including hyperglycaemia, dyslipidaemia and hypertension.
***Significantly different by sexes at P < 0·001.
‡‡‡Significantly different by serum BHB concentrations at P < 0·001.
§§§Significant interaction between gender and serum BHB concentration at P < 0·001.
†Significantly different from the low-BHB group at P < 0·05.
†††Significantly different from the low-BHB group at P < 0·001 in each gender.
Diet patterns and food intake
After adjusting for confounding factors using model 2 (age, sex, educational attainment, ethnicity, grain and fruit intake, total energy intake, alcohol consumption, physical activity levels, smoking status and metabolic disease-related medication use), the high-BHB group demonstrated distinct dietary characteristics consistent with ketogenic metabolic patterns. Total energy intake was consistently lower across both sexes, while macronutrient distribution showed a clear shift towards higher fat and lower CHO consumption (online Supplementary Table S2). CHO intake was reduced both as a percentage of energy and in absolute amounts, with correspondingly lower sucrose consumption but higher dietary fibre intake (online Supplementary Table S2).
Analysis of dietary patterns revealed significant dose-dependent associations with BHB levels across different concentration ranges (Figure 1(a)). Plant-based diet (PBD) adherence in the 75th percentile showed progressively stronger positive associations with increasing BHB levels, with the highest association observed in the BHB > 0·12 mM group. Similarly, high Mediterranean diet intake demonstrated positive associations until 0·037–0·12 BHB categories, though this effect was not significant in the highest BHB group (≥ 0·12 mM). High-coffee diet (HCD) intake showed particularly strong positive associations, especially pronounced in the highest BHB category (> 0·12 mM).
Adjusted OR and 95 % CI of high serum β-hydroxybutyrate (BHB) level by food intake. (a) According to the serum BHB levels in each dietary pattern categorised by principal components. The high and low intake of each dietary pattern was at the 75th percentile of its intake. (b) According to the serum BHB levels in different food intakes. The numbers in the parentheses indicate the intake cut-offs. PBD, a plant-based dietary pattern containing high-cooked vegetables, raw vegetables, fresh fruit, dried fruit, oily fish and lean fish. MD, high-meat, dietary patterns containing high proportions of beef, pork, lamb, poultry and processed meats. HCD, high-coffee dietary patterns containing high coffee, low tea and high alcohol. The cut-off of the dietary pattern was the 75th percentile. Carbohydrate (CHO)-rich foods, high intake of bread, cereal, fresh and dried fruits and sweetened beverages; fat-rich foods, oily fish, processed meat, beef, lamb, pork and cheese. Covariates include age, sex, education, income, ethnicity, CHO-rich food intake, alcohol consumption, exercise, smoking status and metabolic disease-related medication use.

Specific food group analyses revealed distinct dose–response relationships across BHB concentration ranges (Figure 1(b)). CHO-rich foods (≥ 14 servings/week) showed consistent inverse associations with BHB levels across all categories, with the strongest protective effect observed in higher BHB ranges. Fat-rich foods (≥ 9 servings/week) demonstrated positive associations with BHB levels, particularly in moderate BHB ranges. Vegetable consumption (≥ 4·5 servings/week) showed strong positive associations, especially pronounced at higher BHB concentrations, while fruit intake (≥ 4 servings/week) exhibited inverse relationships with BHB levels. Coffee consumption (≥ 2·5 cups/week) showed consistent positive associations across all BHB categories, while tea intake (≥ 1 cup/week) demonstrated variable associations depending on BHB concentration levels.
Physical activity levels were higher in the high-BHB group across both sexes, consistent with the metabolic profile associated with elevated ketone production (online Supplementary Table S2). Alcohol consumption and smoking rates were also elevated in this group, particularly among men, suggesting complex lifestyle interactions with ketone metabolism. Key finding: The high-BHB group exhibited a distinct dietary profile characterised by reduced CHO intake, increased vegetable consumption and higher coffee intake, alongside elevated physical activity levels.
Metabolic syndrome and its components according to sex and serum β-hydroxybutyrate levels
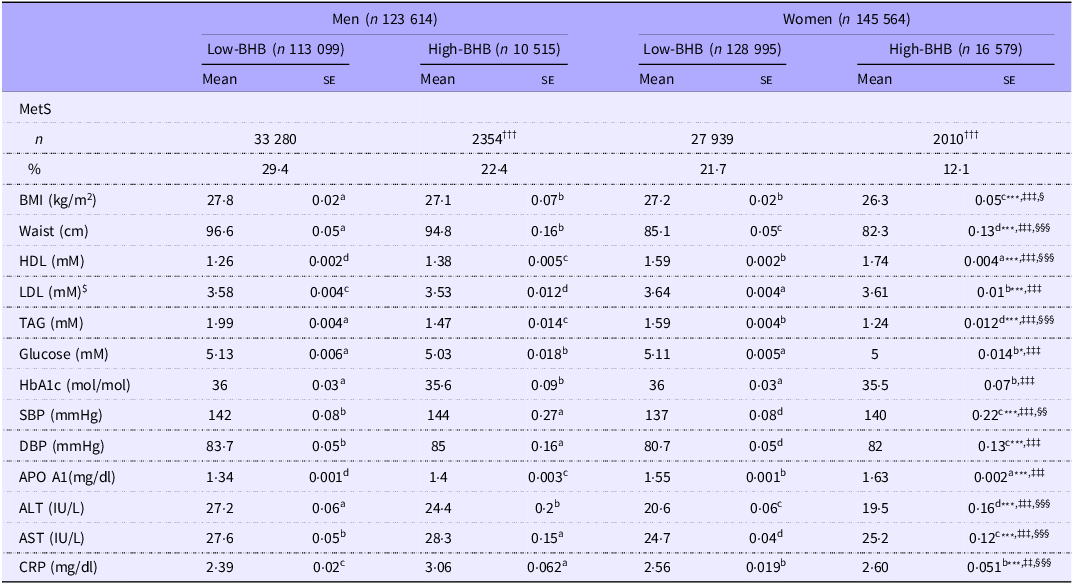
Following model 2 adjustments, MetS incidence was significantly lower in the high-BHB group compared with the low-BHB group for both sexes (22·4 % v. 29·4 % for men and 12·1 % v. 21·7 % for women; P < 0·001) (Table 2). Individual MetS components showed significant differences between BHB groups after comprehensive confounder control. In both men and women, the high-BHB group demonstrated favourable metabolic profiles including lower BMI, reduced waist circumference, higher serum HDL-cholesterol levels, lower serum TAG and increased apo A-I levels compared with the low-BHB group (Table 2). Glucose metabolism was marginally better in the high-BHB group, with lower fasting glucose and alanine aminotransferase levels. However, systolic and diastolic blood pressures were marginally higher in the high-BHB group for both sexes. C-reactive protein levels were also elevated, particularly in men (Table 2), demonstrating that the metabolic effects of elevated BHB are not uniformly beneficial across all parameters. Key finding: Higher BHB levels were associated with significantly reduced MetS risk in both sexes, primarily through improved lipid profiles and body composition, though with concurrent elevations in blood pressure and inflammatory markers.
Metabolic syndrome (MetS) incidence and the levels of its components according to serum β-hydroxybutyrate (BHB) concentration

Table 2 Long description
The table presents data on metabolic syndrome (MetS) incidence and its components according to serum β-hydroxybutyrate (BHB) concentration for men and women. It is divided into four main sections: Men Low-BHB, Men High-BHB, Women Low-BHB, and Women High-BHB. Each section includes various health metrics such as MetS incidence, BMI, waist circumference, HDL, LDL, TAG, glucose, HbA1c, SBP, DBP, APO A1, ALT, AST, and CRP. Row 1: MetS incidence with counts and percentages. Row 2: BMI in kilograms per square meter. Row 3: Waist circumference in centimeters. Row 4: HDL in millimoles. Row 5: LDL in millimoles. Row 6: TAG in millimoles. Row 7: Glucose in millimoles. Row 8: HbA1c in moles per mole. Row 9: SBP in millimeters of mercury. Row 10: DBP in millimeters of mercury. Row 11: APO A1 in milligrams per deciliter. Row 12: ALT in international units per liter. Row 13: AST in international units per liter. Row 14: CRP in milligrams per deciliter. The table shows mean values and standard errors for each metric across the different groups.
SBP, systolic blood pressure; DBP, diastolic blood pressure; ALT, alanine aminotransferase; AST, aspartate aminotransferase; CRP, C-reactive protein.
Adjusted means and standard error (se) are reported. Covariates included age, sex, educational attainment, income, ethnicity, total carbohydrate intake, total energy intake, alcohol consumption, physical activity levels, smoking status and metabolic disease-related medication use. Low-BHB and high-BHB groups are categorised with a cut-off of 0·12 mM (0·18 mM of serum ketone concentration).
$Directly measured serum LDL concentration.
***Significantly different by sexes at P < 0·001.
‡‡‡Significantly different by serum BHB concentrations at P < 0·001.
‡‡ Significantly different by serum BHB concentrations at P <0.01.
§§§Significant interaction between sex and serum BHB concentration at P < 0·001, §§ Significant interaction between sex and serum BHB concentration at P<0.01.
†††Significantly different from the Low-BHB group at P < 0·001 in each gender.a-d Different letters indicate significant differences among the groups at P <0.05.
Dose–response relationships between serum β-hydroxybutyrate levels and metabolic syndrome risk
Dose–response relationship analysis revealed a J-shaped association between serum BHB levels and MetS risk, with an optimal protective threshold at 0·079 mM (Figure 2). The J-shaped curve was consistently observed for key MetS components, including waist circumference, serum TAG and hypo-HDL concentrations, with the nadir of risk occurring at the 0·079 mM switching point.
Adjusted OR and 95 % CI of serum β-hydroxybutyrate (BHB) level by metabolic syndrome (MetS) and its components. Covariates include age, sex, educational attainment, income, ethnicity, carbohydrate (grain, breads and fruit) intake, total energy intake, alcohol consumption, physical activity levels, smoking status and metabolic disease-related medication use. MetS, metabolic syndrome; BP, blood pressure.

Compared with the reference low-BHB group (< 0·026 mM), participants with high-BHB levels demonstrated significantly reduced odds of developing MetS (OR: 0·573, indicating a 42·7 % reduction in MetS risk). Similarly, the odds of elevated waist circumference were reduced by 8·9 % (OR: 0·911), while the risk of hypertriacylglycerolaemia and low HDL-cholesterol were substantially decreased by 52·8 % (OR: 0·472) and 20·2 % (OR: 0·798), respectively (Figure 2).
Notably, participants in the highest BHB quartile showed elevated blood pressure (systolic: 128·5 (se 18·2) mmHg v. 125·8 (se 17·9) mmHg in the lowest quartile, P < 0·05) and C-reactive protein levels (2·8 (se 3·1) mg/l v. 2·3 (se 2·9) mg/l, P < 0·05) compared with lower BHB groups. Despite these elevations, serum BHB concentrations showed a positive association with blood pressure measurements in the dose–response analysis. Key finding: The J-shaped association suggests an optimal BHB threshold of 0·079 mM for metabolic benefits, with attenuated protective effects observed beyond this point, particularly in the highest BHB quartile.
Genetic variant association with high serum β-hydroxybutyrate concentrations
The Manhattan plot (online Supplementary Figure S2A) shows the distribution of genetic variants according to statistical differences. The Q–Q plot indicates no bias or inflation in the genetic variants from the GWAS for high serum-BHB concentrations (online Supplementary Figure S2B).
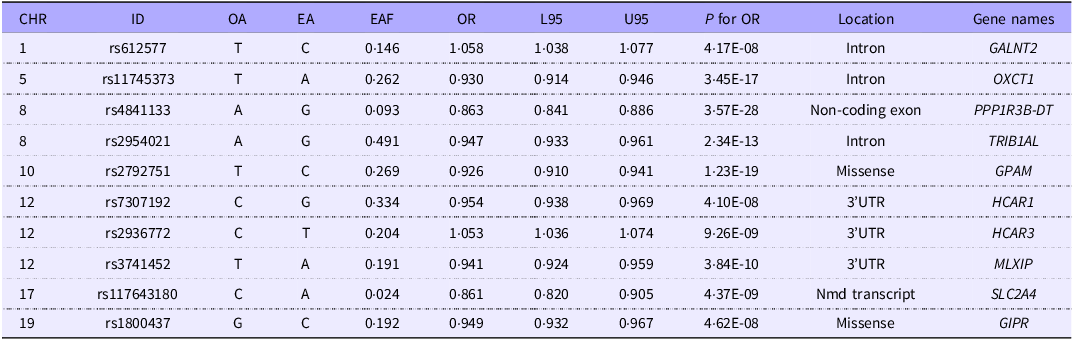
The GWAS, conducted with model 2 adjustments to control for demographic and lifestyle confounding factors, identified ten genetic loci significantly associated with high serum BHB concentrations (Table 3). The most significant association was found for rs4841133 (P = 3·57E-28) in a non-coding transcript exon variant of protein phosphatase 1 regulatory subunit 3B-divergent transcript (PPP1R3B-DT) on chromosome 8, followed by rs2792751 (P = 1·23E-19) in a missense variant in glycerol-3-phosphate acyltransferase mitochondria (GPAM) on chromosome 10. Other notable variants included rs11745373 in 3-oxoacid CoA-transferase 1 (OXCT1) (P = 3·45E-17), rs2954021 in TRIB1 Associated LncRNA (TRIB1AL; P = 2·34E-13), rs7307192 in hydroxycarboxylic acid receptor 1 (HCAR1, 4·10E-08), rs2936772 in HCAR3 (P = 9·26E-09) and rs1800437 in gastric inhibitory polypeptide receptor (GIPR, P = 4·62E-08) (Table 3). Variants were also identified in genes involved in lipid metabolism and glucose transport, such as polypeptide N-acetyl galactosaminyl transferase 2 (GALNT2) and solute carrier family 2 member 4 (SLC2A4). The adjusted OR for these variants ranged from 0·86 to 1·11, indicating moderate genetic effects on serum BHB levels. (Table 3).
Characteristics of genetic variants associated with serum hyper-β-hydroxybutyrate (BHB) level

Table 3 Long description
A table with 10 rows and 11 columns detailing genetic variants associated with serum BHB levels. Columns include CHR, ID, OA, EA, EAF, OR, L95, U95, P for OR, Location, and Gene names. Each row lists specific genetic variants with their respective data. For example, Row 1: CHR, 1; ID, rs612577; OA, T; EA, C; EAF, 0.146; OR, 1.058; L95, 1.038; U95, 1.077; P for OR, 4.17E-08; Location, Intron; Gene names, GALNT2. Row 2: CHR, 5; ID, rs11745373; OA, T; EA, A; EAF, 0.262; OR, 0.930; L95, 0.914; U95, 0.946; P for OR, 3.45E-17; Location, Intron; Gene names, OXCT1.
CHR, chromosome; OA, other allele; EA, effect allele; EAF, effect allele frequency; L95 and U95, lower and upper limits of 95 % CI.
Low-BHB (reference) and high-BHB groups were categorised with a cut-off of 0·12 mmol/l (0·18 mmol/l of serum ketone concentration). Adjusted OR was calculated between Low-BHB and high-BHB after adjusting for covariates including age, sex, educational attainment, income, ethnicity, total carbohydrate intake, total energy intake, alcohol consumption, physical activity levels, smoking status and metabolic disease-related medication use.
MAGMA pathway analysis revealed that these genes were mainly related to lipid catabolic processes, leucocyte homoeostasis, lipid localisation, lipoprotein lipase activity, receptor-mediated endocytosis and lipase activity (online Supplementary Table S3), suggesting a complex genetic architecture underlying BHB metabolism. Key finding: Ten genetic loci were significantly associated with elevated BHB levels, primarily involving lipid metabolism and ketone body regulation pathways.
SNP–SNP interactions by generalised multifactor dimensionality reduction analysis and polygenic risk score
Multi-locus interaction analysis using GMDR identified significant SNP–SNP interactions associated with serum BHB levels, with Bonferroni correction applied (P < 0·001) to account for testing ten SNP combinations. Models with 6, 7, 8, 9 and 10 SNP met the criteria of the sign test (P < 0·001) and cross-validation consistency (10/10), suggesting significant interactions between genetic variants (online Supplementary Table S4).
To justify the selection of the optimal PRS model, we systematically compared the discriminative performance of different models using AUC analysis for predicting elevated BHB levels (≥ 0·12 mM). The 6-SNP model demonstrated the highest discriminative performance (AUC: 0·655, 95 % CI 0·637, 0·674) compared with other models. Given comparable performance across models and following the principle of parsimony to avoid overfitting, the 6-SNP model was selected as the optimal balance between predictive ability and model complexity.
The selected 6-SNP PRS model included PPP1R3B-DT_rs4841133, MAX-like protein X interacting protein (MLXIP)_rs3741452, OXCT1_rs11745373, TRIB1AL_rs2954021, GPAM_ rs2792751 and HCAR3_rs2936772 (online Supplementary Table S4). PRS values were calculated and analysed with model 2 adjustments to control for demographic and lifestyle confounding factors. The 6-SNP PRS showed positive associations with serum BHB levels with an adjusted OR of 1·4 (95 % CI 1·2, 1·6) after adjusting for model 2 covariates (Figure 3(a)). Following comprehensive confounder adjustment, both the 6-SNP and 7-SNP PRS models were inversely associated with MetS risk (adjusted OR: 0·89, 95 % CI 0·84, 0·94) (Figure 3(b)). The adjusted analysis revealed that the 6-SNP model was specifically inversely associated with hypertriacylglycerolaemia and hypo-HDL-cholesterolemia risk but not with waist circumference, hyperglycaemia and hypertension (Figure 3(c)). Key finding: A 6-SNP PRS effectively predicted elevated BHB levels and was associated with reduced MetS risk, particularly for lipid-related components, with consistent effects across different genetic risk categories.
Adjusted OR and 95 % CI of serum β-hydroxybutyrate (BHB) levels and metabolic syndrome (MetS) risk by polygenic risk scores (PRS). (a) According to the PRS of 6-SNP, 7-SNP, 8-SNP, 9-SNP and 10-SNP generated from high serum BHB levels by SNP–SNP interactions. (b) According to the PRS of 6-SNP, 7-SNP, 8-SNP, 9-SNP and 10-SNP generated from MetS risk by SNP–SNP interactions. (c) According to the PRS of 6-SNP, 7-SNP, 8-SNP, 9-SNP and 10-SNP generated from MetS component risk by SNP–SNP interactions. The PRS was calculated by summing the number of risk alleles of the SNP. Low-, medium- and high-PRS were categorised by tertiles. The low-PRS were used as reference scores for logistic regression. Red and blue boxes indicate adjusted OR for model 1 and 2, respectively, and the lines in the boxes indicate 95 % CI. Covariates 1 included age, sex, education, income and ethnicity, and covariates 2 contained the variables of covariates 1 plus total CHO-rich food intake, alcohol consumption, exercise, smoking status and metabolic disease-related medication use.

Tissue/organ-specific expression
GTEx analysis revealed that the genetic variants influencing serum BHB concentration showed differential expression patterns across tissues. HCAR1_rs7307192, OXCT1_rs11745373, GPAM_rs2792751 and SLC2A4_rs117643180 were significantly differently expressed according to alleles (Figure 4, online Supplementary Table S5). Notably, HCAR1 expression was lower in the non-risk allele compared with the risk allele in subcutaneous and visceral fat tissues, while OXCT1 expression was higher in the non-risk allele in subcutaneous fat tissue and skeletal muscle. These tissue-specific expression patterns provide insights into the biological mechanisms underlying genetic effects on BHB metabolism. Key finding: Genetic variants showed tissue-specific expression differences, particularly in fat and muscle tissues, highlighting the biological relevance of identified loci.
Genotype-Tissue Expression (GTEx) of genetic variants linked to high serum β-hydroxybutyrate (BHB) concentrations. (a) Glycerol-3-phosphate acyltransferase mitochondria (GPAM) rs2792751in the tibial artery (P < 6·32E-5). (b) Hydroxycarboxylic acid receptor 1 (HCAR1) rs7307192 in the subcutaneous (2·8 E-14) and visceral adipose tissue (3·01 E-6). (c) 3-oxoacid CoA-transferase 1 (OXCT1) rs11745373 in the subcutaneous adipose tissue (6·74 E-5) and skeletal muscle (1·15 E-11). (d) Solute carrier family 2 member 4 (SLC2A4) rs117643180 in the skeletal muscle (1·99 E-11).

PRS–lifestyle interaction with serum β-hydroxybutyrate levels
Analysis of PRS–lifestyle interactions was conducted with a planned Bonferroni-corrected significance threshold of P < 0·005 (0·05/10) to account for testing ten lifestyle factors. However, the observed P-values for significant interactions (PBD: P = 0·023; CHO-rich food intake: P = 0·0394; smoking status: P = 0·049; online Supplementary Table S6) did not meet this stringent threshold, indicating that Bonferroni correction was not achieved for these interactions. Despite not reaching the corrected significance level, these interactions showed consistent patterns warranting descriptive analysis.
The PRS of the 6-SNP model showed nominal interactions with PBD, CHO-rich food intake and smoking status in influencing high serum BHB concentration, with all analyses adjusted for model 2 confounding factors to isolate the gene–lifestyle interaction effects. The serum BHB concentrations were overall higher in the high-PBD groups than in the low-PBD group in each PRS, and in the high-PBD group, the serum BHB concentrations were much higher in the participants with high-PRS than those with low-PRS (Figure 5(a)). The serum BHB concentrations showed a reverse trend with respect to the CHO intake compared with that seen with the PBD intake: it was much higher in those with low CHO-rich food intake than with high CHO-rich food intake. The PRS impact was much greater in the low CHO-rich food intake group, and it was offset in the high CHO-rich food intake group (Figure 5(b)). Current smokers had much higher serum BHB concentrations than non- and former smokers, and their effect was much greater in the participants with high-PRS than those with low-PRS (Figure 5(c)). Key finding: Genetic effects on BHB levels were modulated by lifestyle factors, with PBD and low CHO intake enhancing genetic susceptibility to elevated ketone levels.
Gene–environment interactions between polygenic risk score (PRS) for serum β-hydroxybutyrate (BHB) levels and dietary/lifestyle factors. (a) Adjusted means and standard errors of serum BHB concentration in the low-plant-based diet (PBD) and high-PBD groups (a cut-off value: 75th percentiles). (b) Adjusted means and standard errors of serum BHB concentration in the low carbohydrate (CHO)-rich food intake and high CHO-rich food intake groups (a cut-off value: 14 servings/week). (c) Adjusted means and standard errors of serum BHB concentration in the non-smokers and smokers plus former smokers. Serum BHB concentrations (mM) stratified by low-, medium- and high-PRS groups based on the six SNP model across different environmental exposures. Covariates included age, gender, education, income, ethnicity, CHO-rich food intake, alcohol consumption, exercise, smoking status and metabolic disease-related medication use. The covariate corresponding to each panel’s stratification variable was excluded from that specific model. Data are presented as adjusted means and standard errors). a,b,c,d,e,fDifferent superscript letters indicated significant differences among the groups using Tukey’s post hoc test at P < 0·05.

Sensitivity analysis
Sensitivity analyses using random subsamples of 20 %, 40 %, 60 %, 80 % and 100 % of the total cohort confirmed the robustness of our key findings. The inverse association between serum BHB levels and MetS remained consistent across all sample sizes, with no significant heterogeneity observed (Cochran’s Q test: P = 0·60–0·99; I2 = 0 % for all BHB percentile categories). Point estimates showed minimal variation across subsamples, while CI narrowed progressively with increasing sample size, confirming the stability and reliability of our primary results (online Supplementary Figure S3A). Similarly, the association analysis between the 6-SNP PRS and serum BHB levels showed consistent patterns across all sample fractions (online Supplementary Figure S3B). No significant heterogeneity was observed between subsamples (Cochran’s Q: P = 0·752–0·941; I2 = 0 %), confirming that the observed associations are robust and independent of sample composition. Key finding: Both the BHB–MetS association and the PRS–BHB interaction remained stable across different sample sizes, supporting the reliability and generalisability of the findings.
Discussion
This large-scale observational study examined associations between serum BHB, MetS, lifestyle factors and genetic variants in 269 178 UK Biobank participants. Our findings contribute to the growing understanding of ketone body metabolism in relation to metabolic health while highlighting the complex interplay between genetic predisposition, lifestyle factors and metabolic outcomes.
Our observation of an inverse association between higher serum BHB levels (> 0·12 mM) and MetS components is consistent with several previous studies(Reference Xu, Xu and Hou21–Reference Dudbridge24), confirming established relationships at an unprecedented population scale. Wang et al. (Reference Wang, Chen and Wu25) and Shahpasand et al. (Reference Shahpasand, Khatami and Ehtiati26) demonstrated metabolic benefits of mild ketosis in smaller intervention studies, while observational work by Newman et al. (Reference Newman and Verdin27) and Lopaschuk et al. (Reference Lopaschuk and Dyck5) suggested protective associations between ketone bodies and cardiovascular risk factors. These associations likely reflect BHB’s role as an alternative fuel source that may enhance metabolic efficiency and reduce reliance on glucose metabolism, potentially improving insulin sensitivity and lipid homoeostasis.
Prior studies have demonstrated non-linear associations of ketone bodies with various health outcomes(Reference Hirschberger, Effinger and Yoncheva15,Reference de Koning, Westenbrink and Assa28,Reference Meeusen, Romagnolo and Holsink29) . The J-shaped relationship between serum BHB levels and MetS risk observed in our study suggests distinct biological mechanisms operating at different concentration ranges. Low BHB concentrations (< 0·1 mM) may reflect metabolic inflexibility, where impaired fatty acid oxidation and ketogenesis indicate underlying insulin resistance and mitochondrial dysfunction – hallmarks of MetS development(Reference Mey, Erickson and Axelrod30). This metabolic rigidity limits the body’s ability to efficiently switch between glucose and fat utilisation, potentially predisposing individuals to metabolic dysfunction. Moderate BHB elevations (0·1–1·0 mM) appear to confer metabolic benefits through several mechanisms. BHB acts as a signalling molecule that inhibits the NLRP3 inflammasome, reducing chronic inflammation associated with MetS(Reference Youm, Nguyen and Grant31). Additionally, BHB promotes mitochondrial biogenesis and enhances cellular energy efficiency, potentially improving insulin sensitivity and metabolic flexibility(Reference Gómora-García, Montiel and Hüttenrauch32). These physiological concentrations may represent optimal ketone signalling without triggering compensatory mechanisms. High BHB concentrations (> 3·0 mM) may indicate pathological states or excessive metabolic stress. At the excessively high BHB levels, the protective signalling effects of BHB may be overwhelmed by the metabolic stress that drives such extreme ketone production. This dose–response relationship suggests that BHB’s metabolic effects are dose-dependent, with optimal benefits occurring within a narrow physiological window where ketone signalling enhances metabolic function without indicating underlying pathology.
Our analysis revealed contrasting patterns between BHB and individual MetS components. While most components exhibited J-shaped relationships, blood pressure showed a consistent positive association with BHB levels across the entire observed range. This finding aligns with recent NHANES data demonstrating increased hypertension risk among ketogenic diet adherents(Reference Qu, Liu and Huang33), suggesting that BHB’s metabolic effects may not be uniformly beneficial across all physiological systems. Several mechanisms may explain the elevated blood pressure associated with higher BHB levels. Even modest BHB elevations may stimulate sympathetic nervous system activity, leading to increased heart rate and vasoconstriction(Reference Lopaschuk and Dyck5). While acute ketosis typically promotes Na excretion, chronic mild ketosis may trigger compensatory renin–angiotensin–aldosterone system activation to maintain electrolyte balance, contributing to blood pressure elevation through aldosterone-mediated Na retention(Reference Barrea, Verde and Camajani34). Alternatively, higher BHB levels may serve as biomarkers of underlying metabolic stress rather than direct causative factors, where individuals with subclinical insulin resistance exhibit elevated BHB as a compensatory response alongside concurrent activation of stress pathways that potentially promote hypertension.
The elevated C-reactive protein observed in higher BHB groups presents a paradox given BHB’s recognised anti-inflammatory properties through NLRP3 inflammasome inhibition(Reference Lopaschuk and Dyck5,Reference Homilius, Seefeldt and Axelsen35) . This finding may reflect several mechanisms: mild ketosis occurring as part of a broader metabolic stress response where pro-inflammatory cytokines are simultaneously elevated due to underlying metabolic dysfunction(Reference Bendridi, Selmi and Balcerczyk36,Reference Soni, Martens and Takahara37) , tissue-specific variations in BHB’s anti-inflammatory effects with protective effects in some organs while having neutral effects in others(Reference Puchalska and Crawford38) or individual variability in BHB sensitivity possibly due to genetic factors influencing ketone signalling responses. These findings underscore the complexity of ketone body physiology and highlight the need for mechanistic studies examining tissue-specific and individual-specific responses to mild ketosis.
Our dietary and lifestyle findings largely confirm established knowledge about ketogenic metabolism. The association between lower CHO intake and higher BHB levels aligns with fundamental principles of ketogenesis, consistent with previous research showing that ketogenic diets typically consisting of 5–10 % CHO can lead to mild ketosis(Reference Dyńka, Kowalcze and Charuta39,Reference Xiang, Wang and Lan40) . We found that a 10 % lower energy intake with a balanced diet containing fewer than three servings of grains and fruits and 2–3 servings of fat-rich foods was associated with higher serum BHB levels, suggesting that mild ketosis can be achieved without extreme dietary restriction. The finding that high fish intake was associated with lower serum BHB levels, despite fish being a ketogenic food, may reflect the complex interplay between protein intake, gluconeogenesis and ketone production, suggesting that high protein intake may suppress ketogenesis even in the context of low CHO consumption(Reference Hur, Wu and Yang8).
Coffee drinking was positively associated with serum BHB concentrations, while tea drinking showed mixed effects. While previous studies have shown that caffeine can increase plasma ketone levels and oxidative stress markers, especially BHB(Reference Baumeister, Gardemann and Fobker41,Reference Vandenberghe, St-Pierre and Courchesne-Loyer42) , our study systematically compared coffee v. tea effects on BHB levels in a large population. The positive association between alcohol intake and BHB levels confirms previous research, though excessive intake can lead to pathological ketoacidosis(Reference Yokoyama, Yokoyama and Mizukami43,Reference Srinivasan, Shawky and Kaphalia44) . These associations likely reflect BHB’s role as an alternative fuel source that may enhance metabolic efficiency and reduce reliance on glucose metabolism, potentially improving insulin sensitivity and lipid homoeostasis.
A major contribution is our comprehensive GWAS that identified ten genetic loci significantly associated with high BHB status, representing the first large-scale genetic analysis of ketone metabolism in the general population. The 6-SNP PRS including variants in PPP1R3B-DT, GPAM, MLXIP, TRIB1AL, HCAR3 and OXCT1 genes provides new insights into the genetic architecture of ketone metabolism. GTEx analysis and MAGMA pathway enrichment support the biological relevance of identified variants in metabolically active tissues including liver, adipose tissue and skeletal muscle. The genetic variants in the 6-SNP PRS contribute to altered metabolic profiles through three key biological pathways: (1) fatty acid oxidation enhancement through GPAM (reducing glycerolipid synthesis efficiency, increasing fatty acid availability for β-oxidation)(Reference Yu, Iqbal and Fang45), TRIB1AL (a long non-coding RNA associated with TRIB1 that promotes fatty acid oxidation)(Reference van Solingen, Scacalossi and Moore46) and OXCT1 (crucial for ketone body utilisation in extrahepatic tissues)(Reference Dong, Mesaros and Xu47); (2) glucose homoeostasis regulation via PPP1R3B-DT (modulating glycogen synthesis to preserve glucose stores)(Reference Mehta, Shewale and Sequeira48) and MLXIP/ChREBP (coordinating glucose and lipid metabolism to favour lipid utilisation during low CHO states)(Reference Nagarajan, Livingstone and Monfeuga49); and (3) metabolic sensing and signalling through HCAR3 variants that may alter cellular sensitivity to ketone bodies and related metabolites(Reference Kapolka and Isom50). This genetic architecture suggests a metabolic profile optimised for efficient fatty acid utilisation and ketone production while preserving glucose for essential functions.
The systematic characterisation of gene–environment interactions, particularly between the PRS and CHO intake, provides the first evidence for potential personalised approaches to metabolic health management based on genetic predisposition to ketone metabolism. Our findings suggest that individuals with higher genetic predisposition to elevated BHB levels may show greater metabolic responses to dietary CHO restriction, though these interactions require validation in independent cohorts before clinical application.
Several methodological limitations constrain the interpretation of our findings. First, the cross-sectional design precludes causal inference between BHB levels and metabolic outcomes, with reverse causation remaining possible where improved metabolic health leads to lifestyle changes that elevate BHB levels rather than BHB conferring metabolic protection. Second, limited ethnic diversity (91·5 % White European ancestry) significantly constrains generalisability, as genetic variants associated with ketone metabolism may exhibit different allele frequencies and effect sizes across ancestry groups, and dietary patterns influencing ketone production vary substantially across ethnic groups. Third, our complete-case analysis approach for missing covariate data, while ensuring model homogeneity, could theoretically introduce bias if missingness were not random, though this was mitigated by our substantial sample size. Fourth, single-timepoint BHB measurements may inadequately represent individual ketone metabolism patterns, which exhibit substantial diurnal variation and respond to fasting status, physical activity and dietary intake. Fifth, the 0·12 mM threshold for defining elevated BHB status, while literature-based, represents an arbitrary cut-off that may not reflect optimal clinical thresholds. Sixth, reliance on self-reported dietary data introduces recall bias and measurement error, potentially affecting association accuracy(Reference Carter, Lewington and Piernas18). Seventh, residual confounding by unmeasured lifestyle factors remains possible, as individuals with higher BHB levels may engage in beneficial behaviours such as intermittent fasting or enhanced physical activity that independently improve metabolic outcomes. Finally, selection bias may limit generalisability, as UK Biobank participants tend to be healthier and more health-conscious than the general population.
In the aspect of clinical implication, the PRS for serum BHB levels could be integrated into precision medicine approaches for MetS prevention. Individuals with high genetic predisposition to low ketone production might benefit from targeted interventions such as intermittent fasting protocols, Mediterranean-style diets with increased healthy fats or ketone supplementation. Conversely, those with genetic variants promoting higher ketone production might achieve metabolic benefits through less restrictive dietary modifications. In clinical practice, healthcare providers could use genetic information to adapt dietary recommendations, with high-risk genetic profiles receiving more intensive lifestyle interventions. From a public health perspective, communities with higher frequencies of genetic variants associated with poor ketone metabolism might benefit from targeted educational programmes about dietary patterns that naturally promote mild ketosis.
Critical future research priorities include validating the PRS in diverse populations through multi-ethnic cohort studies, exploring longitudinal effects of BHB levels on MetS incidence through prospective studies with extended follow-up periods and examining whether ketone-targeted interventions demonstrate enhanced efficacy in genetically stratified populations. The J-shaped dose–response relationship suggests potential optimal BHB ranges for metabolic health, but our analysis lacks sufficient granularity to define precise therapeutic targets. Future randomised controlled trials examining ketone interventions in genetically stratified populations are needed to establish causal relationships and inform evidence-based clinical recommendations.
In conclusion, this large-scale observational study provides population-level evidence for associations between serum BHB levels and metabolic health outcomes. Key contributions include characterising the J-shaped BHB–MetS relationship, developing the first comprehensive GWAS of ketone metabolism with a 6-SNP PRS and identifying gene–environment interactions. However, the observational design limits causal inference, as associations may reflect confounding by lifestyle factors rather than direct BHB effects. These findings advance understanding of ketone metabolism in population health but require validation through randomised controlled trials and mechanistic studies before clinical application.
Supplementary material
For supplementary material/s referred to in this article, please visit https://doi.org/10.1017/S0007114526107260
Acknowledgements
This study was supported by a grant from the National Research Foundation of Korea (NRF) funded by the Ministry of Science and ICT (RS-2023-00208567)
S. P.: conceptualisation, funding acquisition, formal analysis and writing – original draft. J. C: formal analysis and reviewing and editing – original draft.
The authors report no disclosures relevant to the manuscript.
Access to UKBB data can be requested through a standard data access procedure. Requests to access these datasets should be directed to https://www.ukbiobank.ac.uk/register-apply.