The state of the economy is commonly considered a determining factor for the outcome of US presidential elections. Voters reward incumbent party candidates when the economy is doing well and punish them otherwise (Tufte Reference Tufte1978). Since the late 1970s, economists and political scientists have built on this idea and developed so-called political economy models for forecasting election results. These models use one or more economic variables, usually along with political variables. There is general agreement on the integration of political variables, such as the incumbent's popularity and the time he or his party has controlled the White House. The main difference among the models lies in the selection of economic variables. Some authors rely on economic growth (measured as GDP or GNP), others use perceptions of personal income (either retrospective or prospective) and still others measure job growth (see Holbrook Reference Holbrook2010). Since economic indicators often correlate with one another, the selection of particular economic variables does not seem to make a significant difference; there has mostly been consensus among the different models’ forecasts in historical elections.
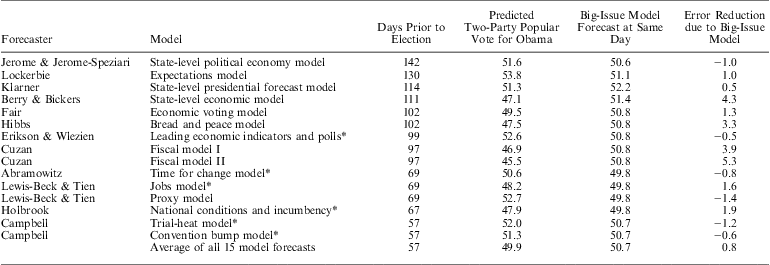
When economic indicators disagree, however, uncertainty increases, as was the case at the outset of the 2012 US presidential election. While income growth was at a historical low, leading economic indicators and perceived business conditions were on par with historical averages (Erikson and Wlezien Reference Erikson and Wlezien2012). In such a situation, forecasts from different political economy models diverge, depending on which economic variables are selected. Table 1 shows forecasts from 15 models that were published in the October 2012 issue of PS: Political Science & Politics, plus Fair's model (Reference Fair2009). Fair's model is the grandfather of all presidential election-forecasting models grounded on ‘fundamentals.’ All but one of these models uses at least one economic variable among a set of other predictors to forecast the incumbent's two-party popular vote share several months prior to election day.Footnote 1 Based on these 15 forecasts, any outcome seemed possible in the 2012 election. Eight models predicted Obama to win and seven models forecast he would lose to Romney. The forecasts ranged from an almost eight-point victory for Obama to a nine-point victory for Romney. On average, the models predicted a virtual tie in the popular vote, with a 0.2 percentage point lead for Romney. Obama won the election with a lead of four points and 52.0 percent of the two-party vote.
Two-party Popular Vote Forecasts of Political Economy Models and the Big-Issue Model for the 2012 Election

* Models that use economic indicators and polls as predictor variables.
Note: Forecasts ordered by days prior to election day. The source for political economy models is Campbell (Reference Campbell2012a), except for the model by Fair, which was derived from fairmodel.econ.yale.edu. The forecast by Klarner was incorrect in Campbell's original table and thus corrected above. The error reduction is the difference between the absolute error of the political economy model and the absolute error of the Big-Issue Model forecast of the same day. Positive values indicate that the Big-Issue Model was more accurate; negative values indicate that the Big-Issue Model was less accurate.
The results suggest that one should be cautious of forecasts derived from political economy models if economic indicators disagree. In such situations, the models’ implicit assumption that voters can accurately observe the state of the economy and infer how these changes will affect their future well-being may not hold. Political economy models are also subject to other limitations that arise from their focus on economic fundamentals as predictor variables. First, the use of such variables makes political economy models retrospective in nature. Most models lack prospective components and evaluations of the ‘out party,’ which makes them less useful in open-seat elections.Footnote 2 Second, economic indicators can be affected by large measurement errors. Initial estimates of economic figures that are used to calculate the forecasts a few months prior to the election often differ widely from the revised figures that the forecasters use to calibrate their models. Third, the electorate may perceive the same economic figure differently, depending on the electoral context. For example, incumbents may strongly benefit from a GDP growth rate of 3 percent after a recession. However, the same growth rate may help them less in a booming economy. Fourth, due to the focus on economic variables, most models ignore non-economic issues.Footnote 3 This is problematic because the economy is not the only issue of concern to voters. Depending on the electoral context, many other issues may influence the voting decision. Non-economic issues are often even more important than economic ones. Fifth, political economy models provide little decision aid to those involved in political campaigns.Footnote 4
The Big-Issue Model (Graefe and Armstrong Reference Graefe and Armstrong2012) was developed to address some of these limitations. The model relies on ‘take-the-best,’ a simple heuristic for choosing between alternatives based on a single piece of information. This approach is particularly valuable if one variable is clearly more important than all other variables (Gigerenzer and Goldstein Reference Gigerenzer and Goldstein1996).
The Big-Issue Model differs from traditional political economy models in that it does not use economic fundamentals as predictor variables and does not solely focus on economic issues. Instead, it uses a single predictor variable that measures people's perceptions of which candidate will better handle the most important issue facing the country. Using this variable, the model captures retrospective and prospective candidate evaluations, considers economic and non-economic issues (depending on their importance in a particular election) and avoids measurement errors and misperceptions of economic fundamentals. It can also provide quick advice on which issues candidates should assign the highest priorities on their campaign agenda.
The Big-Issue Model builds on Downs’ (Reference Downs1957) classic model by assuming that voters are most interested in delivery (that is, who can do the job). In addition, it builds on the work of political psychologists who found that people use simple heuristics and cognitive shortcuts to decide how to vote (Redlawsk Reference Redlawsk2004). With the focus on issue evaluations, the Big-Issue Model relies on one of the three variables of the valence politics model of individual voting behavior. Valence politics assumes that a person's vote choice is determined by partisanship, party leader images and the candidates’ (or parties’) issue-handling competence (Clarke et al. Reference Clarke, Sanders, Stewart and Whiteley2009). An in-sample comparison of rival models of electoral choice showed that the valence politics model best explained individual vote choice in the 2008 US presidential election; it correctly ‘predicted’ vote choice for 97 percent of respondents. However, a simple model based solely on the parties’ perceived issue-handling competence also performed well and yielded 88 percent correct predictions (Clarke et al. Reference Clarke, Kornberg, Scotto, Reifler, Sanders, Stewart and Whiteley2011).
This research note reviews the performance of the Big-Issue Model in forecasting the 2012 US presidential election. In general, the model can be expected to provide accurate forecasts if there is one issue that is regarded as clearly more important than others (Graefe and Armstrong Reference Graefe and Armstrong2012; Gigerenzer and Goldstein Reference Gigerenzer and Goldstein1996). Thus the political environment of the 2012 election favored the Big-Issue Model; the economy was the dominant issue during the campaign.
Materials And Method
Starting in early 2011, we collected polls from pollingreport.com that asked people which candidate they expected to do the best job in handling the issue that was seen as most important at that time (the economy).Footnote 5 For example, “Regardless of who you support, which (2012 presidential election) candidate do you trust to do a better job handling the economy—(Barack) Obama or (Mitt) Romney?” (ABC News/Washington Post Poll, 1–4 November 2012). By the eve of the election, we had obtained a total of 61 polls. For each poll, we calculated the two-party support for Obama. This Big-Issue score (S) represents the single variable in the vote equation of the Big-Issue Model: V = 27.0 + 0.50 × S, where V is the two-party popular vote share of the incumbent party's candidate.
This vote equation was derived by simple linear regression of V on historical election eve values of S, using data from the ten prior elections from 1972 to 2008.Footnote 6 For details on the exact procedure see Graefe and Armstrong (Reference Graefe and Armstrong2012).Footnote 7 The first forecast of the Big-Issue Model was published at pollyvote.com on 10 January 2011, almost two years before the election. The forecasts were continuously updated whenever new polls were released.Footnote 8
Results
Since its first release, the Big-Issue Model predicted Obama to win the popular two-party vote, except during a short period in late August when Romney was expected to gain 50.2 percent (vs. Obama at 49.8 percent).Footnote 9 As shown in Figure 1, since late May 2012, more than half a year before the election, the forecast was within a narrow range of about two percentage points, with a maximum of 52.2 percent for Obama in mid-July.Footnote 10 The final forecast calculated on election eve predicted Obama would gain 51.4 percent, and thus missed the final election outcome by 0.6 percentage points.
Daily forecasts of the Big-Issue Model and benchmarks Note: From 31 May to election eve 2012.
Figure 1 also shows the daily forecasts of three benchmark approaches: (1) the Iowa Electronic Markets (IEM) vote-share prediction market, (2) Nate Silver's New York Times blog FiveThirtyEight.com and (3) PollyVote.com, which combines forecasts from different methods that use different data (Graefe et al. Reference Graefe, Armstrong, Jones and Cuzán2014). The forecasts from the Big-Issue Model, FiveThirtyEight and PollyVote were stable and relatively close to each other for most of the forecast horizon. In comparison, the IEM forecasts were much more volatile from about mid-July to the election and tended to predict a large victory for Obama until two weeks prior to election day.
So how would one have done by simply relying on one of the four methods for each day of the five-month period? Figure 2 answers this question. At each point in time, Figure 2 shows each method's mean absolute error (MAE) for the remaining days in the forecast horizon. That is, each data point in the chart shows the average error that one would have achieved by relying on the method for the remaining days until the election. For example, across the last 50 days prior to the election (that is, from 17 September to election eve) the MAE of the Big-Issue Model was 0.35 percentage points, compared to 0.48 for PollyVote, 0.76 for FiveThirtyEight and 1.60 for the IEM. That is, the Big-Issue Model reduced the errors of the PollyVote, FiveThirtyEight and the IEM by 27 percent, 54 percent and 78 percent, respectively. However, the advantage of the Big-Issue Model fades as the forecast horizon increases. Over the full 159-day period from 31 May to election eve, the respective errors were 0.79 for the Big-Issue Model, 0.35 for the PollyVote, 0.72 for FiveThirtyEight and 1.11 for the IEM. That is, across the whole forecast horizon, the error of the Big-Issue Model was 29 percent below the respective error of the IEM, but 10 percent larger than the error of FiveThirtyEight and more than twice the error of the PollyVote.Footnote 11
Mean absolute errors of daily forecasts of the Big-Issue Model and three benchmarks across the remaining days of the forecast horizon
A possible reason for the lower accuracy of the Big-Issue Model when making long-term forecasts is that issues play a less important role early in the campaign. Prior research has shown that party identification and candidate evaluations are at least as important as issue evaluations when making long-term forecasts. However, at around 40 days prior to the election, which is about the time of the presidential debates, the importance of issues as a predictor of election outcomes increases sharply (Graefe Reference Graefe2013). This is also about the time when the forecasts of the Big-Issue Model became highly accurate and stable (cf. Figure 1).
Finally, one might want to compare the accuracy of the Big-Issue Model to the one-shot forecasts of political economy models. Table 1 reports the forecasts of the Big-Issue Model from the same day each of the 15 political economy models was published. The Big-Issue Model provided more accurate forecasts than nine models and was less accurate than six models. On average, the Big-Issue Model's forecast error was 1.2 percentage points lower than the error of the typical political economy model, which corresponds to an error reduction of 48 percent. That is, if one had relied on the forecasts from the Big-Issue Model instead of the forecasts of one of the political economy models, one would have reduced the error by more than half. In addition, the Big-Issue Model's error was 0.8 percentage points below the error of the combined forecast from the 15 models, calculated 57 days prior to the election. This corresponds to an error reduction of 40 percent. It is interesting to note that, except for the model by Holbrook (Reference Holbrook2012), models that use both economic indicators and polls as predictor variables were among the most accurate. This result conforms to prior research, which showed that adding public opinion variables to models that are solely based on structural variables increases forecast accuracy (Erikson, Bafumi and Wilson Reference Erikson, Bafumi and Wilson2001).
Discussion
The 2012 US presidential election was the first real test case for the Big-Issue Model to provide ex ante forecasts. The model provided more accurate forecasts than both the majority and the average of 15 established political economy models. In addition, the model outperformed the PollyVote, FiveThirtyEight and the IEM when making daily updated forecasts during the last two months of the campaign. The Big-Issue Model was only less accurate than FiveThirtyEight and the PollyVote when making long-term forecasts.
This performance conforms to prior analysis that showed that the model also provided competitive forecasts for historical elections. Ex ante forecasts from the Big-Issue Model for the three elections from 2000 to 2008 reduced the error of the typical of eight established political economy models by 5 percent. The model also outperformed the IEM in predicting who would win (but was less accurate than the IEM when predicting vote shares). This result was achieved even though the conditions for the 2000 and the 2004 elections were unfavorable to the Big-Issue Model because during these elections, voters’ perceptions of which issue was most important often changed (Graefe and Armstrong Reference Graefe and Armstrong2012). Not so in 2012. Throughout the 2012 campaign, economic issues superseded all others. As mentioned earlier, such a situation is favorable for the Big-Issue Model, as it relies on the take-the-best heuristic (Gigerenzer and Goldstein Reference Gigerenzer and Goldstein1996). In addition, the results suggest that the Big-Issue Model is particularly valuable if economic indicators disagree and thus paint an unclear picture of the state of the economy. In such situations, the theory that economic fundamentals provide a proxy for people's expectations of the state of the economy appears to be of limited value. Forecasts from traditional political economy models of the 2012 election outcome differed widely and suggested high uncertainty about the election outcome. Finally, the Big-Issue Model can be expected to provide valuable forecasts—even if the conditions are not ideal—because its score likely captures information that goes beyond the candidates’ competence in handling the most important issue. In particular, issue evaluations are influenced by other factors such as partisanship and candidate evaluations (Asher Reference Asher1992). For example, a large literature argues that voters’ perceptions of the economy are influenced by partisanship,Footnote 12 although the direction of causality remains a matter of debate (Lewis-Beck, Nadeau and Elias Reference Lewis-Beck, Nadeau and Elias2008). The Big-Issue Model does not aim to contribute to this theoretical debate. Rather, part of the reason why the Big-Issue Model predicts well is that its explanatory variable serves as a proxy for picking up large amounts of information about the electoral context.
The Big-Issue Model adds valuable information to existing models, as it forecasts election results using people's assessments of which candidate will most effectively deal with the most important problem facing the country. This is an advantage of the Big-Issue Model over political economy models, as it can provide rapid and inexpensive decision-making recommendations to those involved in political campaigns, especially in terms of which issues to prioritize on campaign agendas. Furthermore, the model can help candidates and parties acquire quick feedback on the effectiveness of their campaign strategies.
Conclusion
The accuracy problem in forecasting US presidential elections has been solved in the past decade. For the past three elections, the combined forecast at PollyVote.com has provided highly accurate forecasts of the election outcome, starting months before election day. On average, the PollyVote's election eve forecasts missed the actual outcome by little more than half of a percentage point (Graefe et al. Reference Graefe, Armstrong, Jones and Cuzán2013). The Big-Issue Model is not designed to compete with the PollyVote. However, the model uses a different method and different data than established models and thus contributes to the accuracy of a combined forecast. Its primary benefit is to provide a fast and frugal way to aid the decision making of parties, candidates and voters.