Vigil proposes that “gender-specific emotive behaviors would have coevolved with these [social] constraints in order to regulate interpersonal dynamics to enhance social fitness” (target article, sect. 1, para. 3). Vigil's framework can be used to make sense of apparently contradictory findings in the literature regarding the relationship between smiling and affect; moreover, the framework is useful for understanding our own recent empirical findings concerning gender differences in emotional expression.
Previous empirical evidence regarding the relationship between smiling and positive affect is equivocal, with some studies finding such a relationship (Brown & Schwartz 1980; Ekman et al. 1980; Friedman & Miller-Herringer 1991; Hall & Horgan 2003; Hecht & LaFrance 1998; Schwartz et al. 1980) but several others failing to find one (Gehricke & Fridlund 2002; Jakobs et al. 2001; Kraut & Johnston 1979; Ruiz-Belda et al. 2003). Consistent with Vigil's socio-relational framework of expressive behaviors (SRFB), we propose that sex is an important moderator of the relationship between smiling and affect.
The view that sex differences can help explain the contradictory findings regarding the relationship between smiling and affect is supported by several pieces of evidence. First, most of the studies supporting a positive affect–smiling link used predominantly or exclusively female samples (e.g., Ekman et al. 1980; 1990; Friedman & Miller-Herringer 1991; Hess et al. 1995; Larsen et al. 2003), whereas studies finding no such link tended to rely on male samples (e.g., Gehricke & Fridlund 2002). This suggests that, as Vigil argues, the links between affect and facial behavior could be different for women and men. Second, evidence suggests that positive and negative affect may have different biological markers in men than in women. One study found that salivary cortisol was associated with state positive affect only in women (Polk et al. 2005). Once again this finding supports Vigil's model by demonstrating that biological affective processes may differ for men and women.
We propose that these differences could result in different facial displays of affect, specifically smiling, for men and women. In line with Vigil's model, we predicted that, among women, smiling may be a signal of trustworthiness, associated with feelings of warmth, and thus should correlate positively with positive affect. Among men, smiling may be a signal of capacity, associated with feelings of confidence and lack of distress, and thus should correlate negatively with negative affect.
We tested this hypothesis by examining whether positive affect and negative affect predicted smiling in men and women. Seventy male and 87 female undergraduates (mean age, 18.7 years; SD=2.0; 58% White, 24% Asian, 12% Latino, and 6% other ethnicity) completed a battery of questionnaires including the Positive And Negative Affect Schedule (PANAS; Watson et al. 1988). The instructions for the PANAS were to “indicate to what extent you have felt this way today” using a 1 to 7 Likert-type rating scale. Immediately after, participants were photographed by an experimenter who was blind to the purpose of the study. To capture naturally occurring smiling behavior, experimenters gave participants no instructions about what to do in the photograph except where to stand. Six coders viewed the photographs in different randomized orders and, on a forced-choice item, coded whether or not participants were smiling. The reliability of the codings was very high (ICC or intraclass correlation coefficient [2, k]=.95; ICC [2,1]=.76).
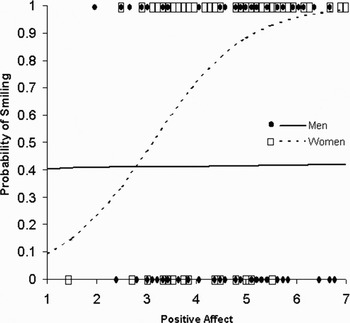
Consistent with the existing literature (e.g., LaFrance & Hecht 2000), there was a main effect for sex in the overall prevalence of smiling: 76% of women were smiling compared to only 41% of men (χ2 [1, 157]=19.26, p<.01). Men and women did not differ significantly in their levels of positive affect (Mwomen=4.46, SDwomen=1.04; Mmen=4.46, SDmen=1.10; t[155]=.01; NS) or negative affect (Mwomen=2.43, SDwomen=1.21, Mmen=2.28, SDmen=0.95; t[155]=.89, n.s.). Consistent with our hypothesis, smiling was correlated with positive affect in women (point-biserial r=.41; p<.01) but not in men (r=.01, n.s.). Conversely, smiling was negatively correlated with negative affect in men (r=−.51; p<.01) but not in women (r=−.05, n.s.). A binary logistic regression revealed that the interaction of sex and positive affect was a significant predictor of smiling (χ2=8.58 [1, 157]; p<.01; see Fig. 1).
Men's and women's probability of smiling as a function of positive affect. This plot is based on the results of two separate binary logistic regressions (one for men and one for women) predicting smiling from positive affect. The x-axis represents the possible range of positive affect scores, and the y-axis represents probability of smiling based on the results of the regressions. The individual dots represent data from individual men (circles) and women (squares) who did and did not smile. Smiling was coded as a binary variable, so the dots appear on the y=0 and y=1 lines.

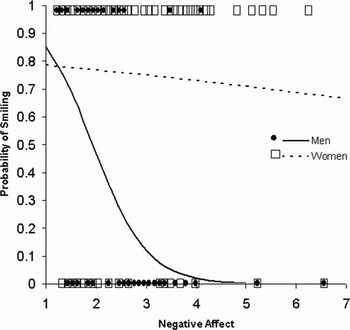
A separate binary logistic regression revealed that the interaction of sex and negative affect was also a significant predictor of smiling (χ2 [1, 157]=15.44; p<.01; see Fig. 2). In short, positive affect is a strong positive predictor of smiling for women but not for men, and negative affect is a strong negative predictor of smiling for men but not for women.
Men's and women's probability of smiling as a function of negative affect. This plot is based on the results of two separate binary logistic regressions (one for men and one for women) predicting smiling from negative affect. The x-axis represents the possible range of negative affect scores, and the y-axis represents probability of smiling based on the results of the regressions. The individual dots represent data from individual men (circles) and women (squares) who did and did not smile. Smiling was coded as a binary variable so the dots appear on the y=0 and y=1 lines.

These results support our hypothesis that smiling reflects different affective experiences for men and women. In line with Vigil's socio-relational framework, we propose that the sex difference observed here may reflect different strategies for enhancing fitness. Specifically, Vigil argues that the unique social constraints faced by women in a male-biased philopatry would create in women “a heavy reliance on behaviors designed to advertise their trustworthiness through higher levels of submissive displays” (sect. 3.1, para. 3). The strong relationship between smiling and positive affect in women suggests that, in women, smiling serves as a cue to trustworthiness by signaling warmth and enthusiasm (dimensions of positive affect), which serve to communicate a willingness to form intimate relationships.
Why might smiling be associated with lack of negative affect in men? According to Vigil, the evolutionary pressures faced by men may have led men to evolve a tendency to rely more heavily on capacity cues. Hence we propose that, in men, smiling may have evolved to signal confidence and calmness (i.e., lack of negative affect or self-doubt), which serve to attract numerous less-intimate relationships. In summary, the framework proposed by Vigil is corroborated by our findings that smiling reflects different affective states in men and women, and the framework also helps makes sense of the seemingly inconsistent findings in the literature on smiling and affect.