Nearly seventy years ago, the American Political Science Association’s Committee on Political Parties, chaired by E. E. Schattschneider, convened to discuss the failures of the American two-party system. The 1950 report issued by the Committee argued that the two political parties should adopt more clearly defined and ideologically distinct sets of principles because ‘when there are two parties identifiable by the kinds of actions they propose, the voters have an actual choice’.Footnote 1 The importance of providing voters with an ‘actual choice’ appears self-evident; when parties or candidates are distinguished by the principles they espouse, election outcomes have increased importance for the direction of public policy, and thus citizens play a greater role in influencing the policies that are enacted. Citizens are better able to choose parties and candidates that best represent their policy preferences and then hold them accountable for their records in office. As V. O. Key put it, ‘the people’s verdict can be no more than a selective reflection from among the alternatives and outlooks presented to them’.Footnote 2
Candidates and parties appear to have heeded the responsible party theorists’ recommendations. Measured by voting behavior in CongressFootnote 3 and electoral platforms,Footnote 4 voters’ choices are perhaps clearer than they ever have been. It is less clear, however, how this development affects voter decision-making. Does the nature of the electoral choice affect the choices voters make?
The conventional view is that increased ideological differentiation between candidates or parties enables citizens to make vote choices that are more influenced by the policy positions of the electoral competitors – a normatively desirable outcome, according to most democratic theorists. Consistent with this logic, previous work has found that the importance of ideological considerations in voter decision-making increases when candidates select more ideologically distinct electoral platforms.Footnote 5 As Wright and Berkman succinctly conclude: ‘Ideological choice produces ideological voters and ideological outcomes’.Footnote 6
In this article, I present an alternative argument that generates competing predictions. Drawing upon theories of group identity and motivated reasoning, I argue that increasing levels of candidate divergence in elections reduce voter responsiveness to policy considerations. As candidates diverge, voters are more inclined to engage in motivated reasoning based on salient political identities such as partisanship and ideological identification,Footnote 7 and thus the salience of these identities increases for vote choice. As a consequence, when candidates present voters with highly polarized choices, partisans are more likely to support copartisan candidates, and conservatives are more likely to support candidates who identify as conservatives, for instance, while also exhibiting decreased responsiveness to the relative configuration of candidate platforms.
The results from two observational datasets and an original, nationally-representative survey experiment address empirical limitations of prior research and provide strong support for this alternative explanation. I use joint estimates of candidate platforms and voter preferences to examine the vote choices made in fifty congressional races in 2006 and nearly 300 US House races in 2010, and evaluate how the level of ideological divergence affects the relationship between ideology and vote choice for more than 20,000 voters. In the survey experiment, respondents were randomized into conditions in which the hypothetical candidates adopted either highly convergent or highly divergent platforms, and were asked to evaluate the candidates. Across both sets of analyses strong and consistent evidence is found that vote choice is less responsive to candidate positioning in polarized contests than in races where the candidates’ policy positions were more convergent. The results have important implications for democratic accountability in an age of partisan polarization.
IDEOLOGICAL COMPETITION AND VOTER DECISION-MAKING
Elections provide citizens the opportunity to influence the course of public policy by choosing candidates and parties who promise to enact a voter’s preferred set of policies, or by re-electing an incumbent of whose performance the voter approves. Thus, as voters relate their preferred policies to those advocated by the candidates or parties,Footnote 8 election results reflect voters’ policy preferences. Indeed, policy considerations play a major role in affecting the choices voters make in elections across a wide variety of electoral contexts.Footnote 9
Moreover, standard models of voting behavior suggest that ideological considerations play a greater role in voter decision-making when the candidates are ideologically distinct. Because voters support the candidate whose issue positions best reflect their own views, voters are better able to distinguish the candidates and identify the one who most closely represents their preferences when candidates adopt distinct positions.Footnote 10 According to this view, then, ideological divergence between candidates enables voters to make qualitatively better voting decisions, and thus strengthen the link between collective preferences and electoral outcomes. The available evidence finds support for this contention, both in the United StatesFootnote 11 and cross-nationally.Footnote 12
However, existing empirical work on how ideological conflict conditions the relationship between ideology and vote choice is limited in two key ways. The first limitation concerns measurement. To examine the importance of ideology (or issue congruence) for vote choice, we need a measure of citizen and candidate ideology that is directly comparable, but such a measure is not found in existing work. For instance, Wright and Berkman use the coefficient as an indicator of whether a respondent identifies as liberal, moderate, or conservative, to compare how strongly ideology is associated with vote choice based on the level of divergence between candidates,Footnote 13 while Ensley uses surveys of Senate candidates’ campaign managers and voter self-reports of ideology.Footnote 14 In addition, voter perceptions of candidate ideology may be biased due to motivated reasoning or projection effects,Footnote 15 while citizens may use ideological self-placement items in different ways because citizens have different ideas about what it means to be a liberal, or conservative, or moderate, thus creating a high degree of measurement error.Footnote 16 Second, because strategic candidates are likely to choose their platforms with some expectation about how voters will be likely to respond, it is unclear whether ideological divergence plays the causal role that is hypothesized.
CANDIDATE DIVERGENCE, PARTISAN IDENTITY, AND VOTE CHOICE
Here I present an alternative argument, in which I claim that increased policy divergence between candidates increases the use of motivated reasoning and thereby reduces voters’ sensitivity to policy-based considerations for vote choice. In particular, I argue that because increased divergence between candidates increases the stakes associated the electoral outcome,Footnote 17 voters are more likely to make voting decisions based on their social group identifications as divergence increases. Political identifications including partisanshipFootnote 18 and ideologyFootnote 19 are imbued with deep social group attachments, which have wide-ranging effects on attitudes and behavior, and are perhaps the most important group attachment for political decision-making. Just as subjects in social psychology experiments exhibit substantial differences in attitudes toward out-groups on the basis of even the most trivial group characteristics,Footnote 20 partisan and ideological identities influence how individuals perceive events,Footnote 21 form economic assessments,Footnote 22 and evaluate political candidates.Footnote 23
The salience of political identity for political decision-making, moreover, is likely to increase as the stakes of an election outcome increases, and thus increase partisans’ support for co-partisan candidates and ideologues’ support for candidates who identify similarly. Social identity theoryFootnote 24 suggests that partisanship and ideology, for instance, affect both how an individual evaluates the in-group and the out-group candidate. As candidate divergence increases, partisans and ideologues are likely to increase evaluations of their co-partisan or co-ideologue candidate and decrease evaluations of the candidate from the out-group.Footnote 25 Thus, using processes of motivated reasoning, in which voters are inclined to make decisions that support their pre-existing beliefs and biases, increased divergence between candidates leads voters to make voting decisions that exhibit relatively less responsiveness to the ideological positions of the candidates.
The increased salience of political identities as candidate divergence increases can also be viewed through the lens of valence politics. As candidate divergence increases, the account above suggests, valence voting may also increase. This expectation is generally consistent with a model by Londregan and Romer, in which candidates choose increasingly divergent platforms when voters place increased weight on valence characteristics.Footnote 26 Recent scholarship in comparative politics provides empirical support for this expectation; for instance, Clark and Leiter find that the importance of the valence dimension increases with the dispersion of parties’ ideological positions,Footnote 27 while Ezrow, Tavits and Homola show that the relationship between mass preferences and election results attenuates with increases in valence factors, such as partisanship.Footnote 28
The use of motivated reasoning in political decision-making as a function of increased candidate divergence is generally consistent with theories of directional voting.Footnote 29 According to the directional theory of voting, citizens choose to support candidates whose policy positions occupy the same side of the political spectrum as themselves. Under motivated reasoning, liberals are more inclined to support liberal candidates, and Democratic voters are more inclined to support Democratic candidates, which bears a close similarity to predictions from directional theory. Thus, it is possible that increased ideological divergence between candidates changes the decision rule that voters use when deciding which candidate to support, at least among particular groups of voters.Footnote 30
EMPIRICAL EXPECTATIONS
The argument I present generates two testable hypotheses. First, the importance of policy considerations for vote choice should attenuate as ideological divergence increases between candidates. That is, as candidates offer increasingly polarized choices, voters place less weight on ideological considerations. Suppose the preferences of a voter and two candidates were represented along the real line, where the voter is located 1 unit away from the first candidate and 2 units away from the second candidate. Thus, the first candidate has a 1 unit proximity advantage relative to the second candidate. Holding fixed the value of this proximity advantage, I expect that voters will exhibit decreased responsiveness to this quantity as the candidates’ actual locations are increasingly divergent.
Second, the relationship between policy preferences and vote choice should be attenuated among voters with stronger political identities. For instance, lacking an attachment to either political party, Independents should not be expected to engage in partisan motivated reasoning, and thus the relationship between policy preferences and vote choice should be conditioned by candidate divergence to a reduced degree among these voters. Similarly, in contrast with individuals who identify as political moderates, liberals and conservatives have distinct political identities,Footnote 31 and thus should exhibit greater sensitivity to the level of divergence between competing political candidates.
Recent literature has found support for similar hypotheses in altogether different settings. In a novel laboratory experiment, Harrison found that subjects primed to think about high (as opposed to low) levels of elite polarization placed significantly more emphasis on their partisan identity when forming evaluations of presidential job performance.Footnote 32 Likewise, Druckman, Peterson and Slothuus found that elite polarization led respondents to make greater use of partisan motivated reasoning when evaluating presidential performance or forming attitudes toward public policy, and resulted in lower-quality opinion formation.Footnote 33 And in an experiment in Argentina, Lupu found that divergence between parties strengthens citizens’ partisanship.Footnote 34 Thus, the increased bias brought about by the decision contexts in these studies may also be found when examining how voters make voting decisions when candidates present voters with highly polarized policy platforms.Footnote 35
As noted above, however, the argument advanced here generates predictions that contrast with the conventional view that clearer choices between candidates or parties strengthen the relationship between ideology and voter decision-making.Footnote 36 The account I offer also suggests that the effects of candidate divergence on vote choice are more widespread than acknowledged by other accounts of the relationship between elite polarization and political behavior. Most notably, the conflict extension perspective proposes that elite polarization has had only a limited effect among the mass public, affecting mainly those citizens with strong partisan ties and who are aware of their party’s positions.Footnote 37 Extending this view to the electoral context, the conflict extension perspective suggests that relatively few citizens’ decisions are affected by candidate divergence. It is worth noting, however, that both the account I have provided here and the conflict extension perspective agree that the effects of elite polarization are concentrated among voters with the strongest political identities.
EMPIRICAL STRATEGY
I conducted two complementary studies to address the challenges outlined above and evaluate how ideological divergence affects the quality of voter decision-making. In the first, I combine observational data the from Cooperative Congressional Election Studies with data on US House candidate platforms collected by Project Vote Smart to develop joint estimates of candidate and citizen ideology that can be directly compared. These estimates allow me to evaluate the role of ideology in citizens’ vote choices and whether its effect is conditioned by the level of candidate divergence in a citizen’s local House election. The extremely large sample sizes also allow me to examine how these relationships vary among key subgroups of citizens. It bears mentioning, however, that congressional elections may represent a tough test of the account offered in this article. Congressional candidates suffer from relatively low levels of name recall and recognition,Footnote 38 and voters are often not well-informed about the candidates’ records.Footnote 39 The relatively low salience of congressional elections, then, would seem to weigh against finding evidence of any relationship at all between candidate divergence and vote choice.
The second study is a survey experiment that provides causal leverage for identifying the effect of candidate divergence on vote choices. I randomized a nationally-representative sample of nearly 2,000 American adults into one of two hypothetical electoral contests, where the key manipulation is the level of ideological divergence between candidates. Candidate positions were measured along the same eleven-point ideology scale on which respondents had also placed themselves.
The combination of these two studies provides a powerful means for assessing the hypotheses described above. The key variables are similarly constructed across the studies, and the analytic strategy borrows from simple proximity models of vote choice and recent empirical work.Footnote 40 In particular, I assume that candidate and voter preferences can be represented along a single ideological dimension, and that the role of ideology for vote choice can be assessed by examining whether voters support the more ideologically proximate candidate. This empirical approach allows me to address limitations of the prior work discussed above, and consistent results across both sets of analyses increase confidence in and generalizability of the findings.
EVIDENCE FROM CONGRESSIONAL ELECTIONS
To examine whether ideological divergence conditions the role of policy considerations in voter decision-making, I use joint estimates of candidate and citizen ideology calculated with data from Project Vote Smart and the 2010 Cooperative Congressional Election Studies (CCES). The estimates of congressional candidate ideology were derived from surveys conducted by Project Vote Smart that contained approximately 150 policy-oriented questions.Footnote 41 Project Vote Smart provided data for both major party candidates in 288 districts.Footnote 42 Importantly, the 2010 Cooperative Congressional Election Study asked respondents a number of policy questions that matched (or nearly matched) the text of questions that appeared on the Vote Smart survey.Footnote 43 These common questions helped form a common ideological space in which preferences for both citizens and candidates were estimated.
Though the Project Vote Smart and the CCES provided information about a large number of candidates, districts, and respondents in 2010, I supplemented the 2010 analysis with data from the same sources for the 2006 congressional elections.Footnote 44 The differing electoral contexts between 2006 (a strong Democratic year) and 2010 (a strong Republican year) provide a way of exploring the generalizability of the relationship between candidate divergence and vote choice. Data from Project Vote Smart provided information about fifty pairs of candidates, and the CCES provided information about vote choice for 1,730 respondents who resided in those districts.Footnote 45 Measured by presidential and congressional election results, electoral competitiveness, and the proportion of open-seat contests, the districts included in the analysis are generally representative of the congressional districts with contested elections in 2006 and 2010.Footnote 46 Most congressional elections are rather uncompetitive, including most of the elections included in the sample; however, limiting the analysis to only the electorally competitive districts in the sample produces similar results to those reported in the text below.Footnote 47
Following the approach in related research,Footnote
48
the indicators of candidate and respondent policy preferences are used to generate common-space estimates of ideology with a Bayesian item-response model.Footnote
49
The model assumes that citizen and candidate preferences are characterized by quadratic utility functions, where each individual i decides whether to support (y
ij
=1) or oppose (y
ij
=0) policy position j. This specification produces a probit model,
 $P(y_{{ij}} {\rm {\,\equals}}1){\rm {\,\equals\,}}\Phi \,(\beta _{j} \,x_{i} {\minus}\alpha _{j} )$
, where β
j
describes how well item j distinguishes liberals from conservatives, α
j
characterizes the location of a respondent who is indifferent between supporting and opposing the proposal in item j, and x
i
is individual i’s ideal point. The model was identified by constraining the estimates to have mean 0 and unit variance, and the estimates were post-processed so that larger estimates reflected more conservative ideologies.Footnote
50
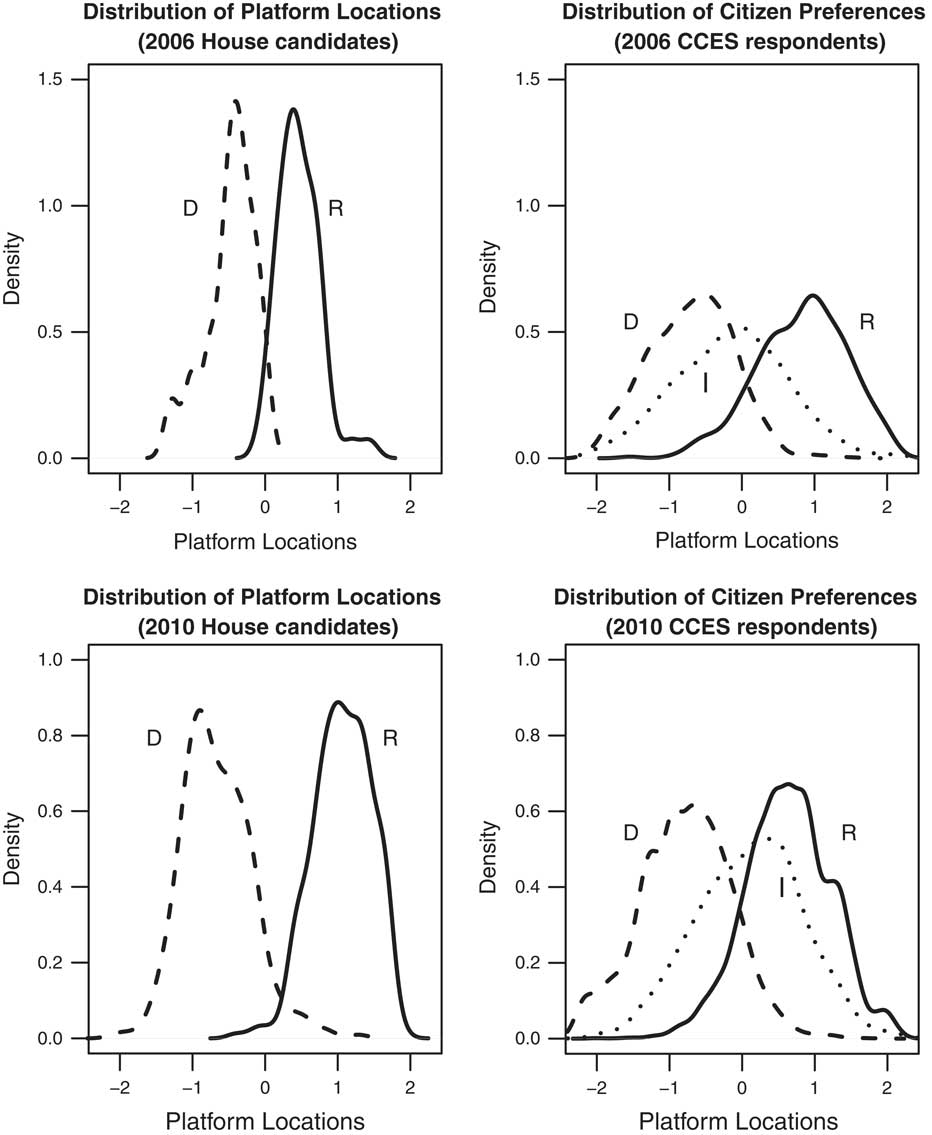
The distributions of the estimates for candidates and voters in the 2006 and 2010 data used here are shown below in Figure 1. Generally speaking, the estimates range between −2 and +2. As the plots on the left show, most Democratic candidates were to the ideological left of most Republican candidates. The plots on the right show that Democratic voters were generally more liberal than Republican voters, with Independents located somewhere in between. The figure also reveals that there is considerably less partisan overlap in ideology between candidates than among voters, though some voters are also more ideologically extreme than the candidates.
Candidate platforms Distributions of candidate and voter ideology in the 2006 and 2010 congressional elections. The plots on the left show the distributions of platform estimates for House candidates based on responses to the Project Vote Smart Political Courage Test. The plots on the right show the distributions of ideology estimates for respondents to the Cooperative Congressional Election Study. Republican candidates and respondents are shown with the solid lines (and denoted by ‘R’), Democratic candidates and respondents are shown with the dashed lines (and denoted by ‘D’), and Independent respondents are shown with the dotted lines (and denoted by ‘I’).

Using these estimates, I calculate the Republican candidate’s spatial advantage (Republican advantage) for each voter using the formula
 $(x_{{D_{i} }} {\minus}x_{i} )^{2} {\minus}(x_{{R_{i} }} {\minus}x_{i} )^{2} $
, where x indicates ideological locations, and D, R, and i index the Democratic candidate, Republican candidate, and the CCES respondents, respectively.Footnote
51
The dependent variable is an indicator for whether the respondent reported voting for the Republican House candidate.Footnote
52
I begin by estimating a logistic model of vote choice in which I allow the intercept and the coefficient for Republican advantage to vary by congressional district. The varying-intercept term characterizes district-specific differences in the tendency to support Republican candidates, and the varying-coefficient allows me to evaluate how much variation there is across districts in the relationship between ideological proximity and voting decisions. The coefficient for Republican advantage is expected to be positive, and I expect its magnitude to vary in accordance with the level of candidate divergence in the district election. I also include a varying-intercept for states, and controls for age, education, income, sex, race, and partisanship (ranging from 1 to 7, where 1 refers to a strong Democrat and 7 refers to a strong Republican). I also include a variable, Incumbent party, that takes a value of +1 if the Republican incumbent seeks re-election, −1 if the Democratic incumbent seeks re-election, and 0 if it is an open-seat contest.
The results for 2006 and 2010 are shown in columns (1) and (2), respectively, of Table 1.Footnote 53 The results show that first, spatial proximity, plays a statistically and substantively significant role in vote choice. Even when controlling for party identification and other demographic variables, the probability of supporting a Republican candidate increases strongly as the Republican candidate enjoys a proximity advantage relative to the Democratic candidate. In the bottom panel of the table, the estimates for σα j and σβ j are just as interesting. These entries describe the variation of the district-specific intercepts and slopes for Republican advantage around the overall averages reported in the table.
Candidate Divergence, Ideology, and Vote Choice in Congressional Elections

Data: 2006 and 2010 Cooperation Congressional Election Study. The dependent variable is whether respondents reported voting for the Republican House candidate. Entries are logistic regression coefficient estimates and standard errors, with varying intercepts by states and congressional districts, and varying slopes for candidate divergence across districts. * Denotes p<0.05, two-tailed tests.
As an initial inspection of how candidate divergence may condition voter responsiveness to policy congruence, I compare these district-specific estimates of Republican advantage to the level of candidate divergence in the district. The level of ideological divergence between candidates running in the same election is characterized by the absolute value of the difference between the candidates’ ideology scores. For instance, if the Democratic candidate’s platform estimate is −1, and the Republican candidate’s platform estimate is +1, the value of Divergence is 2. Higher values of Republican advantage indicate that vote choices in that district reflected a stronger association between policy preferences and vote choice. Consistent with the argument presented in this article, across both election years the correlation between candidate divergence and the district-level coefficients for Republican advantage is negative, indicating that on average, the relationship between vote choice and policy preferences attenuates in districts as the level of candidate divergence increases.Footnote 54
While these results show evidence of an association between the average importance of ideological proximity within districts and the degree of candidate divergence in those same districts, I now model this relationship directly. I include Divergence in a model similar to those estimated above; in particular, the model takes the form:
 $$\matrix{ {Pr(y_{i} )}\!\!\! & {{\rm {\equals\,}}\:{\rm logit}\:^{{{\minus}1}} \{ \alpha _{{j[i]}} {\plus}\alpha _{{k[i]}} {\plus}\beta _{{j[i]}} Republican\,advantage_{i} {\plus}{\bf{X}} {\bf \Omega } {\plus}{\epsilon}_{i} \} ,} \hfill \cr {\alpha _{j} }\!\!\!\!\!\!\!\!\!\!\! & {{\rm {\equals\,}}\delta _{0}^{\alpha } {\plus}\delta _{0}^{\alpha } Divergence_{j} {\plus}\eta _{j}^{\alpha } } \hfill \cr {\alpha _{k} }\!\!\!\!\!\!\!\!\!\! & {{\equals\,}\delta _{0}^{\omega } {\plus}\eta _{k}^{\omega } } \hfill \cr {\beta _{j} }\!\!\!\!\!\!\!\!\!\! & {{\equals\,}\delta _{0}^{\beta } {\plus}\delta _{0}^{\beta } Divergence_{j} {\plus}\eta _{j}^{\beta } .} \hfill \cr {} \hfill & {} \hfill \cr } $$
where i, j, and k index individuals, congressional districts, and states, respectively; y is an indicator for whether the voter supported the Republican candidate; α j and α k are the mean district-level and state-level intercepts; β j is the mean district-level slope for Republican advantage; X is the matrix of controls discussed above; Ω is a vector of coefficients for these controls; and ε i is a random error term. Here, Divergence is used to model both the district-specific intercepts (line 2 of Equation 1) and, more importantly, the district-specific slopes of Republican advantage (line 4 of Equation 1). This latter characterization is akin to interacting the individual-level predictor Republican advantage with the district-level predictor Divergence. To recall, the key hypothesis is that for a given value of Republican advantage, the relationship between this variable and vote choice is smaller in polarized races than in convergent elections. A negative coefficient on the interaction between Republican advantage and Divergence would provide support for this hypothesis.
The results are shown in columns (3) and (4) of Table 1. Across both election years, Republican advantage remains strongly associated with vote choice. In the main, however, Divergence has little, if any, association with vote choice; the coefficient for 2006 is negative, while the coefficient for 2010 is positive, though both are statistically indistinguishable from 0. More importantly, however, in the analyses for both 2006 and 2010, the coefficients for the interaction between Divergence and Republican advantage are negative and statistically significant. Thus, while vote choice is strongly associated with a voter’s policy congruence with the congressional candidates, this relationship attenuates significantly as the level of ideological divergence between the candidates increases.
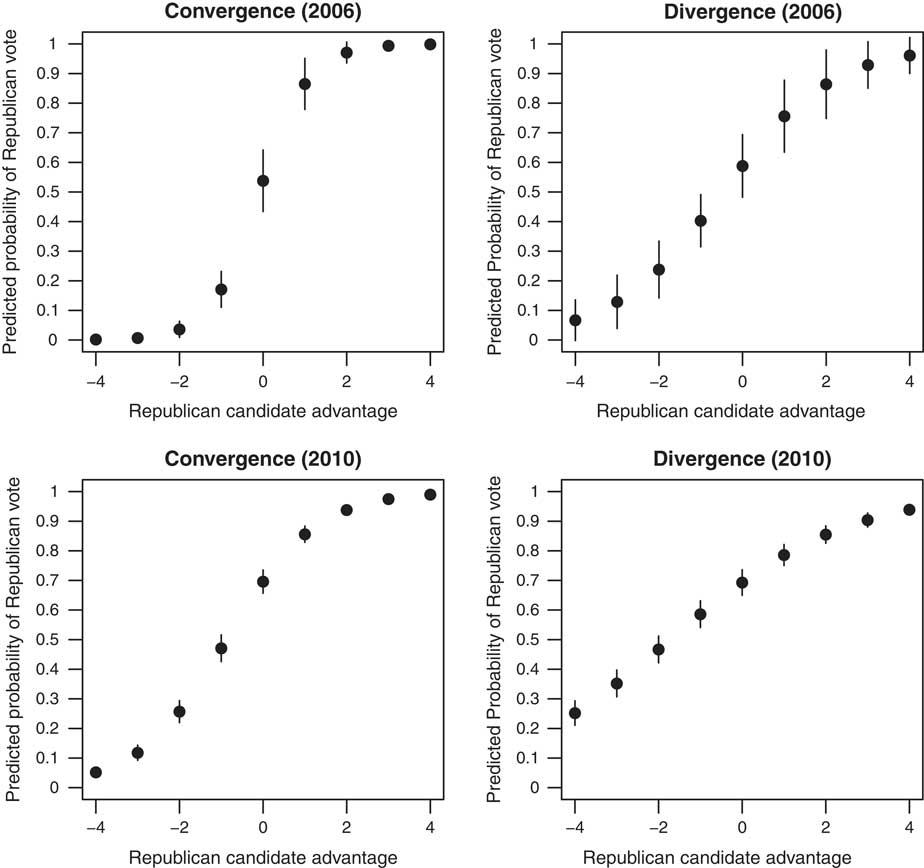
To illustrate the substantive magnitude of the results, Figure 2 shows the predicted probability of a Republican congressional vote for various levels of Republican advantage (shown along the x-axes) and Divergence from the models shown in columns (3) and (4) above, while holding the other predictors at their mean values. The plots on the left show the predicted probabilities of voting for the Republican candidate when candidate divergence is at its 10th percentile value (0.48 and 0.99 for 2006 and 2010, respectively), and the plots on the right show the predicted probabilities of voting for the Republican candidate when divergence is at its 90th percentile value (1.42 and 2.47, respectively). The vertical lines show the 95 percent confidence intervals.
Candidate divergence, ideological proximity, and vote choice Plots show the predicted probabilities of voting for the Republican House candidate in the 2006 and 2010 congressional elections across a range of values of relative proximity to the Republican candidate. The plots on the left show the predicted probabilities when candidate divergence is at its 10th percentile value, and the plots on the right show the predicted probabilities when divergence is at its 90th percentile value. All other variables are held at their mean values. The vertical lines are the 95 percent confidence intervals (confidence intervals for 2010 are too small to observe). Across both election years, while the probability of voting for the Republican candidate increases as the Republican candidate’s proximity advantage increases, vote choice is more sensitive to policy proximity among voters when the candidates are relatively ideologically convergent.

The patterns are consistent across both election years. First, across all four plots, the probability of voting Republican increases as the voter’s policy preferences are more congruent with the Republican candidate’s ideology than the Democratic candidate’s ideology. Importantly, however, in both election years the slope of these relationships varies based on whether the candidates adopted more convergent or more divergent platforms. In particular, the slopes are considerably steeper among voters in the Convergence conditions than they are for voters in the Divergence conditions, suggesting that vote choice is more responsive to policy proximity when the candidates are relatively convergent.
This pattern has important implications for evaluating voter decision-making. For instance, consider the example of a voter who is 1 unit more proximate to the Democratic candidate than she is to the Republican candidate, which corresponds to a value of −1 along the x-axes in Figure 2. Using the 2006 data, this voter would vote for the Republican candidate with probability 0.17 (SE=0.03) in the Convergence condition, but would vote for the Republican candidate with probability 0.40 (SE=0.05) in the Divergence condition. Thus, to the extent that voting for the Republican candidate would constitute an ‘error’ by this voter, increasing the degree of ideological divergence from its 10th percentile value to its 90th percentile value increases the probability of an error by 23 percentage points (SE=5.9 percentage points).
The results are similar when examining a similarly-positioned voter in the 2010 congressional elections. Again consider a voter for whom the Democratic candidate is 1 unit more proximate relative to the Republican candidate. At relatively low levels of divergence, as the bottom-left plot shows, the probability of supporting the Republican candidate is 0.47 (SE=0.02). At relatively high levels of divergence, though, the probability of voting for the Republican candidate is 0.59 (SE=0.02). Thus, increased ideological divergence between the candidates decreases the probability that the voter chooses the more proximate candidate by approximately 12 percentage points (SE=3 percentage points). Across both election years, voters at a fixed level of ideological proximity to the candidates exhibit less responsiveness to candidate positions when the candidates are relatively divergent. The results shown in Table 1 and displayed graphically in Figure 2, therefore, provide strong support for the theoretical account presented above, in which increasing policy differences between candidates weaken voter responsiveness to the candidates’ ideological locations.
The results presented above are robust to accounting for differences across districts in the relative scale of the Republican advantage variable. First, I estimated the models shown in columns (3) and (4) of Table 1 using only those voters whose policy-based estimates were internal to the candidates’ policy estimates. Second, I estimated models using only those respondents whose policy-based estimates fell between −1 and +1, inclusive, which identifies the voters who generally occupy the center of the ideological space. Focusing on these two subsets of voters ameliorates concerns that the interactive term between Divergence and Republican advantage is simply making an adjustment for differences in the possible range of values that Republican advantage can take due to the values of Divergence, and would be driven mostly by voters whose policy preferences lie exterior to the candidates’ and thus far from the center of the ideological space. In all cases, the results strongly parallel those shown in Table 1 above.Footnote 55 Thus, even when accounting for potential differences in scale for the possible range of values that Republican advantage can take, I find consistent evidence that, holding constant the value of Republican advantage, this variable exerts a smaller effect on vote choice when candidates choose divergent platforms. Moreover, these results are robust to assumptions about functional form, as substantively identical results are obtained when using the probit link function or estimating linear probability models.
Moreover, the conclusions from Table 1 are unchanged when accounting for a completely different voter decision rule. For instance, conclusions about how polarized choices reduce voter responsiveness to the candidates’ policy positions could be suspect if voters are employing ideological considerations in their voting decisions, but simply are using ideology in a way other than that posited here through the use of the proximity model. I considered the possibility that voters used ideology in the way posited by the directional model.Footnote 56 Directional theory posits that voters prefer candidates who are on their side of an issue.Footnote 57
To perform these tests, I used the 2010 CCES data and characterized the location 0 as a plausible ‘neutral point’, as required by the directional model, and calculated the midpoint between the candidates in each congressional district. The directional model makes distinct predictions from the proximity model only for those respondents whose preference estimates are located between the neutral point and the candidate midpoint.Footnote 58 I then re-estimated the model shown in column (4) of Table 1, first on the subset of voters (N=2,381) whose preferences fall between the neutral point and the midpoint, and then for the voters (N=18,456) whose preferences are exterior to this region. These supplementary analyses generate patterns that are substantively identical to those shown in Table 1, and indicate that the results shown in Table 1 are not sensitive to the inclusion of voters who may use different decision rules.Footnote 59
I also explored the possibility that the interaction between Republican advantage and Divergence could be curvilinear. For instance, Downs and responsible party theorists argued that policy voting required at least some minimal level of policy differentiation between candidates or parties.Footnote 60 Thus, it is possible that divergence could increase responsiveness to policy considerations at low levels of divergence, and then decrease responsiveness at higher levels of divergence. Thus, I estimated models similar to Equation 1 in which I also included the squared value of Divergence and its interaction with Republican advantage. While I cannot rule out the possibility of such a curvilinear relationship, the results also do not provide any convincing evidence in support of it.
POLARIZED CHOICES, PARTISAN LOYALTIES AND VOTE CHOICE
In addition to explaining how candidate divergence affects voter decision-making, the theoretical account offered in this article suggests that the effects of candidate divergence should be concentrated among particular groups of voters. In particular, if ideological conflict increases the use of motivated reasoning and increases the salience of partisan identity, divergence should attenuate the relationship between policy preferences and vote choice among partisans, while Independents should not be sensitive to the level of ideological divergence because they do not have a partisan identity to ‘anchor’ their decisions, nor would they be expected to engage in partisan motivated reasoning.
I use the 2010 CCES to identify whether the patterns shown above differ based on partisan attachments, and estimate the models shown in column (4) of Table 1 separately for partisans and Independents.Footnote 61 I define an ‘Independent’ as a respondent who places herself at the midpoint of the seven-point party identification scale; thus, ‘leaners’ are classified as partisans. Based on the account offered in this article, if high levels of candidate divergence attenuate the relationship between ideology and vote choice by also increasing the level of partisan conflict, I expect divergence to reduce the association between ideology and vote choice to a much greater degree among partisans than among Independents.
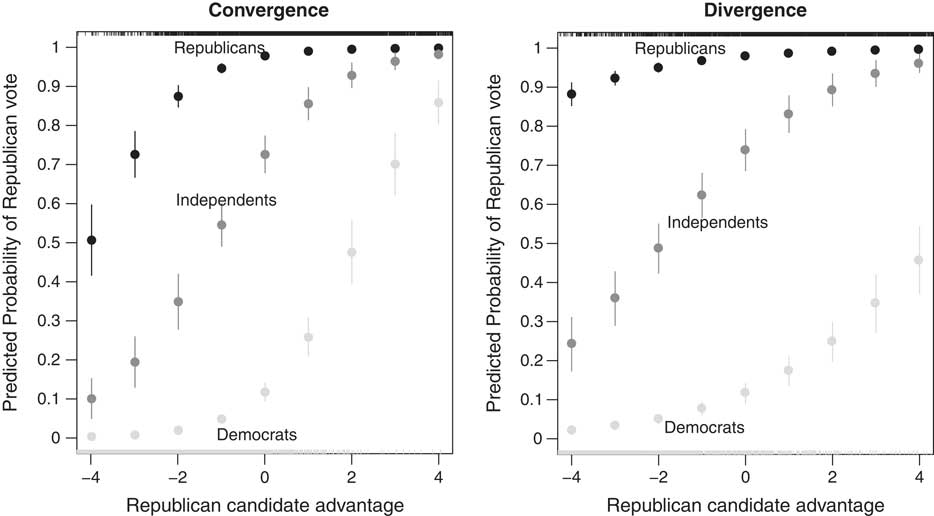
The results are presented graphically in Figure 3 below, where I plotted the predicted probability of a Republican vote at the 10th and 90th percentile values of Divergence across a range of values of Republican advantage. In doing so, I generated separate estimates for ‘strong Democrats’, ‘strong Republicans’, and Independents. To examine the hypothesis described above, I expect the probability of a Republican vote to differ substantially between Democrats and Republicans across the two levels of Divergence, but expect a more limited difference among Independents. The plotted points are the predicted probabilities and the vertical lines are the 95 percent confidence intervals (note that some probabilities are estimated very precisely so as to appear to lack confidence intervals).Footnote 62
Candidate divergence, partisanship, and vote choice in the 2010 congressional elections Plots show the predicted probabilities of voting for the Republican House candidate in the 2010 congressional elections across a range of values of relative proximity to the Republican candidate. The plots on the left show the predicted probabilities when candidate divergence is at its 10th percentile value, and the plots on the right show the predicted probabilities when divergence is at its 90th percentile value. All other variables are held at their mean values. The vertical lines are the 95 percent confidence intervals. Republican identifiers are shown in black, Independents are shown in medium gray, and Democratic identifiers are shown in light gray. The tick marks at the top and bottom of the plots show the distribution of Republican and Democratic respondents, respectively, across the values of Republican advantage in districts where the value of Divergence is below the median level (left plot) and above the median level (right plot). Partisans are more likely to vote for their copartisan candidate (and thus less responsive to policy differences) when candidates are divergent than they are when candidates are more convergent.

Across Republicans, Democrats, and Independents alike, the probability of casting a Republican vote increases with the Republican candidate’s proximity advantage for the voter. Consistent with other work that investigates partisan bias in presidential vote choice,Footnote 63 Independent voters make voting decisions that are most consistent with a basic proximity model of vote choice. Partisans, by contrast, are more likely to vote for the copartisan candidate.
Three clear patterns emerge from Figure 3 that are directly relevant for assessing the theoretical account offered in this article. First, a simple visual inspection reveals that vote choice among all voters is more sensitive to candidate positioning when the candidates are relatively convergent. The slope of the predicted probabilities is steeper in the plot on the left than in the plot on the right. Second, the decrease in sensitivity to candidate positioning in the plot on the right is considerably greater among Republicans and Democrats than it is among Independents.
Third, and perhaps most interestingly, when the candidates are relatively divergent, there is virtually no chance that partisans will cross party lines and vote for the candidate of the opposite party. Consider a Republican identifier for whom the Democratic candidate is 2 units more proximate than the Republican candidate (Republican advantage=−2).Footnote 64 When the candidates are relatively convergent, the predicted probability that this voter casts a vote for the Republican candidate is 0.88 (SE=0.01). But when the candidates are relatively divergent, the probability of a Republican vote is 0.95 (SE=0.01). Thus, though both voters are very likely to vote for the Republican candidate even though the Democratic candidate is more ideologically proximate, the probability of voting for the less proximate candidate is 7.4 percentage points higher (SE=1.3 percentage points) when the candidates are relatively divergent.
Similar patterns are found for Democrats. Consider a Democratic voter for whom the Republican candidate is 2 units more proximate related to the Democratic candidate (Republican advantage=2). The probability of a Republican vote is 0.48 (SE=0.04) when the candidates are relatively convergent, and 0.25 (SE=0.03) when the candidates are relatively divergent. Thus, the probability of voting for the less proximate candidate increases by 22.8 percentage points (SE=4.5) as Divergence increases from its 10th to 90th percentile levels. Among Independents, the probability of voting for the less proximate candidate is also greater when candidates are more divergent (and for all values of Republican advantage), the difference in probabilities ranges from 0.01 to 0.16, while it ranges from 0 to 0.38 for Republicans and 0 to 0.40 for Democrats.
As an alternative means of assessing how the relationship between policy responsiveness and candidate divergence varies based on partisanship, I estimated the models shown in Table 1 while also interacting an indicator for whether respondents identified as a partisan with both Republican advantage and Divergence.Footnote 65 If the decrease in policy responsiveness is most substantial among partisans, the triple interaction term should be negative.Footnote 66 Indeed, this is what I find. Though candidate divergence reduced policy responsiveness among all respondents, it did so to a greater extent among partisans than among non-partisans.Footnote 67 This additional analyses lends further support for the account offered here.
Across two election years, using data on more than 20,000 respondents and 600 congressional candidates, the results demonstrate that the nature of electoral choices affects the kinds of electoral decisions citizens make. In particular, high levels of ideological divergence between candidates reduce voters responsiveness to policy congruence. Moreover, these effects are found primarily among partisans, while Independents’ vote choices appear to be less sensitive to the relative level of ideological divergence between competing candidates. Thus, on the basis of these results it appears that high levels of ideological conflict lead partisan voters to make decisions that place increased emphasis on their partisan ties, and less emphasis on the relative degree of congruence between their policy views and the candidates’ platforms.
EXTENSION: EXPERIMENTAL RESULTS
The results above, while quite consistent with the theoretical account presented in this article, cannot definitively identify a causal relationship between ideological divergence and political decision-making. The primary concern is that political elites, parties, and candidates are likely to make strategic choices based on their expectations of how the public will respond.Footnote 68 To rule out possible challenges to identification, I examine evidence from a survey experiment.
The survey was administered to a nationally representative sample of 1,997 adults.Footnote 69 Following the design found in Tomz and Van Houweling,Footnote 70 respondents were first asked to place themselves along an eleven-point ideological scale, ranging from −5 (extremely liberal) to +5 (extremely conservative). Each point along the scale was labeled numerically, and the ends (‘extremely liberal’ and ‘extremely conservative’) and the midpoint (‘moderate/middle of the road’) had qualitative descriptions.Footnote 71 Respondents were then introduced to two hypothetical candidates, candidate A and candidate B. Respondents were shown the candidates’ positions on the same eleven-point scale along which respondents placed themselves. The key experimental manipulation was the level of ideological divergence between the candidates. The respondents were randomized to a condition in which the candidates chose nearly convergent locations (−1 and +1) or highly divergent positions (−4 and +4).Footnote 72
After viewing the candidates, respondents were then asked to indicate whether they preferred candidate A or candidate B. I then compared respondents’ candidate preferences to the predictions from a simple proximity model of vote choice. Because respondents reported their ideological orientation along the same scale on which candidate locations were displayed, these quantities can be directly compared. In particular, respondents who place themselves at 0 should be indifferent between the candidates, as their location is equidistant from both of the candidates’ locations. Respondents with ideal points less than 0 are expected to support candidate A, and respondents with ideal points greater than 0 are expected to support candidate B.
At the outset, I note that the experimental set-up is not directly comparable with real-world electoral campaigns. For instance, citizens in the real world rarely see the candidates’ policy locations presented in such an explicit fashion, though citizens may well glean information about the ideological differences between the candidates from news coverage and the campaigns themselves. Furthermore, no partisan information about the candidates was conveyed to the respondents, which may be a limitation for the purposes of establishing external validity, though voters may have inferred the candidates’ partisanship based upon their relative ideological placements. Alternatively, I expect that the experimental set-up motivated responses based on the strength of respondents’ ideological identities. Thus, the experiment complements the observational study by testing the theoretical account offered in this article in the context of an alternative salient political identity.
Table 2 below shows the results of an individual-level analysis of candidate preference as a function of ideological proximity and candidate divergence. The dependent variable is an indicator for whether the respondent preferred candidate A,Footnote 73 and the key independent variables are Candidate A advantage,Footnote 74 an indicator for assignment to the divergence condition (Divergence), and an interaction term between the two. Column 1 displays the results when only the three terms described above are included as covariates. Column 2 shows the results when a full battery of political and demographic control variables commonly included in models of vote choice (party identification, age, education, race, and gender) are also included in the model.Footnote 75 The results are quite consistent across both specifications. First, as the coefficients for Candidate A advantage indicate, ideological proximity significantly affects vote choice. The probability a respondent reported a preference for candidate A strongly increases in the spatial advantage that candidate A enjoyed relative to candidate B. Most importantly, and consistent with the findings from the observational study above, the coefficients for the interaction term are negative and statistically significant. Respondents who were assigned to the ideologically divergent candidates relied significantly less on ideological proximity when evaluating the candidates. Critically, these results hold up when focusing only on those respondents whose self-reported ideologies fall in between both sets of candidates, and whose placements range from −2 to +2. The results of these analyses are shown in columns (3) and (4).
Candidate Divergence, Ideological Proximity, and Vote Choice: Survey Experimental Results

Data: 2011 survey experiment administered by Knowledge Networks. The dependent variable is the probability of reporting a vote for candidate A. Entries are logistic regression coefficient estimates and standard errors. Demographic controls include partisanship, age, education, race, gender, and income. The first two columns show results for the entire sample of respondents. The last two columns show results for only those respondents whose ideological self-placements fall between −2 and 2, inclusive. * Denotes p<0.05, two-tailed tests.
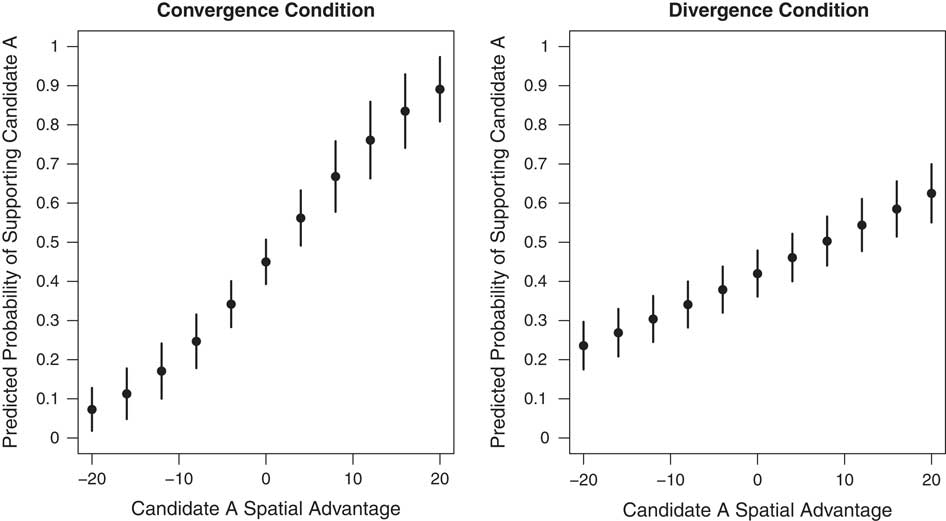
Figure 4 below graphically displays the substantive results. Using the estimates from column (2) in Table 2, the figure displays the predicted probabilities of supporting candidate A for the range of values of candidate A’s spatial advantage shared by respondents in both conditions.Footnote 76 Results for the convergence condition are shown on the left, and the divergence condition is shown on the right. Across both plots, the probability of supporting candidate A increases monotonically as candidate A’s spatial advantage increases, but the slope is considerably steeper for respondents in the convergence condition. While all respondents located to the left of the midpoint are expected to support candidate A, those in the divergence condition grant greater support to candidate B than do respondents in the convergence condition. Similar results characterize support for candidate A among respondents on the ideological right of the midpoint. Respondents in the convergence condition are considerably more sensitive to changes in ideological proximity; for instance, among respondents in the convergence conditions, the probability of supporting candidate A increases by 22 percentage points (from 0.34 to 0.56) as candidate A’s spatial advantage increases from −4 units to +4 units. The corresponding increase for respondents in the divergence condition, however, is 8 percentage points (from 0.38 to 0.46). Thus, for a given value of Candidate A advantage, candidate evaluations among respondents in the ideologically divergent condition reflected significantly less emphasis on ideological proximity.
Candidate divergence, spatial proximity, and vote choice in a survey experiment Predicted probability of supporting candidate A over a range of values of candidate A’s spatial advantage, while all other covariates are held at their means (dichotomous variables are held at their modes and categorical variables are held at their medians). The points represent the predicted probability of supporting candidate A, and the vertical lines are the 95 percent confidence intervals. Predicted probabilities are generated from the estimates shown in column (2) of Table 2.

As with the analysis of the observational data, the interaction effects between ideological proximity and candidate divergence are concentrated among individuals with the strongest political identities. I created an indicator for respondents who placed themselves at the most ideologically extreme points on the eleven-point scale (−5 and +5), and thus were external to both pairs of candidates, and estimated models similar to those shown in Table 2 but with the inclusion of a triple interaction between candidate divergence, candidate A’s ideological proximity, and the indicator for ideological extremity.Footnote 77 The interaction between Divergence and Candidate A advantage was negative, as it is in Table 2 above, but the triple interaction term is also negative, and indicates that the decreased in responsiveness to candidate positioning was especially large among respondents with the strongest ideological commitments.
The results from this survey experiment indicate clearly that high levels of ideological divergence between candidates play a causal role in weakening voter responsiveness to candidates’ policy positions. The experiment lacks many of the real-world qualities that characterize modern American elections; however, this focuses attention more directly on how ideologically divergent candidates affect decision-making. In doing so, the experimental results confirm the findings from the observational studies, providing powerful evidence about how ideological conflict affects political decision-making.
DISCUSSION AND CONCLUSION
This article finds that candidate ideology affects citizens’ voting decisions in important ways. First, citizens tend to support candidates who share their general ideological orientations. However, the degree to which voters respond to ideological congruence is conditioned by the nature of the electoral choice offered to voters. High levels of ideological divergence appear to decrease voters’ responsiveness to the ideological positions of the candidates, which thus raises questions about whether increased ideological conflict produces ‘ideological voters and ideological outcomes’.Footnote 78
These findings run contrary to the common theoretical intuition that election outcomes better reflect citizen preferences when clear and ideologically distinct electoral choices are offered, for which a considerable empirical literature finds support. Instead, the findings presented in this article are consistent with a theory that relates ideological polarization to salient political identities. When the level of conflict increases between elites, voters respond by increasing their support of the candidate who shares their partisan or ideological identity. The findings in this article support and extend those from other recent studies that demonstrate how ideological polarization affects citizen decision-making.Footnote 79
How the findings presented in this article bear on collective decision-making is somewhat less clear. The evidence clearly supports the contention that high levels of ideological divergence lead otherwise-similar voters to choose different candidates than they would if the candidates’ platforms were less polarized. On the whole, though, the magnitudes of the differences are relatively modest, which suggests that the substantive impact of ideological divergence on the election outcome, all else equal, is found mostly in close contests. Whether one candidate or party is systematically advantaged by the level of ideological divergence between the candidates remains an open question. It seems likely, however, that Independents and other voters without partisan loyalties, for instance, play a greater role in determining election outcomes between highly divergent candidates. In these contests, partisans are likely to dig in their heels and support their copartisan candidate, and thus the outcome of the election depends on the relative differences in the number of partisans from both sides, and the relative ideological proximity between Independent voters and the candidates. At the same time, elections between highly divergent candidates may be precisely those contests in which citizens without party attachments choose to sit out altogether due to their dissatisfaction with both candidates.
The results shown in this article raise questions about how well contemporary parties serve American democracy. ‘Resurgent’Footnote 80 and ideologically distinct parties may indeed send clearer cues about their programmatic commitments and facilitate the development of more ideological consistency among the mass public,Footnote 81 but they may also reshape how citizens make fundamental political decisions. Strong attachments on the basis of partisanship and ideology that persist as parties and candidates diverge may strengthen voters’ ability to use those identities as an effective heuristic for decision-making, and high levels of ideological divergence may provide a signal to voters that candidates are sincere in committed to the policies they advocate. At the same time, however, based on the results on this article, increased levels of divergence may also lead some voters to support candidates whose policy pronouncements are less consistent with voters’ preferences, particularly among voters with relatively moderate policy preferences.