




Crossref Citations

This article has been cited by the following publications. This list is generated based on data provided by Crossref.
Campbell, John P.
2015.
All General Factors Are Not Alike.
Industrial and Organizational Psychology,
Vol. 8,
Issue. 3,
p.
428.
Asendorpf, Jens B.
2016.
Causal Unity of Broader Traits is an Illusion.
European Journal of Personality,
Vol. 30,
Issue. 4,
p.
304.
Seltzer, Benjamin K.
Ones, Deniz S.
and
Tatar, Arkun
2017.
Using personality facets to understand the nature of personality-satisfaction relationships.
Career Development International,
Vol. 22,
Issue. 5,
p.
477.
Weiss, Alexander
Gale, Catharine R.
Čukić, Iva
Batty, G. David
McIntosh, Andrew M.
and
Deary, Ian J.
2019.
Conditioning on a Collider May or May Not Explain the Relationship Between Lower Neuroticism and Premature Mortality in the Study by Gale et al. (2017): A Reply to Richardson, Davey Smith, and Munafò (2019).
Psychological Science,
Vol. 30,
Issue. 4,
p.
633.
Wiernik, Brenton M.
and
Coovert, Michael D.
2019.
Games and Learning Alliance.
Vol. 11899,
Issue. ,
p.
560.
Padmanabhanunni, Anita
2019.
An examination of the psychometric properties and dimensionality of the Aggression-Problem Behavior Frequency Scale in a sample of Black South African adolescents.
South African Journal of Psychology,
Vol. 49,
Issue. 4,
p.
550.
Hill, W. David
Weiss, Alexander
Liewald, David C.
Davies, Gail
Porteous, David J.
Hayward, Caroline
McIntosh, Andrew M.
Gale, Catharine R.
and
Deary, Ian J.
2020.
Genetic contributions to two special factors of neuroticism are associated with affluence, higher intelligence, better health, and longer life.
Molecular Psychiatry,
Vol. 25,
Issue. 11,
p.
3034.
Bornovalova, Marina A.
Choate, Alexandria M.
Fatimah, Haya
Petersen, Karl J.
and
Wiernik, Brenton M.
2020.
Appropriate Use of Bifactor Analysis in Psychopathology Research: Appreciating Benefits and Limitations.
Biological Psychiatry,
Vol. 88,
Issue. 1,
p.
18.
Weiss, Alexander
and
Deary, Ian J.
2020.
A New Look at Neuroticism: Should We Worry So Much About Worrying?.
Current Directions in Psychological Science,
Vol. 29,
Issue. 1,
p.
92.
de Vine, Jenna B.
and
Morgan, Brandon
2020.
The relationship between personality facets and burnout.
SA Journal of Industrial Psychology,
Vol. 46,
Issue. 0,
Koc, Piotr
2021.
Measuring Non-electoral Political Participation: Bi-factor Model as a Tool to Extract Dimensions.
Social Indicators Research,
Vol. 156,
Issue. 1,
p.
271.
Wiernik, Brenton M.
Raghavan, Mukhunth
Caretta, Thomas R.
and
Coovert, Michael D.
2022.
Developing and validating a serious game‐based assessment for cyber occupations in the US Air Force.
International Journal of Selection and Assessment,
Vol. 30,
Issue. 1,
p.
27.
Wilmot, Michael P.
and
Ones, Deniz S.
2022.
Agreeableness and Its Consequences: A Quantitative Review of Meta-Analytic Findings.
Personality and Social Psychology Review,
Vol. 26,
Issue. 3,
p.
242.
Hall, Amy A.
Morgan, Brandon
and
Redelinghuys, Kleinjan
2022.
The relationship between job-hopping motives and congruence.
SA Journal of Industrial Psychology,
Vol. 48,
Issue. ,
Coovert, Michael D
and
Bennett, Winston
2022.
The importance of identifying the dimensionality of constructs employed in simulation and training for AI.
The Journal of Defense Modeling and Simulation: Applications, Methodology, Technology,
Vol. 19,
Issue. 2,
p.
229.
Redelinghuys, Kleinjan
and
Morgan, Brandon
2023.
Psychometric properties of the Burnout Assessment Tool across four countries.
BMC Public Health,
Vol. 23,
Issue. 1,
Xia, Charley
Pickett, Sarah J.
Liewald, David C. M.
Weiss, Alexander
Hudson, Gavin
and
Hill, W. David
2023.
The contributions of mitochondrial and nuclear mitochondrial genetic variation to neuroticism.
Nature Communications,
Vol. 14,
Issue. 1,
Kato, Anne E.
and
Scherbaum, Charles A.
2023.
Exploring the Relationship between Cognitive Ability Tilt and Job Performance.
Journal of Intelligence,
Vol. 11,
Issue. 3,
p.
44.
Disabato, David J.
Goodman, Fallon R.
and
Kashdan, Todd B.
2025.
The hierarchical framework of wellbeing (HiFWB).
Frontiers in Psychology,
Vol. 16,
Issue. ,
Valenzuela, Jorge
Muñoz, Carla
Precht-Gandarillas, Andrea
and
Miranda-Ossandón, Jorge
2025.
Inventario Motivacional para la Formación Docente: Aporte a la caracterización motivacional de profesorado en formación.
Revista de Estudios e Investigación en Psicología y Educación,
Vol. 12,
Issue. 1,
A dominant general factor (DGF) is present when a single factor accounts for the majority of reliable variance across a set of measures (Ree, Carretta, & Teachout, Reference Ree, Carretta and Teachout2015). In the presence of a DGF, dimension scores necessarily reflect a blend of both general and specific factors. For some constructs, specific factors contain little unique reliable variance after controlling for the general factor (Reise, Reference Reise2012), whereas for others, specific factors contribute a more substantial proportion of variance (e.g., Kinicki, McKee-Ryan, Schriesheim, & Carson, Reference Kinicki, McKee-Ryan, Schriesheim and Carson2002). We agree with Ree et al. that the presence of a DGF has implications for interpreting scores. However, we argue that the conflation of general and specific factor variances has the strongest implications for understanding how constructs relate to external variables. When dimension scales contain substantial general and specific factor variance, traditional methods of data analysis will produce ambiguous or even misleading results. In this commentary, we show how several common data analytic methods, when used with data sets containing a DGF, will substantively alter conclusions.
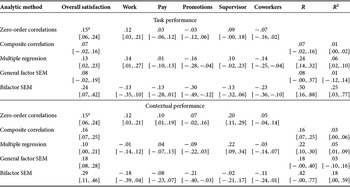
Job satisfaction is a quintessential multidimensional construct with a DGF. It comprises several dimensions, each of which reflects attitudes toward different components of the job and all of which are simultaneously influenced by a DGF. Thus, scores on satisfaction dimension scales reflect both general and specific attitudes, although the relative proportion of each differs across scales. Throughout this commentary, we refer to analyses conducted with job satisfaction and job performance data reported by Edwards, Bell, Arthur, and Decuir (Reference Edwards, Bell, Arthur and Decuir2008). Job satisfaction was measured using a single item measuring overall satisfaction and the Job Descriptive Index, which contains five dimension scales (Work, Pay, Promotion, Supervision, and Coworkers). Performance was measured using supervisor ratings of task performance and contextual performance. More details on the sample are available in the original article. All structural equations models (SEMs) were estimated using OpenMx version 2.0.1 (Boker et al., Reference Boker, Neale, Maes, Wilde, Spiegel and Brick2015). Results of all analyses are shown in Table 1.
Results From Four Common Data Analytic Methods for Job Satisfaction
Note. Values for multiple regressions are observed standardized regression coefficients from the dimension scales to the criteria; values for structural equations models (SEMs) are standardized path coefficients from the latent factors to the observed criteria; values in brackets are 95% confidence intervals (bootstrapped confidence intervals for SEMs).
aZero-order correlations for the single-item overall satisfaction measure.
Common Methods for Analyzing Relations and Their Susceptibility to Misinterpretation
1. Zero-Order Correlations
The most straightforward analytic method is to examine the correlation between the external variable and each of the individual dimensions. In the presence of a DGF, this approach is problematic because all of the observed correlations reflect a composite of general and specific factor variance. Thus, a large correlation could mean that (a) the general factor influences the criterion, (b) the specific factor does, or (c) both do. Conversely, a correlation of zero could reflect that (d) neither the general nor the specific factors are related to the criterion or (e) both are, but in opposite directions. In short, zero-order correlations cannot separate general and specific factor influences, rendering interpretation ambiguous at best. Nevertheless, researchers frequently interpret dimension scale correlations as though they reflect only specific factor variance (e.g., Kinicki et al., Reference Kinicki, McKee-Ryan, Schriesheim and Carson2002).
A related issue occurs when using a composite to index the general factor. Such a sum score reflects not only the general factor but also specific factors and measurement error. As estimates of general factor influence, composite score correlations will be inflated if the general and specific factor(s) predict in the same direction (i.e., enhancing conflation) or attenuated if they predict in opposite directions (i.e., suppressive conflation). Composite correlations reflect an average criterion relation across dimensions, not simply the effect of the general factor.
On the basis of zero-order correlations from Edwards et al. (Reference Edwards, Bell, Arthur and Decuir2008), researchers would conclude that overall satisfaction and satisfaction with work itself have weak positive relations to task performance but that other scales show negligible relations (see Table 1). Similarly, one would conclude that contextual performance is weakly to moderately positively related to overall, work, pay, and supervisor satisfaction but not satisfaction with promotions or coworkers. Finally, on the basis of correlations with a satisfaction composite, researchers would conclude that overall satisfaction is positively related to contextual performance but not task performance. As the analyses below show, most of these conclusions would be wrong.
2. Multiple Regression
Multiple regression examines the combined predictive effects of dimension scores for a criterion of interest. Analyses may be performed either with observed scale scores or with latent variables in an SEM framework (but without specifying a general factor). In either case, this approach is problematic in the presence of a DGF because the influence of the general factor will create multicollinearity problems, making the pattern of regression or structural path coefficients unstable. Further, regression coefficients will primarily reflect each dimension scale's loading on the DGF, not their unique influence on the criterion. In the case of suppressive conflation, R 2 for the model will also be an underestimate, as positive and negative effects of the general and specific factors cancel out within the individual scales. Although multiple regression is affected by intercorrelations among predictors, researchers often focus their interpretations on specific factors rather than attending to the influence of the general factor (e.g., Edwards et al., Reference Edwards, Bell, Arthur and Decuir2008). From the multiple regression results in Table 1, researchers would come to similar conclusions as earlier: Overall satisfaction and work satisfaction are positively related to task performance, whereas overall satisfaction and supervisor satisfaction are positively related to contextual performance. In addition, satisfaction with promotions and coworkers shows small negative effects, suggesting that once other facets are controlled, these dimensions are negatively related to the criteria. R 2 values show that as a set, satisfaction measures explain only a moderate amount of variance in task and contextual performance.
3. General Factor SEM
A third method for assessing relations to external criteria focuses entirely on the DGF. That is, general factor SEMs attribute all predictive power to the general factor; specific factor variance is ignored entirely. Although ostensibly relevant in the presence of a DGF, this approach is essentially the same as using a sum score composite and shares many of its disadvantages. In the case of enhancing conflation, dimension loadings on the general factor and the structural path from the general factor to the criterion will be inflated. In the case of suppressive conflation, the same process will attenuate the general factor's structural coefficient. In both cases, specific effects are forced through the general factor to fit the model. Consequences of failing to specify specific factor structural paths are most severe when general factor saturation is weak. Because a general factor SEM is the latent analogue to an observed score composite, it is unsurprising that their results are virtually identical (see Table 1).
4. Bifactor Model
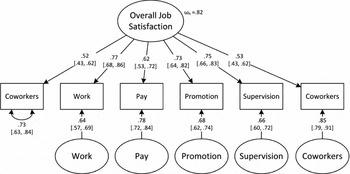
The preceding analytic approaches share a common limitation: General and specific factor variances are not disentangled in the predictive model, biasing the conclusions drawn about the DGF and specific factors. Bifactor modeling offers a solution (Reise, Reference Reise2012). In a bifactor model, each indicator loads on the general factor (which influences all measures) and a specific factor (which influences some measures). General and specific factors are constrained to be uncorrelated, which allows the unique predictive power of each to be examined separately. A bifactor model of Edwards et al.'s (Reference Edwards, Bell, Arthur and Decuir2008) data is shown in Figure 1.
Standardized loadings for a bifactor model of the Edwards et al. (Reference Edwards, Bell, Arthur and Decuir2008) job satisfaction measures with 95% bootstrapped confidence intervals.
Bifactor predictive models are best estimated via SEM and can be fit using a variety of software packages (for an alternative approach using multiple regression and residualized factor scores, see Salgado, Moscoso, & Berges, Reference Salgado, Moscoso and Berges2013). Before examining how a bifactor model affects interpretations of DGFs, a few words about how bifactor modeling works are in order. In fitting a bifactor SEM, ideally, multiple indicators for each specific factor are used (e.g., multiple items from each scale of a personality measure; McAbee, Oswald, & Connelly, Reference McAbee, Oswald and Connelly2014). Using multiple indicators allows specific factors to represent shared reliable variance, rather than a mix of reliable and error variance, and permits their simultaneous inclusion in the predictive model (cf. McAbee et al., Reference McAbee, Oswald and Connelly2014). However, if single indicators are used for specific factors, such as when only scale scores are available or when reanalyzing a published correlation matrix, at least one specific factor must be excluded from the predictive model to avoid exact linear dependence (Chen, Hayes, Carver, Laurenceau, & Zhang, Reference Chen, Hayes, Carver, Laurenceau and Zhang2012). Thus, when predicting performance using a bifactor model of Edwards et al.'s (Reference Edwards, Bell, Arthur and Decuir2008) data, we excluded the uniqueness of the single “overall satisfaction” item, based on the assumption that most of this variance was error (Wanous, Reichers, & Hudy, Reference Wanous, Reichers and Hudy1997).
Results of the bifactor analyses produce a striking pattern (see Table 1). After removing the general factor variance, all specific satisfaction factors are negatively correlated with both criteria, although they vary widely in their magnitude and precision. What this means is that the positive relation to performance comes from the DGF, overall satisfaction, not from evaluations of particular work features. For purposes of contrast, such a conclusion is precisely the opposite of that of Kinicki et al. (Reference Kinicki, McKee-Ryan, Schriesheim and Carson2002). Further, overall, promotions and coworkers satisfaction factors show far stronger relations with performance than were observed in any of the analyses wherein their variances were conflated, illustrating the relevant, but hidden, effects of suppressive conflation. Such a pattern of results is similar to bifactor analyses of other constructs (cf. Chen et al., Reference Chen, Hayes, Carver, Laurenceau and Zhang2012).
Despite their interpretive advantages, bifactor analyses can present several challenges. Two of these are worth mentioning. First, in some cases, one or more specific factors may have negligible or negative estimated variances and factor loadings, indicating that the specific factor is inseparable from the general factor. In such situations, the offending specific factors should be eliminated and their indicators allowed to load only onto the general factor. Second, like any SEM, bifactor models require sufficiently large sample sizes to provide stable parameter estimates. Sample requirements depend on the degree of communality in the indicators and factor overdetermination (i.e., the degree to which each factor shows strong loadings on multiple indicators; MacCallum, Widaman, Zhang, & Hong, Reference MacCallum, Widaman, Zhang and Hong1999). A concern in bifactor models is that if DGF saturation is large, specific factor loadings will be too weak to provide stable estimates of external relations without very large sample sizes. In such cases, impact of the apparently minor specific factors would not be large enough to justify the costs of trying to measure them reliably.
Comparison of Implications
Results in Table 1 show how choices in data analysis can dominate interpretations of constructs’ relations with external variables in the presence of a DGF. On the basis of correlation analysis, researchers would interpret that both task performance and contextual performance have weak relations with overall satisfaction and satisfaction with work itself, whereas contextual performance is also related to pay and supervisor satisfaction. On the basis of multiple regression, researchers would conclude that both performance variables are associated with overall satisfaction, but task performance is additionally related to satisfaction with the work itself, whereas contextual performance is related to supervisor satisfaction. On the basis of the results of composite correlations and general factor SEM, researchers would conclude that overall satisfaction has little effect on performance. Finally, only the bifactor model was able to separate individuals’ overall evaluations of their job from their beliefs about specific job components, revealing that only the DGF demonstrates a positive relation with performance. All of these are different results that lead to different implications for both theory and applied action.
Presented with the multiple regression results, a theorist might conclude that helping behavior (i.e., contextual performance) stems from good interpersonal relationships at work, whereas task performance is a result of work tasks being intrinsically motivating. Presented with a composite correlation or general factor SEM, a practitioner might decide that improving employee satisfaction would have little impact on tangible organizational outcomes. Critically, by failing to properly account for the DGF using their chosen data analytic method, both conclusions would be based on misleading results and would be wrong. In truth, according to results of the bifactor analysis, task and contextual performance exhibit very similar patterns of relations with the predictors. Most important, for the domain of job satisfaction, only the DGF has a stable positive relation with performance, which is moderate-to-large in magnitude.
Conclusion
DGFs are present in measures of nearly all multidimensional constructs in psychological and organizational research (Ree et al., Reference Ree, Carretta and Teachout2015). Interpretations of general factors vary widely. Some DGFs are artifactual (Conway & Lance, Reference Conway and Lance2010), others are formative composites without independent psychological meaning (e.g., overall job performance; Campbell & Wiernik, Reference Campbell and Wiernik2015), and still others have substantive meaning (Chen et al., Reference Chen, Hayes, Carver, Laurenceau and Zhang2012). However, in many cases, data analytic choices will strongly influence interpretations of DGFs. Determining which interpretation is appropriate for a particular DGF requires not only partitioning the variance within a psychological measure, but also establishing the unique nomological networks of the general and specific factors. Methods that inappropriately conflate DGF and specific factor variance will distort substantive results, causing harm to both theory and practice. In the presence of a DGF, it is essential that researchers use appropriate analytic methods to ensure a valid interpretation of findings.