During the 2020 presidential election, the Trump campaign incorrectly claimed that a lower-than-expected proportion of Republican votes among populations living on and near military bases provided evidence of voter fraud (Elinson and Randazzo Reference Elinson and Randazzo2020). Republican officials also held erroneous suspicions about the number of military personnel who voted Democrat during the election. These claims rested on assumptions that military bases and their surrounding communities are strongholds for political conservativism––a belief held by scholars, pundits, and politicians alike. In their groundbreaking work, Chinni and Gimpel (Reference Chinni and Gimpel2010) argued that military installations, especially so-called military bastions, dominate the civilian space around them––both economically and politically. These bases often are the largest civilian employer if they are located in a rural county, and many of the most recognizable bases in the United States reside in sparsely populated places in red states. Thus, Chinni and Gimpel (Reference Chinni and Gimpel2010, 83) speculate that residential proximity to these bases influences not only individual policy preferences but also partisanship. The problem, however, is that these assumptions have not been tested systematically.
Although the logic underlying these arguments appears sound at first glance, it fails to consider the complexities surrounding military service and institutions, political geography, partisan preferences, and voting behavior. Furthermore, the argument that military bases and their surrounding populations are more politically conservative relies on the outdated belief that the military itself strongly leans Republican. We directly test the notion that communities close to military bases will be and vote more Republican. Using three different but related empirical strategies that rely on a large dataset spanning 16 years, we find evidence contradicting the conventional wisdom. While there is some evidence of a Republican tilt around some military installations, others lean Democratic; yet, for most military bases, no correlation with party patterns exists at all.
While there is some evidence of a Republican tilt around some military installations, others lean Democratic; yet, for most military bases, no correlation with party patterns exists at all.
Our results carry important implications for the study of US electoral geography; the relationship among the physical structures of military installations, their institutions, and their surrounding communities; and the broader civil–military relations. Given the inflection point about the current relationship among our exigencies of military institutions, the military itself, and the attitudes that civilian society holds about the armed forces at large (Blankshain, Cohn, and Lupton Reference Blankshain, Cohn and Lupton2025; Robinson Reference Robinson2023), probing the veracity and magnitude of a perceived party atmosphere outside of the barracks is justified. It also is necessary for better understanding American democracy and its institutions.
POLITICAL GEOGRAPHY, MILITARY INSTALLATIONS, AND PARTISAN PREFERENCES
While some influential scholarship asserts that geographic “context should not count” in political analysis (King Reference King1996, 159; see also Jacoby Reference Jacoby2014), the notion that location shapes political preferences is well established across political geography. Lyons (Reference Lyons2017) shows that the pressures of location can affect partisanship more strongly than other critical factors, such as family partisanship. Furthermore, research consistently finds that geographic patterns and broader social-diffusion effects influence individual-level partisanship (Lyons Reference Lyons2011, Reference Lyons2017; Motyl et al. Reference Motyl, Iyer, Oishi, Trawalter and Nosek2014; Teigen, Shaw, and McKee Reference Teigen, Shaw and McKee2017).
Regarding proximity to military installations specifically, states with higher enlistment rates and richer “military culture” are less casualty averse (Gill and DeFronzo Reference Gill and DeFronzo2014, 727). Similarly, individuals who live in areas with proportionately large military veteran populations, have familial relationships with members of the armed services, or view their attachment to military veterans as a central part of their identity also hold distinct attitudes on key foreign policy issues (Gartner Reference Gartner2008, Reference Gartner2009; Krueger and Pedraza Reference Krueger and Pedraza2015; Lau, Brown, and Sears Reference Lau, Brown and Sears1978; Theys, Krueger, and Pedraza Reference Theys, Krueger and Pedraza2020). Thus, it seems reasonable to predict that living near a military base shapes one’s partisanship (Ambrosius Reference Ambrosius2016). As Chinni and Gimpel (Reference Chinni and Gimpel2010, 167) explain, “[A] 2009 Gallup survey found that current and former service members are more likely than civilian workers to be Republicans, and that partisan tie clearly has an effect in these communities—even among those not actually in the military. There’s a military culture in the Military Bastions that extends far beyond life on the military base itself.”
Indeed, Chinni and Gimpel (Reference Chinni and Gimpel2010) offer what likely is the most famous and cited argument regarding the influence of military installations on the politics of surrounding communities. In making their arguments, Chinni and Gimpel present a largely descriptive analysis of US counties, placing each county in one of 12 categories based on their chosen demographic characteristics, including average age, migration, religion, population growth or decline, income, and education. For 10 of these categories, locations are denoted as “monied burbs” or “Mormon outposts” (for example) based on the compositional characterization of who lives there. However, for two of their categories—“military bastions” and “campus and careers”—there is an implicit causal claim stemming from their reliance on non-compositional factors. For “military bastions,” Chinni and Gimpel (Reference Chinni and Gimpel2010) recognize that the defining characteristic of a county is more than a descriptive summary of county demographics; it is a recognition that they are making an implied contextual argument beyond the compositional one: that is, the presence of an armed forces installation.
Chinni and Gimpel (Reference Chinni and Gimpel2010) make the implicit causal case that there is something different about these counties apart from others similar to them in other respects. That is, there are other counties in Kentucky that share the demographics of Hopkinsville in Christian County that are not military bastions because they lack proximity to a military base. Thus, the current discourse predicts that people living near military bases will trend more Republican and, indeed, there is an underlying causal argument to this discourse.
Nevertheless, we argue for caution before accepting this assumption at face value. Conventional wisdom assumes that the military is overwhelmingly Republican. While that may have been true in the past, recent research shows that this tendency has not held true in the past decade. As Lupton and Margulies (Reference Lupton and Margulies2020) explain, “[P]olls of active-duty personnel show they are conservative, but not overwhelmingly so.” Changing demographics of the military at large—including an increase in the number of female, Black, and Latino personnel—suggest that the armed services may continue to become less conservative in the future (Shah Reference Shah2024). Thus, it should not be surprising that statistics from the 2020 presidential election indicate that military bases swung Democratic at a rate that outpaced the national average (The Economist 2021). Furthermore, when considering other key demographic factors, counties with military bases were no more or less likely to support Trump during the 2016 presidential election (Abascal and Centeno Reference Abascal and Centeno2017).
Conventional wisdom further assumes that military bases are similar in their geography and subsequent political influence. When most people think of a military base, they likely envision a large Southern base such as Fort Moore on a rural stretch of the Alabama and Georgia state line south of Columbus. Yet, this heuristic fails to appreciate the incredible geographic diversity of America’s domestic military installations. MacDill Air Force Base shares crowded space with two of Florida’s largest cities, Tampa and St. Petersburg. Similarly, the US Navy and US Marines operate multiple bases on the Southern California coast. More broadly, scholars increasingly push back against the notion that certain spaces are red while others are blue (Ambrosius Reference Ambrosius2016). Not all military personnel are Republican and not all military bases are rural. Accordingly, our counter-hypothesis indicates that there is no relationship between proximity to military bases and partisanship.
RESEARCH DESIGN
To assess this issue, we employ pooled cross sections of nationally representative samples from the 2006–2022 Cooperative Election Study (CES) surveys. The CES includes respondents’ zip codes and relevant survey questions—namely, partisanship and presidential vote choice with appropriate control variables. For our key independent variable of interest, we measure how much distance exists between each respondent’s zip code and the nearest military installation that houses active-duty forces. The stateside array of military bases includes individual branch installations as well as multi-branch joint bases. The reasons behind their locations are a complex and historical array of national security needs, political deal making, and other factors. From our perspective, it is not important to focus on why bases are located where they are as much as measuring their location—and the proximity of individual survey respondents to these locations.
To identify major military installations across the United States, we need to determine which installations to include and where those bases are located. We begin by working with Adler’s (Reference Adlern.d.) classification of “major” military installations listed in the Congressional District Data Codebook. It includes any installations that are named “Fort,” “Base,” “Camp,” “Air Force Base,” “Naval Base,” or “Submarine Base.” This classification, however, omits key major military installations, such as those designated as “Joint Base,” “Naval Station,” and service academies. We then cross-reference this list with the Department of Defense (DOD) list of military installations to identify which bases to include in our data. We exclude installations that have scant or no active-duty personnel units stationed at those locations. We believe that focusing on such “major” military installations best tests the spirit of Chinni and Gimpel’s (Reference Chinni and Gimpel2010) argument. We identify 113 bases that meet these criteria. We then specify the location of each base, using information provided by the DOD (Lupton and Teigen Reference Lupton and Teigen2025).
The way we geolocate respondents and their proximity to military installations is more straightforward. CES data provides each respondent’s zip code, which has two desirable attributes in terms of analytic utility: zip codes (1) are geographically small, providing as high geographic precision as possible with nationally representative survey research; and (2) tend to be residentially homogeneous.
We employ three similar but distinct ways to measure and operationalize a respondent’s geographic location vis-à-vis military installations. First, we use an aggregated model that includes all respondents and the Euclidean distance to their nearest base. Second, we zoom in on each military installation and run a model for only those respondents within 60 miles of each base. Third, we calculate total proximity to bases such that respondents who reside near multiple bases would have high scores, those near only one or two would have moderate scores, and those not near any bases would have low scores.
Our two dependent variables are Republican Party identity and voting for Republican presidential candidates. Party identity is coded as a dummy rendered from the seven-point party identity scale with “strong,” “not very strong,” and “lean” Republican identifiers receiving a 1, and we code independents, Democratic leaners, and Democratic identifiers as zero (Keith et al. Reference Keith, Magleby, Nelson, Orr, Westlye and Wolfinger1986). We track vote choice as a dummy variable, coding 1 for voters who chose John McCain, Mitt Romney, or Donald Trump and zero for those who chose Barack Obama, Hillary Clinton, or Joe Biden. We omit nonvoters or those who voted for minor-party candidates.
Our individual-level control variables include several well-understood correlates of political preferences—namely, family income ($70,000+ per year); race and ethnicity (white non-Hispanic versus other identities); education (bachelor’s degree or more); gender (male dummy); religion (Evangelical Christian association); age (bracketed into dummies); marital status (married living with spouse); military service experience (veteran dummy); year; and state. Year of survey and state of residence variables each omit one arbitrary category (i.e., 2006 and Alabama).
We include three additional compositional variables measured at the zip code level to control for space apart from military base proximity: (1) the percentage of the respondent’s zip code that comprises African Americans; (2) the percentage of the respondent’s zip code that comprises Hispanics; and (3) population-density quartiles. This inclusion controls for an important factor about many military bases. Although some stereotypical bases (e.g., Fort Campbell) exist in a milieu that often is thought of when imagining a rural base in a red state, other urban and diverse areas also have bases. San Antonio, San Diego, Los Angeles, and Washington, DC, are examples of locations with high racial and ethnic diversity, population density, and military installations. Finally, we include year- and state-fixed effects in each model.
RESULTS
Bivariate comparisons of distance from the nearest military installation do not support the conventional “military bastion” wisdom. The mean distance for Republican identifiers and those preferring the Republican nominee in 2008, 2012, 2016, and 2020 is farther away than non-GOP identifiers and Obama/Clinton/Biden voters. However, multivariate analysis provides the best mechanism to test our hypotheses.
Aggregated Model
Our first model, the aggregated model, pools all respondents across years and includes the previously specified controls. The independent variable of interest is the logged distance to the nearest military base. We log the distance to the nearest base to contend with the diminishing power of proximity as distance increases. In other words, we do not believe the 10 miles between 40 to 50 miles away from the base are as important as the first 10 miles.
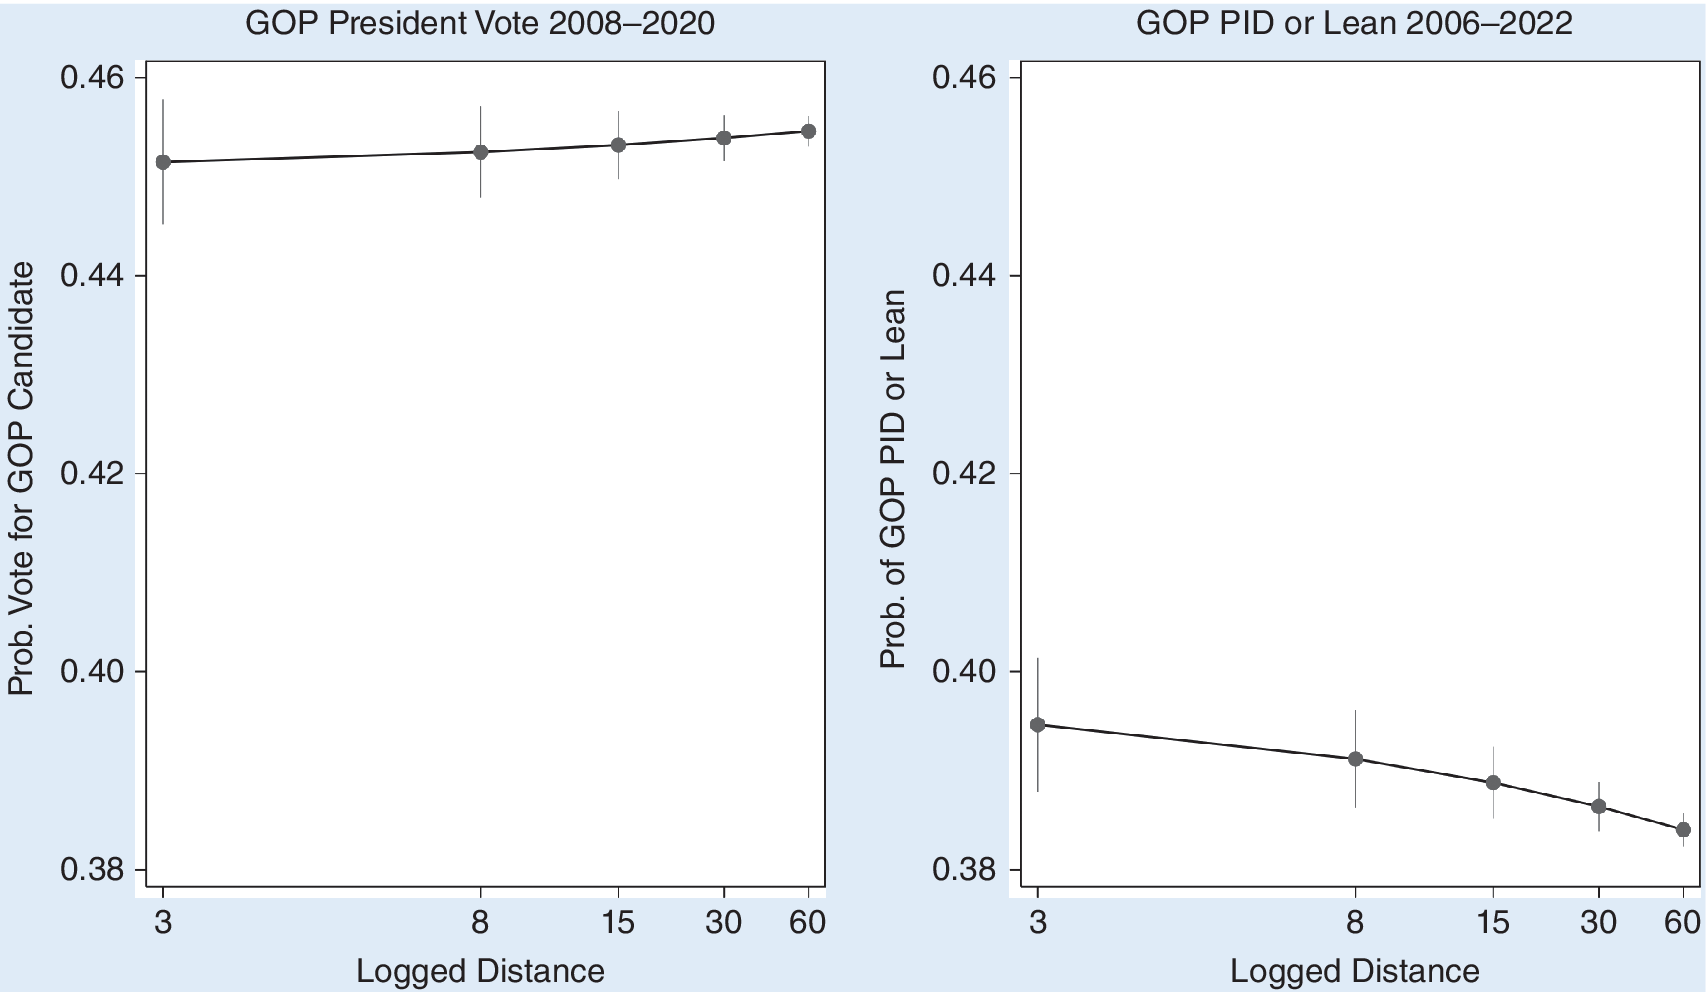
We find inconsistencies between vote choice and partisan identification (see the online appendix for full results). The parameter estimate in the multivariate analysis for logged distance to predict Republican voting in presidential elections is positive but not statistically significant (with more than 100,000 respondents in four elections), weakly suggesting that living closer to a base makes it slightly more likely that a person will vote for the Democratic candidate. For the likelihood of identifying as or leaning toward being a Republican, the parameter estimate is negative and statistically significant, suggesting that decreasing distance makes it more likely that a person will identify as a Republican. Plotting the predicted probabilities of identifying as Republican or voting for the GOP choice across substantively interesting values of distance reveals more information about the nature of the relationship between distance to the nearest military base and political attitudes and behavior (figure 1).
Predicted Probabilities of GOP Voting and Party Identification

The magnitude of the results is minimal. While statistically significant, the substantive shift from 60 to 3 miles away barely influences partisan affinity, shifting less than one percentage point. Even more damaging to the conventional wisdom about GOP voting is that the slope of the relationship is pointed the wrong way: the decreasing distance points to lower probabilities of choosing the Republican nominees.
Sixty-Mile Radius
The second empirical strategy for the analysis isolates the samples to only those respondents who reside within a 60-mile-radius circle around each military installation. We run separate logistic regressions for those living in each of the 60-mile-radius circles using almost the same model as specified previously. Our findings did not provide much support for the conservative “military bastion” thesis. Among the 100 or so military installations with sufficient sample sizes, only approximately 25% showed a statistically significant relationship between distance from the base and either or both the vote choice and party identification models. This list is summarized in the online appendix.
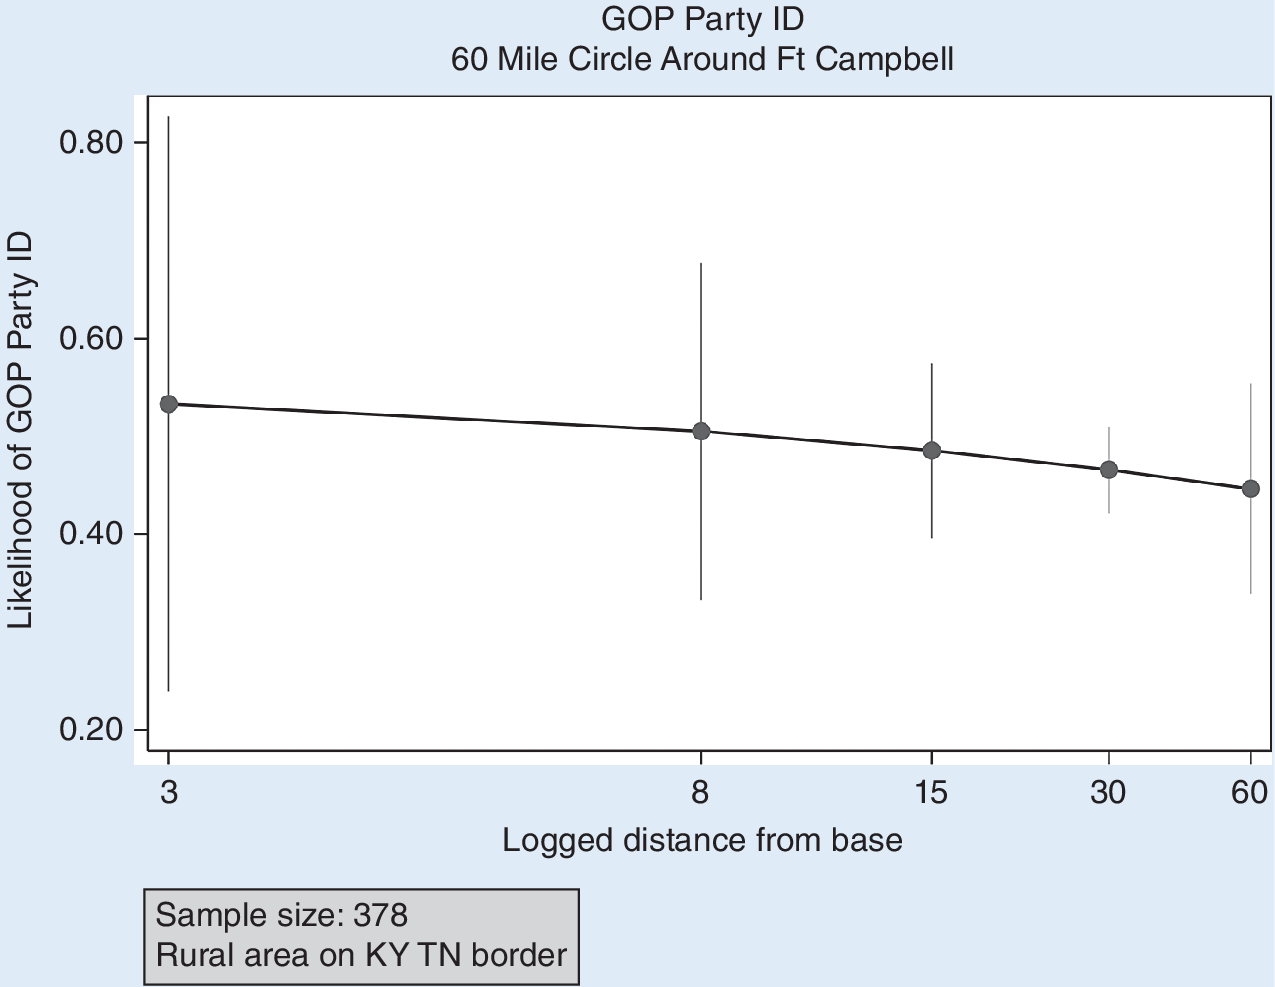
Furthermore, the direction of this relationship is not consistent. Some installations and their surrounding political trends support Chinni and Gimpel’s (Reference Chinni and Gimpel2010) conventional “military bastion” wisdom—for example, Fort Campbell on the Kentucky–Tennessee border shown in figure 2. The closer one lives to Fort Campbell within this 60-mile radius, the higher likelihood that one thinks of themself as a Republican, although without statistical significance.
Party Identification and Distance, Fort Campbell

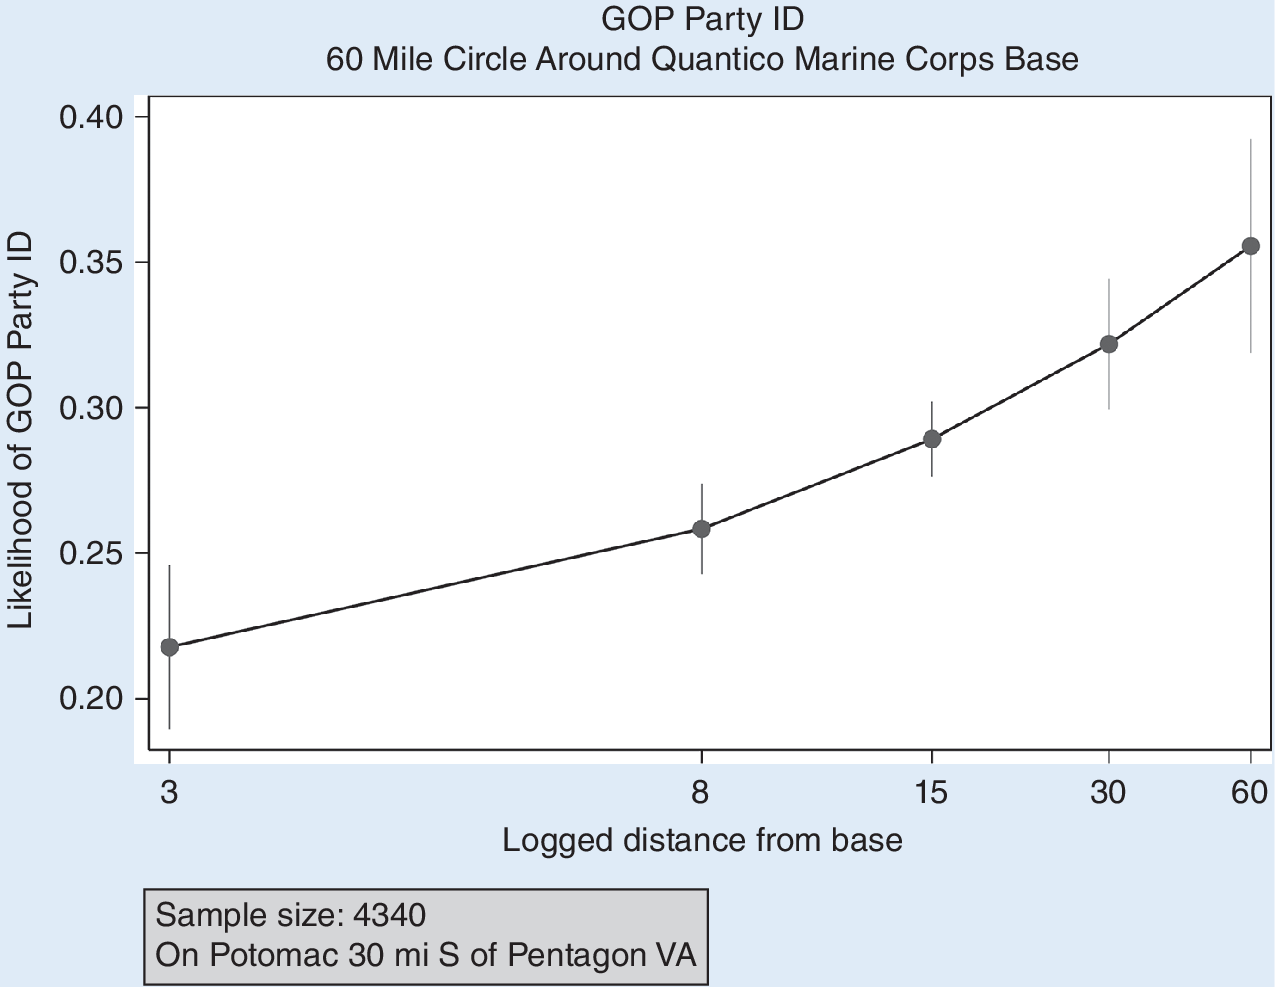
Yet, for every military post that exhibits a pattern like this, there is another one where distance from base runs in the opposite partisan direction. To counter the Fort Campbell example, consider Marine Corps Base Quantico on the Potomac River, as shown in figure 3. The closer one lives to Quantico, the less likely one will express identification as a Republican. This substantive shift is not trivial at approximately 10 percentage points, going from 60 miles away to the base’s immediate area. Furthermore, we must keep in mind that 70% of bases show no pattern at all.
Party Identification and Distance, Marine Corps Base Quantico

Total Proximity
Our third empirical strategy involves slightly more complexity but hedges against potential shortcomings of the first strategy, in which we used only the closest base to gauge a respondent’s distance from a base. This decision ignores the possible stronger influence of living near multiple bases. To estimate a total-proximity measure, we convert the typical miles in distance to its inverse: proximity. We convert distance to proximity by reversing distance values between 1 and 100 to proximity values so that a higher value means higher proximity (i.e., 0 miles away=100 proximity; 99 miles away=1 proximity; 100 miles or more=0). We assessed this proximity to every base for each respondent. For example, consider a hypothetical respondent living in the basement of the Alamo in San Antonio, Texas, in the 78205 zip code. That location is 5 miles from Fort Sam Houston, 25 miles from Randolph Air Force Base, and 15 miles from Lackland Air Force Base. Converting those distances into proximity scores gives the hypothetical “Remember the Alamo” resident scores of 95, 75, and 85, respectively, for each installation. Assuming that proximity to multiple nearby bases may have a more powerful additive effect, we compute a total proximity by taking the sum of all proximity scores, in which the Alamo cellar dweller in the example would have a score of 255.
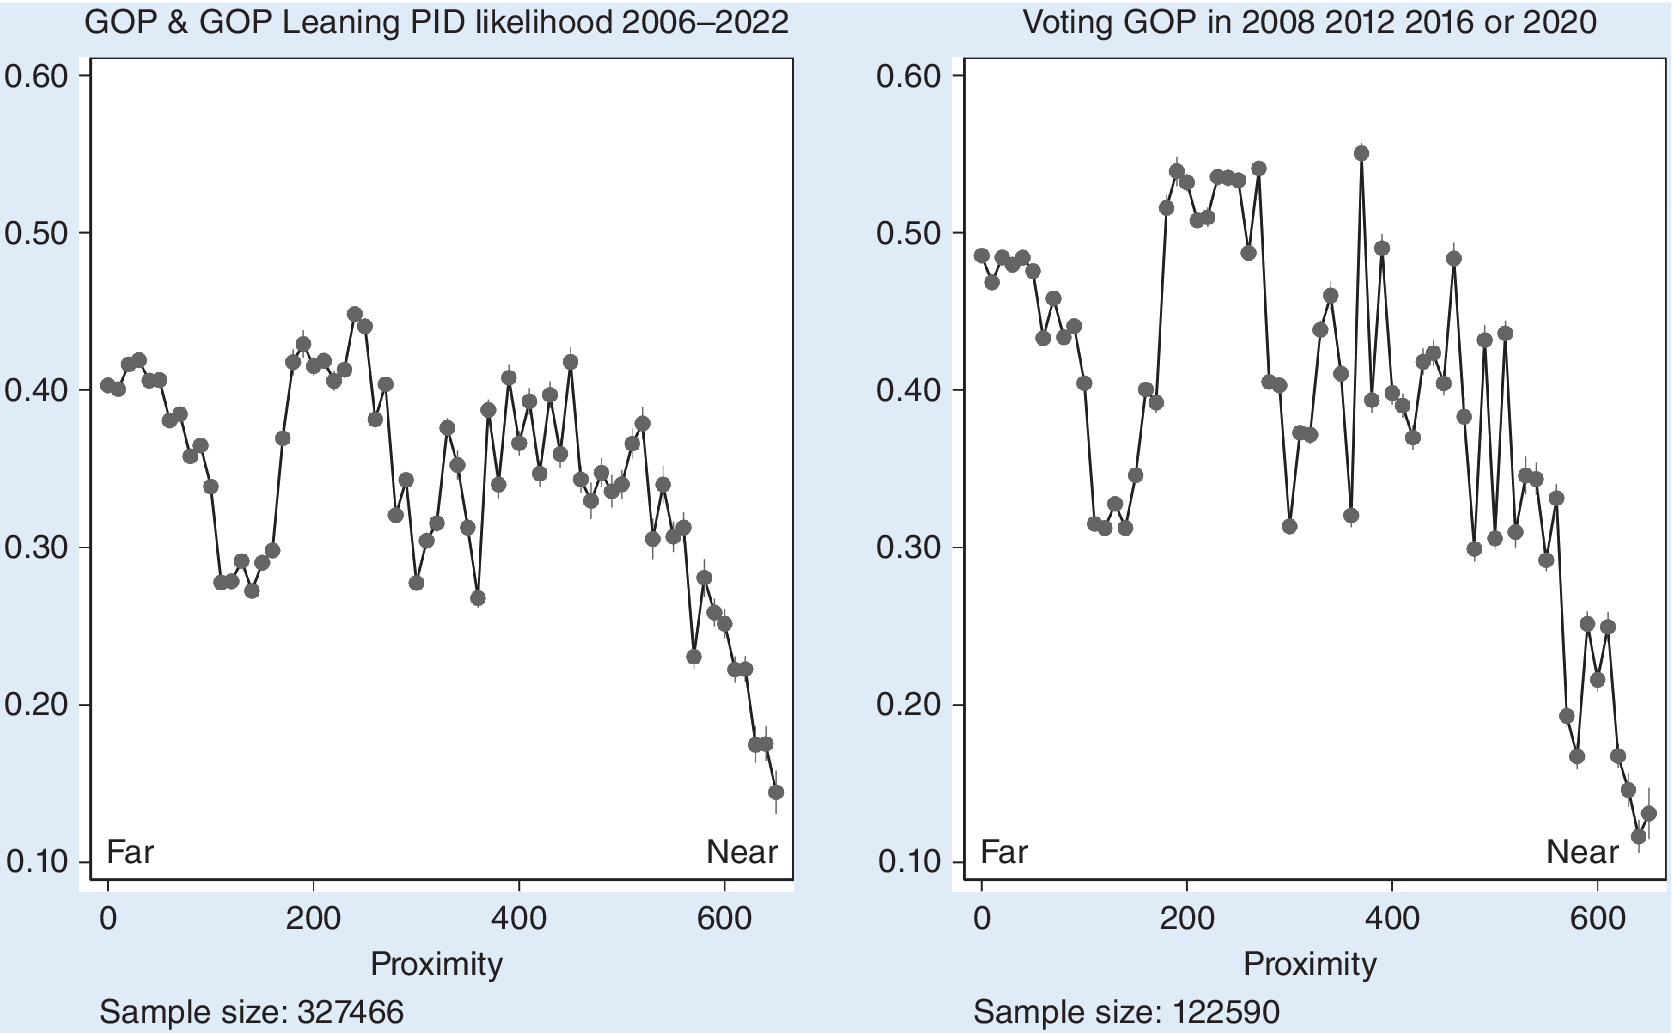
We find that the measure of total proximity does not exhibit statistically significant results in either the Republican vote choice model or for Republican partisan affiliation (see the online appendix for full results). Failing to falsify the null hypothesis partly paints the picture; however, plotting the predicted probabilities of being a Republican and voting for the GOP candidate across the values of total proximity also helps (figure 4).
Party Identification, Voting, and Total Proximity

Changing the x-axis from distance to proximity reverses the x-axis. In figure 4, values on the right have more proximity to at least two bases—even more in some instances. In general, there is evidence that the “military bastion” characterization does not apply to all or even most military installations. The non-monotonic shape of the results eludes simple explanation. An important caveat should be noted: all values higher than 300 for proximity are located in one of only four cities with several installations (i.e., Greater Washington, DC; San Antonio, Texas; San Diego, California; and the Denver–Colorado Springs corridor). This stipulation aside, these total proximity results do not make a strong case for Republican trends for those living in “military bastions.” A tempting conclusion from this last point may suggest that cities are the crux of the patterns revealed in our study. The proximity to the several Greater Washington, DC, area bases is significant as an example for which base proximity correlates with low likelihood of Republican association and voting (e.g., Dover and Andrews Air Force Bases, the US Naval Academy, and Forts Detrick and Meade).
However, given our use of control variables, simple proximity to urban cities cannot be the only or even primary reason for this low likelihood. Our models control for two central attributes of urbanity in America: racial and ethnic diversity and population density. Therefore, proximity to large cities explains part of the blue voting and partisanship patterns near the few bases in the online appendix; however, there also must be a more complex pattern of factors unmeasured or recognized by our models. We encourage future research to examine further these complexities.
CONCLUSION
Military installations all over the United States vary across geographic and political space. Some exist in remote, low-density parts of the Mountain Plains, such as Minot Air Force Base in North Dakota, which is more than 100 miles from the nearest interstate highway. The 2,000-square-mile county in which Minot Air Force Base resides is more than 90% white and sparsely populated—a population of approximately 60,000. The county preferred the Republican nominee in recent presidential elections by more than 60%. Yet, other military bases reside in far different geographic and political spaces. Joint Base Andrews is located within a 60% African American Maryland county with more than 800,000 residents and is about seven times denser than Minot’s county. It is a profoundly blue place: neither Romney nor Trump earned more than 10% of the county’s votes in 2012 and 2024, respectively.
To be fair to Chinni and Gimpel (Reference Chinni and Gimpel2010), they acknowledge the difficulty of placing every one of the more than 3,000 US counties into one of 12 mutually exclusive categories. In their appendix, they assign each county a primary and a secondary classification. Those tagged as “military bastions” might vary in other cultural or demographic attributes. For example, Fairbanks, Alaska—with Fort Wainwright adjacent––is primarily a “military bastion,” but its second classification is a “boom town.” These counties stand out for their recent population growth, above-average household incomes, younger average age, and higher-than-average education levels. They also are purple to red in their voting habits (note: Chinni and Gimpel’s Reference Chinni and Gimpel2010 book relies on 2004 and 2008 data). Compare this to Christian County, Kentucky, home to Fort Campbell and the book’s exemplar of a “military bastion.” Its second identity is “service worker center.” These counties are marked by a lack of dominant industries or employers, but they have diversified businesses and light manufacturing, slow population growth, and citizens who are older than average. Cotton County, Oklahoma, where the US Army’s Fort Sill is located, is a “military bastion” first but is secondarily identified as an “evangelical epicenter,” an identifier that speaks for itself (Chinni and Gimpel Reference Chinni and Gimpel2010).
Although each of our analytic attempts to analyze the question differs slightly, all three empirical strategies point to the same basic conclusion: the politics of the communities surrounding America’s stateside military installations are more heterogeneous than monolithic. Some bases are located in crimson-red rural counties in the Great Plains and others are adjacent to reliably blue major urban cities. However, the nearby population density or ethnic and racial diversity cannot be the only explanation because our models control for both. We infer from our analyses that the electoral trends around American stateside bases are more complex than a monolithic “military bastion” status; moreover, there likely are factors unseen by our models that power the variety explained by both previous literature and our analysis. Thus, the myth that military bases and their surrounding areas are uniformly more Republican must be abandoned, and the discourse surrounding American civil–military relations and the preferences of the “military” must reflect political realities.
…the politics of the communities surrounding America’s stateside military installations are more heterogeneous than monolithic.
…the myth that military bases and their surrounding areas are uniformly more Republican must be abandoned, and the discourse surrounding American civil–military relations and the preferences of the military must reflect political realities.
SUPPLEMENTARY MATERIAL
To view supplementary material for this article, please visit http://doi.org/10.1017/S1049096525000320.
ACKNOWLEDGMENTS
We thank Bethany Albertson, Peter Feaver, Scott Limbocker, Chiara Ruffa, Daron Shaw, Christopher Wlezien, the CMRades, and the audiences at the Southern Political Science Association Annual Meeting, the Inter-University Seminar on Armed Forces and Society Biennial Conference, and the Army War College Civil–Military Relations Conference for their comments on earlier drafts of this article.
DATA AVAILABILITY STATEMENT
Research documentation and data that support the findings of this study are openly available at the PS: Political Science & Politics Harvard Dataverse at https://dataverse.harvard.edu/dataset.xhtml?persistentId=doi:10.7910/DVN/E45XY5.
CONFLICTS OF INTEREST
The authors declare that there are no ethical issues or conflicts of interest in this research.