




1. Introduction
Latin America and the Caribbean (LAC) is a region with abundant natural resources, energy potential, poverty, and inequality (Busso & Messina, Reference Busso and Messina2020). With 8.3% of the global population, it accounts for 11.2% of global material extraction (United Nations Environment Programme et al., 2023). It plays an important role in the global economy, but the global demand for raw materials is putting excessive pressure on its natural resources (United Nations Environment Programme et al., 2023). LAC needs to redefine its role within the circular economy (CE) (Aguilar Hernandez et al., Reference Aguilar Hernandez, Hoof, Conde, Kahhat and Pabón-Pereira2024) and develop tailored instruments that can address these factors (Ospina-Mateus et al., Reference Ospina-Mateus, Marrugo-Salas, Castilla, Castellón, Cantillo, Bolivar, Salas-navarro and Zamora-musa2023). Within this context, several LAC countries – such as Colombia, Chile, Perú, Ecuador, Uruguay, Brazil, Costa Rica, and Panama – have established CE action plans in the form of roadmaps and National Strategies of Circular Economy (NSCE), which acknowledges the crucial role of CE business models as one of the key aspects for an effective circularity transition (Samaniego et al., Reference Samaniego, Toro, Jiménez, Santori and de Cambio2022). However, these national-level strategies do not provide micro-level guidelines on how companies can transform their activities, particularly in key economic sectors, such as extractive sectors, construction, and bioeconomy.
For effective implementation and monitoring of CE strategies at the business/industry levels, companies should count on tools tailored to their respective context and aligned with national strategies (Holly et al., Reference Holly, Schild and Schlund2024). Nevertheless, regionally or sectorally tailored instruments that could guide CE progress at a micro-level (i.e., product and firm) are generally lacking (Lieder & Rashid, Reference Lieder and Rashid2016). Furthermore, these often exclude a systemic and holistic approach (Rincón-Moreno et al., Reference Rincón-Moreno, Ormazábal, Álvarez and Jaca2021). Design thinking approaches generally meet these various criteria as a process that drives the redefinition of problems and solutions outside the limits of what is assumed to be possible while creating a mindset oriented to respond to economic, environmental, and social challenges (Bassi et al., Reference Bassi, Bianchi, Guzzetti, Pallaske and Tapia2021; Robinson, Reference Robinson2022; Zurlo & Cautela, Reference Zurlo and Cautela2013). Design thinking is also closely linked with systemic thinking, which provides an understanding of how different elements of a system interact with each other (Ellen MacArthur Foundation & IDEO, 2017).
Several design approaches have been used to understand and tackle the environmental damage associated with a linear economy model, i.e., green design, eco-design, sustainable design, design for sustainability or design for X (Df X) (Sassanelli et al., Reference Sassanelli, Urbinati, Rosa, Chiaroni and Terzi2020), and cradle-to-cradle design. The first three methods (i.e., green design, eco-design, and sustainable design) do not consider the entire system's perspective (Moreno et al., Reference Moreno, De Los Rios, Rowe and Charnley2016) and focus on minimizing impacts. The cradle-to-cradle design framework, on the other hand, seeks products and services with positive impacts, where materials are used as feedstock or nutrients that could follow either a biological or technical cycle (Braungart et al., Reference Braungart, McDonough and Bollinger2007). Df X provides design strategies that are directly linked to the CE (e.g., design for biodegradability, design for repair/refurbishment, and design for product-service systems) and it has evolved to circular design (CD) as an enabler of the principles of the CE (Moreno et al., Reference Moreno, De Los Rios, Rowe and Charnley2016). Cradle-to-cradle design and Df X incorporate systemic thinking as the core of their design process and, therefore, represent suitable design approaches to be implemented at the micro-level.
Moreno et al. (Reference Moreno, De Los Rios, Rowe and Charnley2016) have developed a European CD framework that guides designers through the CD strategies of Df X and circular business model archetypes. However, the framework does not provide an assessment or a design tool to determine the circularity status of companies and their opportunities. Furthermore, Kirchherr and van Santen (Reference Kirchherr and van Santen2019) recognized that CE in developed economies could greatly differ from emerging economies such as those in the LAC region due to differences in policy, access to funding, education and professional development, and available infrastructure.
The lack of CD in LAC is recognized as one of the barriers to achieving CE in the region (Gallego-Schmid et al., Reference Gallego-Schmid, López-Eccher, Muñoz, Salvador, Londono, Barros, Guerrero, Mendoza, Nadal and Guerrero2024). Studies focusing on the development of frameworks and CD instruments that support CE strategies in LAC are scarce (Gallego-Schmid et al., Reference Gallego-Schmid, López-Eccher, Muñoz, Salvador, Londono, Barros, Guerrero, Mendoza, Nadal and Guerrero2024). For example, Alvarado-bawab and Villa Marenco (Reference Alvarado-Bawab and Villa Marenco2023) carried out a survey among 46 companies of different sectors located in the Atlantic department of Colombia, identifying their type of waste and the few CE strategies adopted. Moreover, Neto et al. (Reference Neto, Correia, Tucci, Melatto and Amorim2023) identified key manufacturing decisions to promote CE in the reverse chain of electronic waste among electronics manufacturers and importers in Brazil. In a similar way, Mohammadi et al. (Reference Mohammadi, Singh and Habib2021) calculated the CE potential of five Caribbean islands to recover e-waste and help decision-makers manage this flow. From an environmental perspective, Méndez et al. (Reference Méndez, Guzmán-martínez, Acosta, Collahuazo, Ibarra, Lalangui and Jiménez-Oyola2022) assessed tailings from a gold mining area in southern Ecuador and recommended the reuse of tailings as a substitute for sand in less than 50% for concrete block manufacturing. Even though there are studies that analyze CE application in different economic sectors, to the best of our knowledge, there is no circular practical assessment or company-level frameworks to evaluate current products, understand materials and energy flows, and develop CE strategies or roadmaps in the LAC context.
This paper presents a structured, four-phase model that guides companies from diagnosing their current CE performance to strategic planning toward CE implementation. The circular design model (CDM) addresses the gap in micro-level CE frameworks tailored to LAC conditions. Through a co-creation process with three Colombian and two Peruvian companies in the oil and gas sector, we demonstrate that by integrating CD tools such as visual thinking and social cartography, companies identified a higher number of circular opportunities. This suggests that the CD tools integrated in the model surface specific barriers and opportunities that companies would be less likely to identify without visual thinking and participatory methods. The structure and tools of the model were selected to respond to specific LAC barriers identified by Gallego-Schmid et al. (Reference Gallego-Schmid, López-Eccher, Muñoz, Salvador, Londono, Barros, Guerrero, Mendoza, Nadal and Guerrero2024), including the lack of CD, low value and no demand for secondary materials, and difficulty in measuring financial benefits and profitability of the CE. The model is applicable to any sector in the LAC region.
2. Method
The development of the CDM was framed within qualitative research through two phases: (1) design of the CDM and (2) redesign of the CDM through a co-creation process with companies. In the second phase, we chose a participatory approach where companies from the oil and gas sector (as illustrative examples for the CDM application) were invited to co-redesign and validate the model to their particularities and needs. This intends to respond to the LAC needs for practical, collaborative, and impact-oriented models that could accelerate CE implementation in the region (Aguilar-Hernandez et al., Reference Aguilar-Hernandez, Guerrero, Vásquez-Ibarra, Rebolledo-Leiva and Gallego-Schmid2026).
During the first phase, we selected and adapted design approaches and standards that have been previously implemented in LAC. These include the industrial design methodology (Burdek, Reference Burdek2002) to inspire the phases of the model, the design competitiveness map (Manrique-López & Vargas-Rojas, Reference Manrique-López and Vargas-Rojas2017) to structure the diagnostic, the Cradle to Cradle (C2C) certification standard (Cradle to Cradle Products Innovation Institute, 2016) to define diagnostic categories and guiding questions, and social cartography (Barragán-León, Reference Barragán-León2019) to find information about social practices in a specific context. Therefore, the CDM aims to guide organizations in implementing CE principles through four phases called diagnostic, ideation, evaluation, and strategic planning. The model is designed to be used by CE consultants and officers together with personnel of companies in any sector.
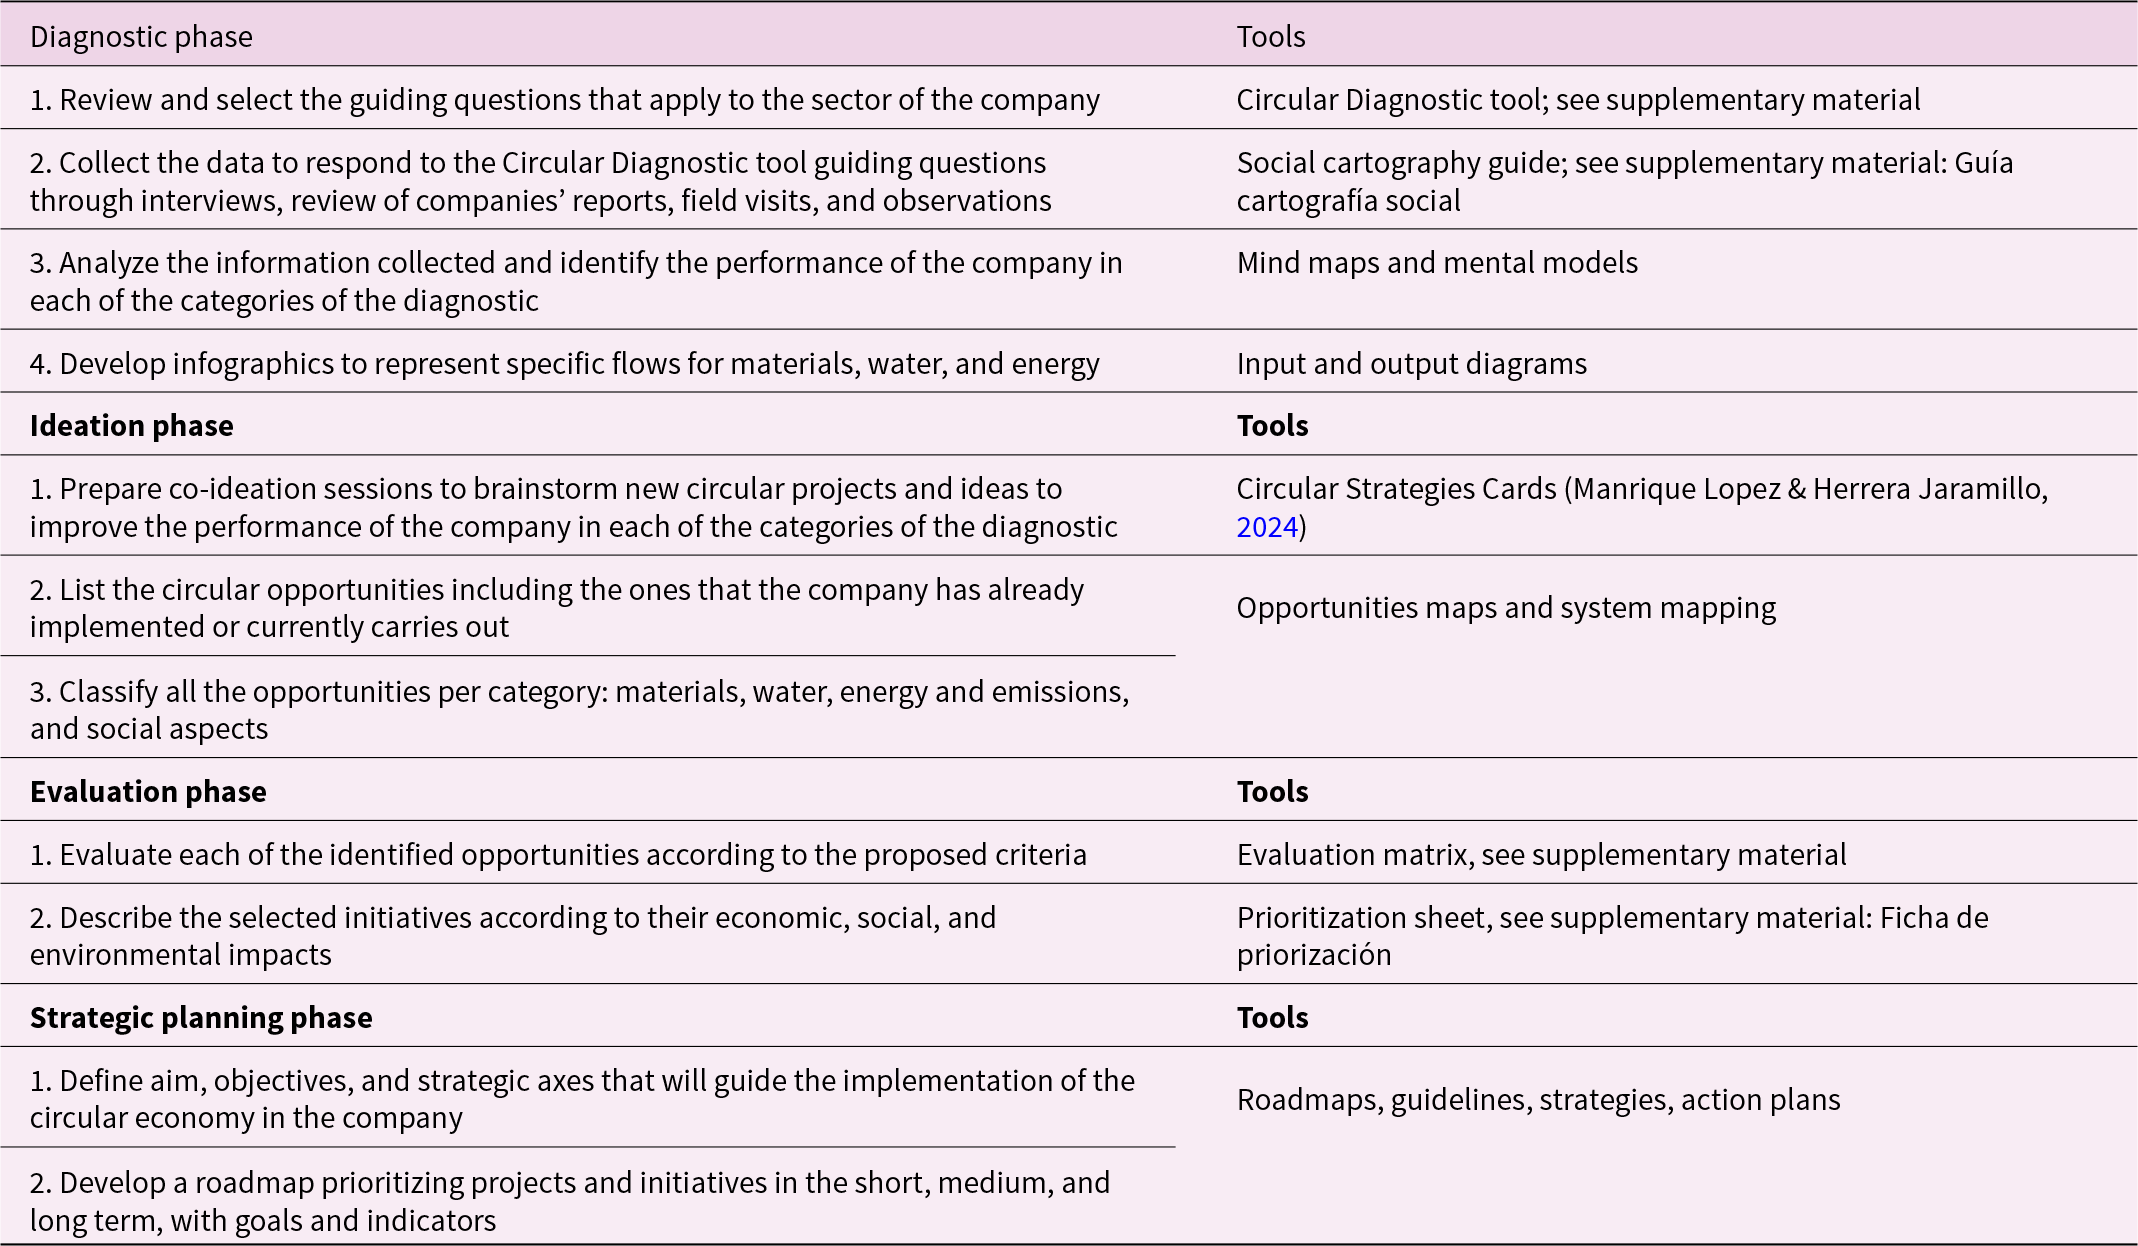
During the second phase, we redesigned the CDM model together with five oil and gas companies and selected the steps and tools that work best to achieve the CDM's aim. A step-by-step guide with the recommended tools by phase for its implementation in any other sector is provided in Table 1.
Step-by-step guide to CDM implementation

Table 1 Long description
CDM implementation is organized into four phases, each listing sequential steps and the tools used to complete them. The Diagnostic phase moves from selecting sector-relevant guiding questions to collecting data via interviews, report reviews, field visits, and observations, then analyzing results and creating flow infographics for materials, water, and energy using mind maps and input-output diagrams. The Ideation phase focuses on preparing co-ideation sessions, listing circular opportunities, and classifying them by materials, water, energy and emissions, and social aspects, supported by Circular Strategies Cards and mapping tools. The Evaluation phase assesses opportunities with an evaluation matrix and prioritization sheet, then documents selected initiatives by economic, social, and environmental impacts. The Strategic Planning phase defines aim, objectives, and strategic axes and develops a short-, medium-, and long-term roadmap with goals and indicators using roadmaps, guidelines, strategies, and action plans. Some steps list no specific tool, indicating the toolset may be flexible or implied by adjacent activities.
The CDM integrates several key drivers, opportunities, and barriers for the CE implementation in LAC (Gallego-Schmid et al., Reference Gallego-Schmid, López-Eccher, Muñoz, Salvador, Londono, Barros, Guerrero, Mendoza, Nadal and Guerrero2024). For instance, the driver focused on the reduction of production costs using waste is addressed through the guiding questions of the Diagnostic tool that inquire about the utilization of recycled materials (question 4) and the reincorporation of waste in production processes (question 9). Similarly, the commitment to reducing greenhouse gas emissions is reflected in questions regarding the development of renewable energy strategies and GHG reduction goals (questions 28 and 29). Social inclusion and service improvement are also prioritized, as evidenced by questions assessing the social impact on local communities (question 44) and measures to protect marginalized groups (questions 48–51). Furthermore, the objective of creating new jobs and businesses is examined through inquiries related to local economic improvements and collaborative actions with the community (questions 32 and 34).
Likewise, the CDM addresses several barriers to the region. One significant barrier is the low value and demand for secondary materials, which the CDM tackles through the implementation of circular strategies, described in the Circular Strategy Cards that invite for a valorization of secondary materials and an extension of product life cycle (Manrique Lopez & Herrera Jaramillo, Reference Manrique Lopez and Herrera Jaramillo2024). Another critical challenge in the LAC context is the difficulty in measuring economic benefits, which the CDM addresses through incorporating a cost–benefit analysis within its prioritization data sheet. Moreover, the lack of sufficient stakeholder cooperation is addressed by indicators in the Diagnostic tool that promote economic and social development in the communities where the company operates (questions 31–34) and synergies with other actors from any business sector (questions 35–38).
2.1. Design of the CDM
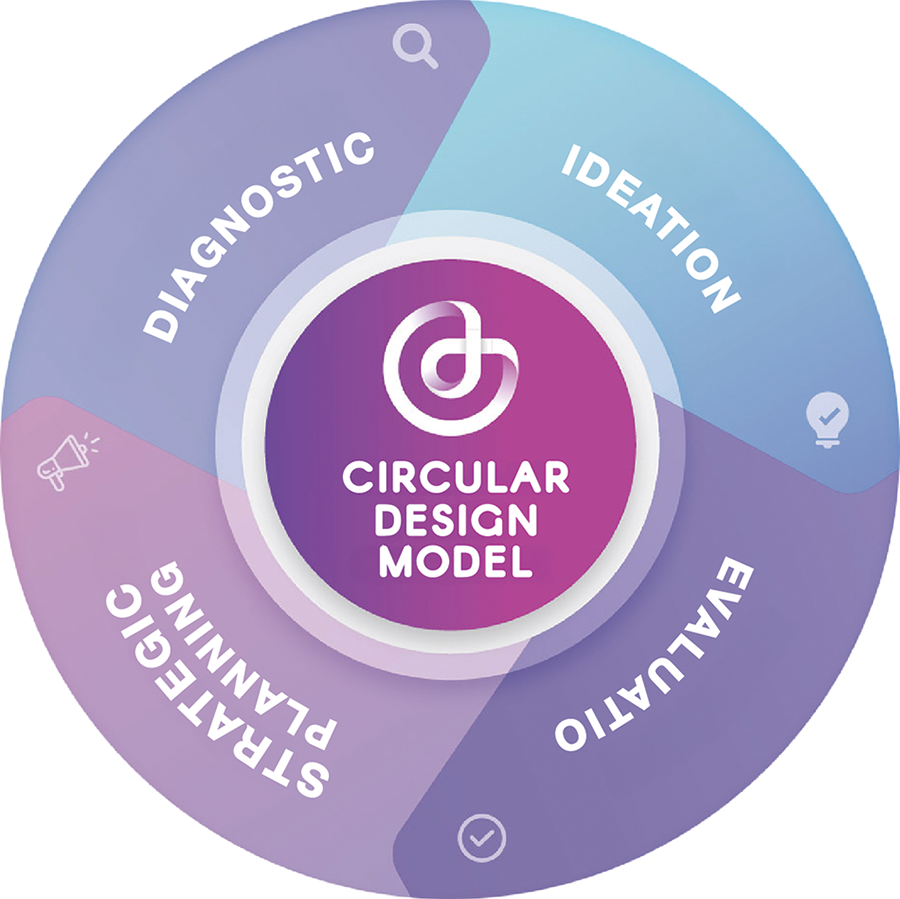
The CDM adopted the industrial design methodology (Burdek, Reference Burdek2002), which has its origins in the school of the Hochschule fur Gestaltung Ulm and has influenced design education and practice in Latin America since the first half of the twentieth century (Fernández, Reference Fernández2006). This approach is adapted to four main phases for the CDM: diagnostic, ideation, evaluation, and strategic planning (see Figure 1).
Illustration of the proposed circular design model.

2.1.1. Diagnostic phase
This phase of the CDM aims to assess a company's implementation of the three principles of the CE (Ellen MacArthur Foundation, 2013): eliminate waste and pollution, circulate products and materials, and regenerate nature. For this, a Diagnostic tool was created, organized by categories, indicators, and guiding questions, as in the design competitiveness map (Manrique-López & Vargas-Rojas, Reference Manrique-López and Vargas-Rojas2017).
First, we defined four categories inspired by the categories of the C2C Certified Product Standard Version 3.1 (Cradle to Cradle Products Innovation Institute, 2016): water circularity, material circularity, energy and emissions, and social aspects. Each category has one or more subcategories to better group the indicators (i.e., water use and management, energy use and emissions management, material input, material output, knowledge management, human rights risks and impacts, and social and business symbiosis).
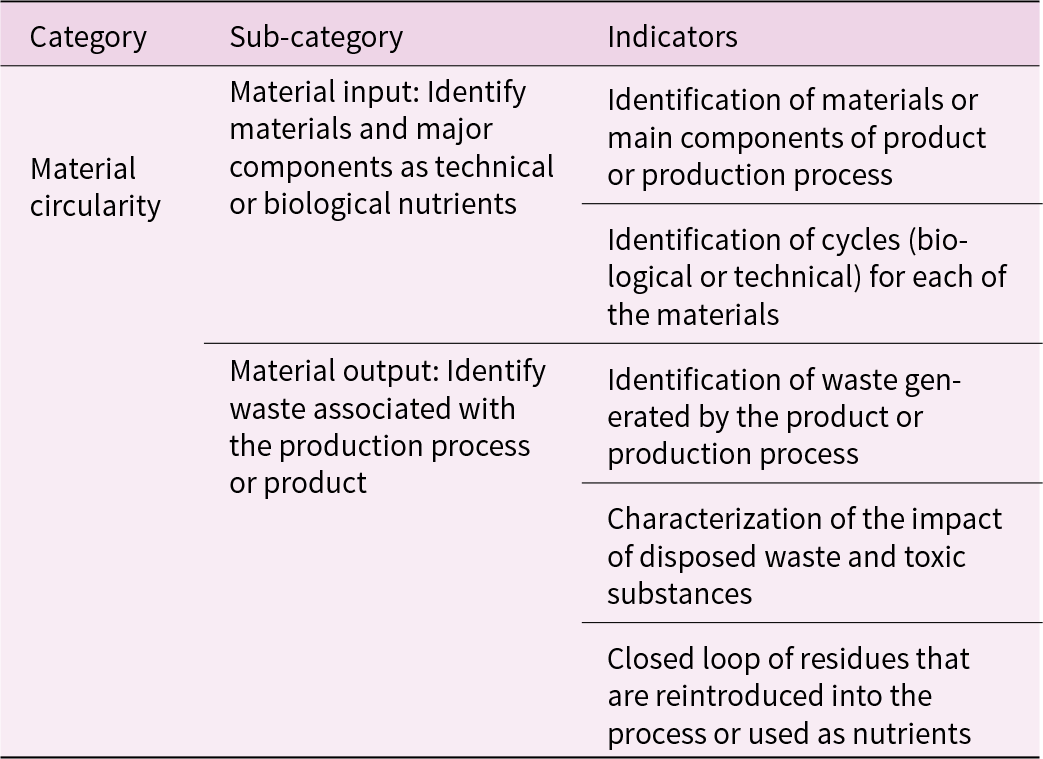
Given the high number of indicators available in the academic and practitioner literature (i.e., 365 reviewed by Kristensen & Mosgaard, Reference Kristensen and Mosgaard2020), we made a careful selection of those most relevant to the LAC context, leading to a practical set of CE micro-level indicators. The CDM has a total of 21 quantitative and qualitative indicators for this phase to be applicable to a broad set of sectors. Each category has a group of indicators that collectively measure and monitor CE progress. This feature encourages companies to improve while also clarifying the goal of each category at the company level (for example, see Table 2).
Material circularity indicators selected from the diagnostic phase

Table 2 Long description
Materials circularity is assessed through indicators that document both material inputs and material outputs for a product or production process. Input indicators call for identifying materials or major components and classifying each material as part of a biological or technical cycle. Output indicators focus on identifying waste generated by the product or process and characterizing the impacts of disposed waste and toxic substances. A further output indicator tracks whether residues are reintroduced into the same process or into other processes as nutrients, reflecting closed-loop practices. The table emphasizes comprehensive identification and characterization steps rather than providing quantities or performance scores, so it supports diagnostics and prioritization rather than direct benchmarking.
Second, following approaches as the C2C certification standard and similar assessment tools such as C-METRIC (Holly et al., Reference Holly, Schild and Schlund2024) and MATChe (Pigosso & McAloone, Reference Pigosso and McAloone2021), we developed the Diagnostic tool with 55 guiding questions to collect the information needed to assess each of the indicators: 15 questions for water circularity, 5 questions for energy and emissions, 10 questions for material circularity, and 25 questions for social aspects. The complete list of indicators and guiding questions is shown in the supplementary material: CDM Diagnostic tool.
Third, we created a social cartography guide, see supplementary material: social cartography guide, to collect information for three of the indicators of the social aspects category. It is a qualitative tool adapted in the design processes in LAC that goes beyond the geographical representation of a territory to include graphic narratives or infographics of social practices and problems (Barragán-León, Reference Barragán-León2019).
Implementing social cartography during the diagnostic phase of the CDM offers an innovative approach in CE to identify social aspects that are difficult to map, and their relations to water, energy and material flows.
The indicators, guiding questions, and the suggested tools of this phase allow a systematic assessment of a company's CE performance across the four categories.
2.1.2. Ideation phase
This phase aims to generate circular alternatives that respond to the results of the diagnostic phase in each category. It recognizes circular practices or projects that were or are being implemented by companies and in line with the CE principles.
We developed a set of 80 Circular Strategy Cards to facilitate the ideation process and generate new ideas that promote circularity (Manrique Lopez & Herrera Jaramillo, Reference Manrique Lopez and Herrera Jaramillo2024). Cards have been used to facilitate the process of ideation in CE. Konietzko et al. (Reference Konietzko, Bocken and Hultink2020), for example, developed the Circularity Deck (a card deck-based tool) that presents principles and examples according to the circular strategies of narrow, slow, close, regenerate, and inform material and energy flows. The Circularity Deck was tested by the authors in different workshops carried out in the Netherlands, Sweden, Germany, Latvia, and Finland (Konietzko et al., Reference Konietzko, Bocken and Hultink2020). In contrast, we grouped 80 Circular Strategy Cards that represent a total of 12 circular strategies and illustrated through 80 different actions applicable to the LAC context and related to the three CE principles. The Circular Strategy Cards were tested with participants from Spanish-speaking Latin American countries during a virtual symposium organized by Asociación Internacional de Joyas Sostenibles (Joyas Sostenibles, 2021).
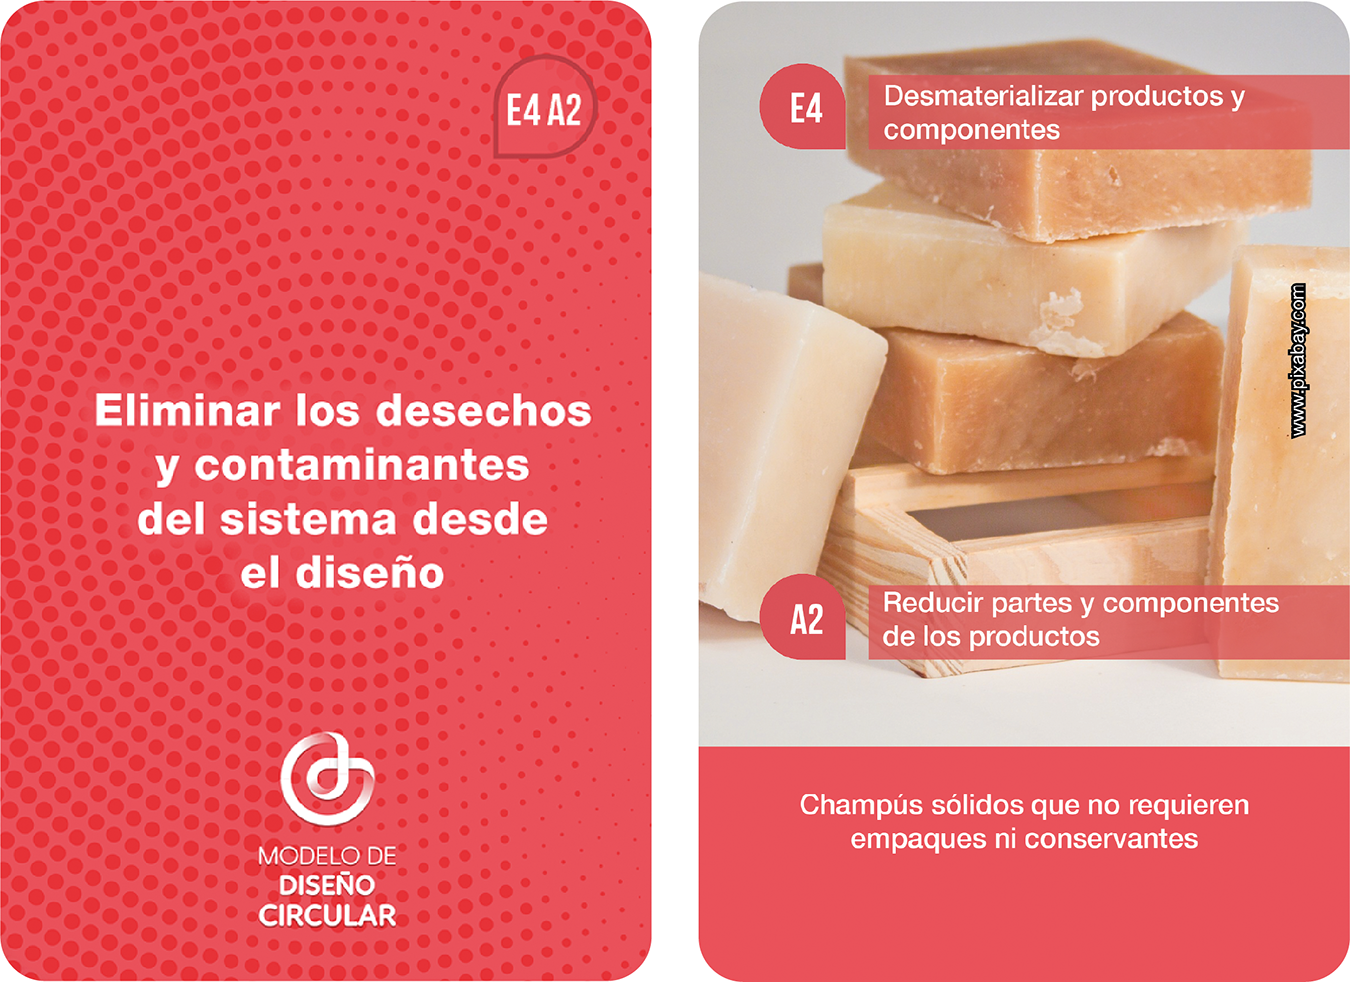
The Circular Strategy Cards seek to guide the CE consultants and companies’ personnel during ideation sessions by presenting a range of circular strategies and examples. To inspire participants, each card presents on one side a CE principle and on the other side a design strategy accompanied by an action and an example that illustrates its application (e.g., Figure 2). Following the diagnostic review, participants begin by reviewing the three CE principle cards to orient the session toward the three CE principles as the conceptual framework for idea generation. The cards that are more relevant to the gaps and opportunities identified in the diagnostic are then selected to guide the idea generation process. Random selection of cards is also an alternative for opening unexpected connections. Working individually or in teams, CE consultants and company personnel can use the cards as a creative trigger to generate solutions applicable to the specific context of the company.
Circular Strategy Card E4A2. This card represents strategy number 4 (E4), Dematerializing products and components, of CE principle 1, Eliminate waste and pollution (front side), through action 2 (A2), Reduce product parts and components (back side), as shown by the example Solid shampoos that do not require packaging or preservatives (back side).

2.1.3. Evaluation phase
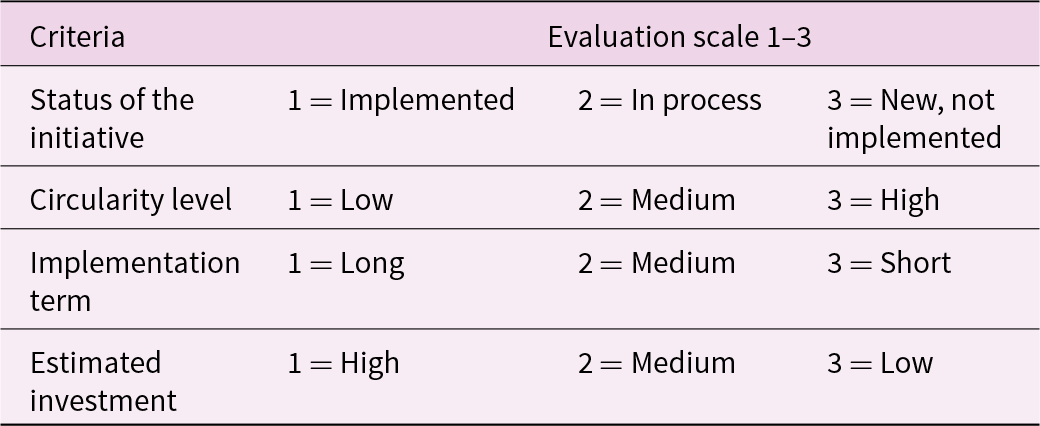
For this phase, we proposed a set of four criteria to evaluate the initiatives generated during the ideation phase, see Table 3.
Evaluation criteria and scale

Table 3 Long description
Evaluation uses a three-point scale applied to four criteria: initiative status, circularity level, implementation term, and estimated investment. For status, one means implemented, two means in process, and three means new and not implemented. For circularity, one is low, two is medium, and three is high. For implementation term, one is long, two is medium, and three is short. For investment, one is high, two is medium, and three is low. The same numeric range is reused across criteria, but the direction of what counts as more favorable depends on the criterion, so numbers should be interpreted only within each row.
The initiatives should be evaluated according to the CE principles, and its evaluation should prioritize novel and low-investment initiatives above those that require high investment and that were already implemented by companies. Therefore, a scale of 1–3 was included for each of the criteria:
• Status of the initiative evaluates the current circular project development level in terms of the initiative being already developed or completed (1), in process but not completed (2), or a new circular initiative that has not started implementation (3). This criterion evaluates new initiatives better since these are the ones that have resulted from the previous phase of the model.
• Circularity level according to the CE principles. Initiatives can be evaluated here with a low circularity level when the initiative does not achieve any of the principles, a medium level when the initiative relates to one or two of the CE principles, and a high level when the initiative relates to the three CE principles.
• Implementation term gives priority to initiatives that can be implemented in the short term (i.e., less than a year), followed by medium term (i.e., between 1 and 2 years), and long term (more than 2 years).
• Estimated investment evaluates better those initiatives that require a low investment to be implemented (i.e., less than or equal to USD 25,000), followed by medium investment (i.e., between USD 25,000 and USD 200,000), and high investment (i.e., more than USD 200,000).
Once the circular initiatives are evaluated and scored, those ranking highest should be selected to continue to the strategic planning phase.
2.1.4. Strategic planning phase
This phase focuses on developing further the shortlisted initiatives through the identification of the problem, CE principles, opportunities, risks and barriers, stakeholders, and a qualitative cost–benefit analysis. This phase suggests developing guidelines, roadmaps, strategies, or action plans to continue the progress toward the application of CE principles in the organization according to the results of previous phases and the interests of the companies. At least an action plan should be developed, grouping the circular initiatives identified in short-, medium-, and long-term projects together with their goal, main activities, resources, key actors, and expected impacts.
2.2. CDM redesign through a co-creation process
A redesign of the CDM through a co-creation process aims to provide a model that is more responsive to specific sector conditions and contributes to the adoption of the CE principles. This implies a participatory process where the company's personnel are actively involved with the CE consultants or researchers in reviewing, testing, and modifying the model's tools rather than serving solely as data sources. This approach produces a dual output, on one hand, a sector-adapted version of the CDM, and on the other hand, concrete CE outputs for the companies (e.g., initiatives, guidelines, and roadmaps). To achieve this, it is recommended that the CE consultants review first the existing related company documentation and introduce the companies’ personnel to CE concepts. Second, the CE consultants, together with the company personnel, perform a sequential application of the CDM phases, reviewing and adapting tools at each phase. Finally, the sector-specific outputs during the strategic planning phase are developed by the CE consultants and company personnel.
A co-creation process was carried out between November 2019 and June 2023 with three Colombian and two Peruvian companies of the oil and gas sector. Data collection activities per company and per model phases are detailed in supplementary material: Co-creation process with oil and gas companies in Colombia and Peru.
3. Results
To present the results of the CDM development, we have evaluated its effectiveness, visual thinking impact, changes resulting from the co-creation process, and usefulness after each of the applications in the participating companies. Effectiveness represents the ability to produce a desired result from the diagnostic and ideation phases of the CDM. The desired result in this case corresponds to a high number of circular initiatives before prioritizing. Visual thinking impact refers to the contribution of the CD tools of the model that incorporate visual thinking (i.e., social cartography, Circular Strategy Cards, and infographics) during different phases of the model. Changes to the CDM during the redesign phase allowed us to provide a tailored model for companies in the oil and gas sector. Finally, usefulness refers to the quality of the model being useful for companies, considering the actions taken by the companies after the CDM's application.
3.1. CDM effectiveness
To evaluate the effectiveness of the CDM, we reviewed the number of CE opportunities co-identified and assigned the following levels of effectiveness: low level for less than 10 new circular initiatives identified, medium level for 11–30 initiatives identified, and high level for more than 30 initiatives identified.
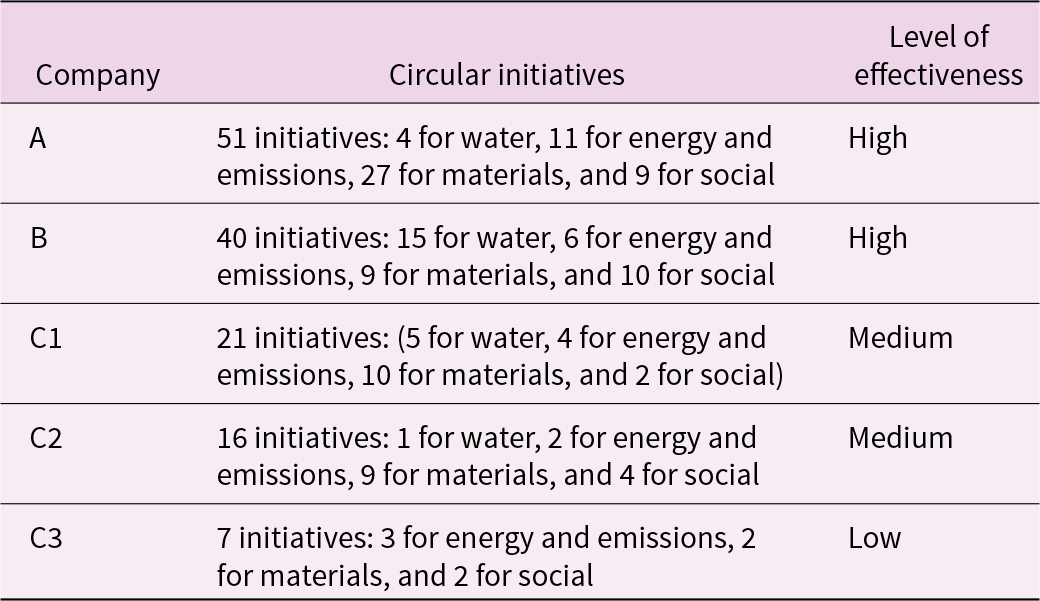
Table 4 presents the level of effectiveness per company according to the total number of circular initiatives identified during the ideation phase.
Evaluation of CDM effectiveness

Table 4 Long description
Company circular initiatives are listed by count and category (Water, Energy and Emissions, Materials, Social) alongside an overall effectiveness level. A reports 51 initiatives and is rated high, with most in Materials and notable activity in Energy and Emissions and Social. B reports 40 initiatives and is also rated high, led by Water and Social initiatives. C1 has 21 initiatives and is rated medium, with Materials as the largest category. C2 has 16 initiatives and is rated medium, again dominated by Materials with smaller counts in the other categories. C3 has 7 initiatives and is rated low, with no Water initiatives and small counts across Energy and Emissions, Materials, and Social. Overall, higher effectiveness aligns with higher total initiative counts, though category emphasis differs by company.
We applied social cartography with two main goals in Company A: to represent the relationships and needs between the community and water in the territory, identifying opportunities for circularity in their production fields; and to depict the community's perceptions of the local impact of the company's productive activities to identify collaborative or exchange actions. Around 20 people from three different villages participated in the social cartography sessions, where they were asked to identify economic activities such as agriculture and livestock, environmental and social problems, and issues and opportunities related to water and energy. This tool contributed to a better connection and trust between the participants, where only members of the consultancy team participated and no personnel from Company A. Social cartography was not applied in the other companies due to communities’ relation protocols that did not allow external actors to interact on behalf of the companies. In these cases, information to answer the guiding questions of the related indicators was provided by the companies’ social responsibility departments.
During the ideation phase, we used the Circular Strategy Cards in Company A in a face-to-face brainstorming session only with two of the consultancy team members due to COVID-19 restrictions. The cards were used during online sessions with Company B to find opportunities internally within the company. In the other three companies, the Circular Strategy Cards were not applied because of the short period available to apply the CDM, where priority was given to diagnostic sessions with companies’ personnel.
The duration of the CDM application, the use of visual thinking techniques, and the Circular Strategy Cards made an impact on the results of the companies in terms of the number of circular initiatives found for each of them. In Companies A and B, where the CDM application was between 5 and 6 months and the Circular Strategy Cards and infographics were used, the level of effectiveness was high according to the defined scale. Company A had a total of 51 circular initiatives identified, of which 34 were new. Company B had 40 circular initiatives identified during the internal or first application, of which 32 were new. In Companies C1 and C2, the level of effectiveness was medium, with 21 and 16 initiatives identified. In Company C3, the level was low, with seven circular initiatives. In the last three companies, the CDM application was performed in parallel with a span of 3 months.
3.2. CDM visual thinking impact
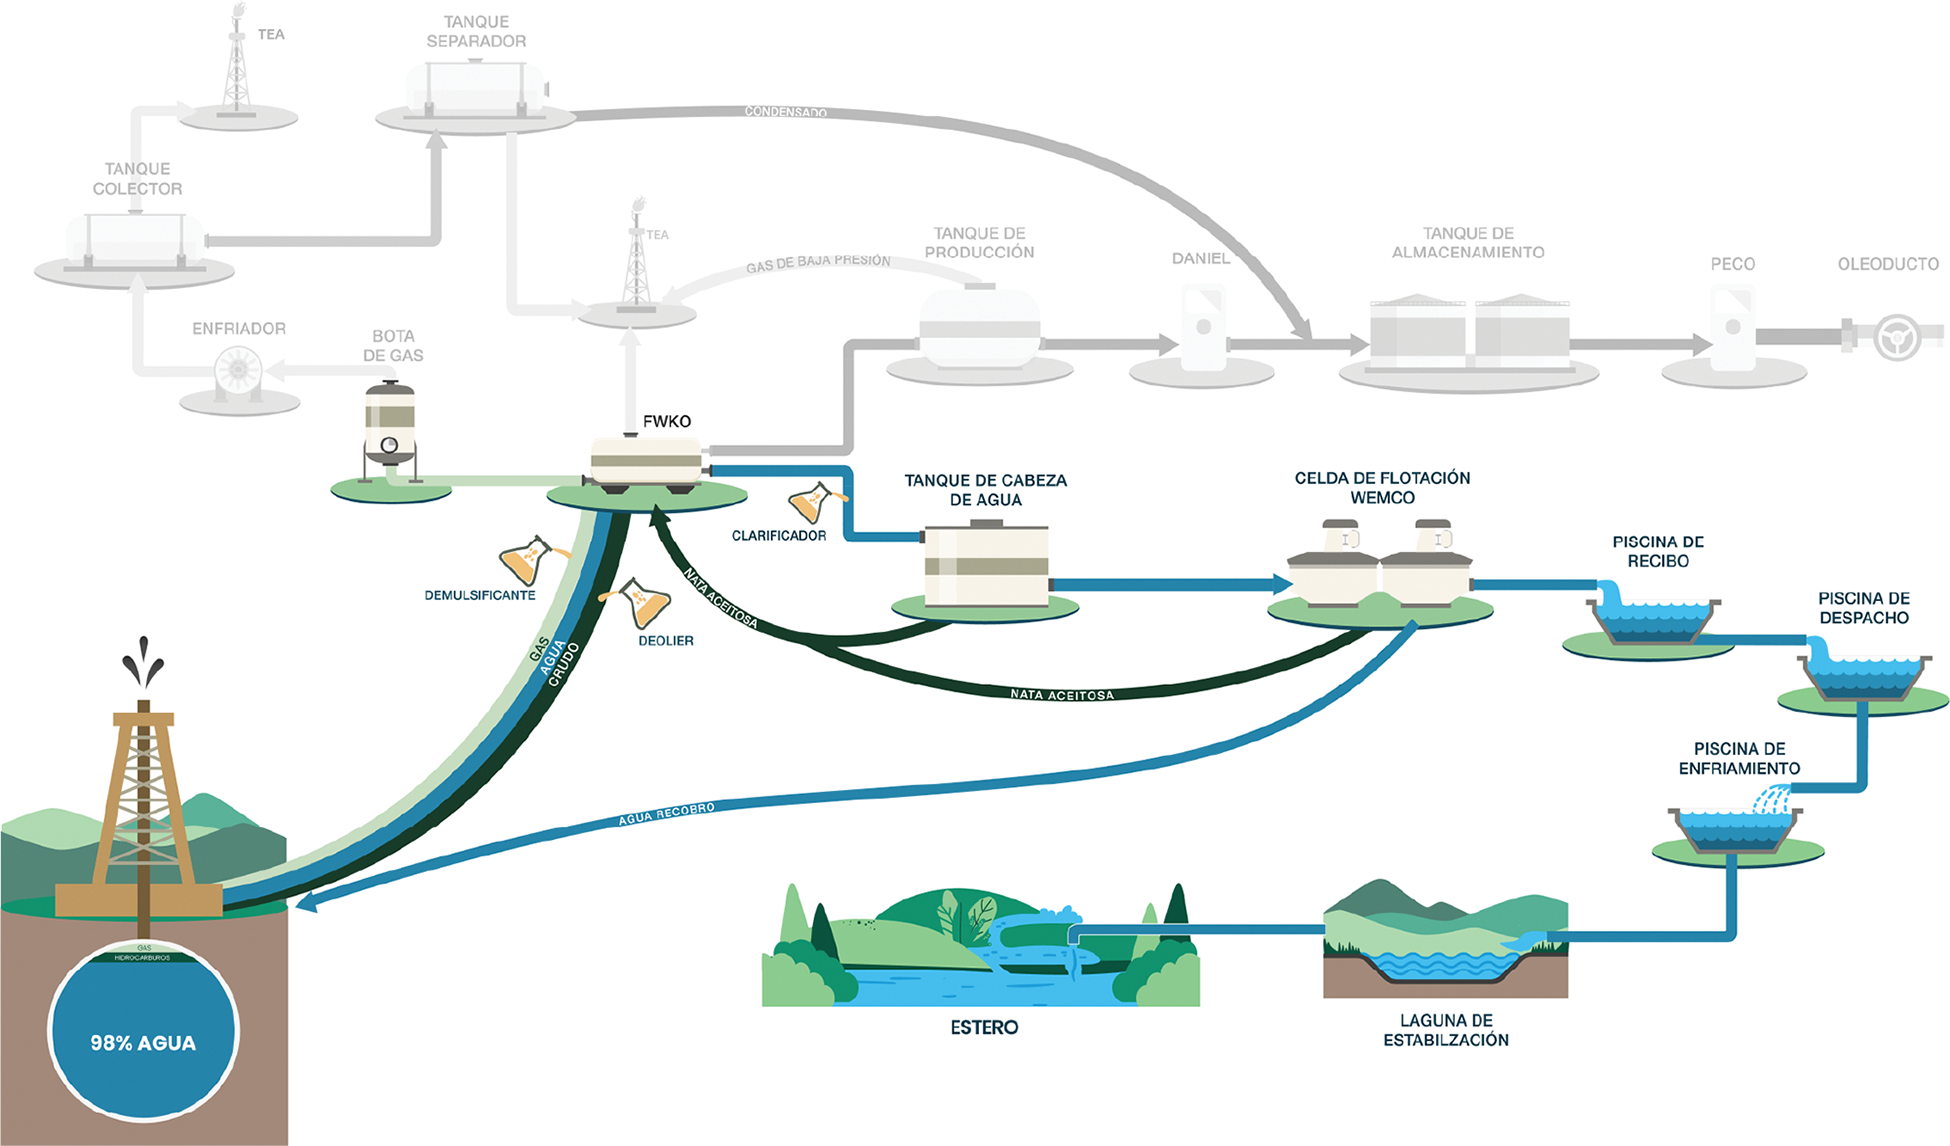
In Companies A and B, the use of infographics supported all participants in understanding the complex process of crude oil production and visualizing the energy and water flows from its extraction until its discharge. Infographics further enabled the companies to identify the different phases, sub-materials, and residues in these flows. This follows principles of visual thinking, as an ability to make synthesis through forms and resources of visual language (Escobar & Díaz, Reference Escobar and Díaz2017), which could be considered a usual skill among professionals of disciplines related to design. The infographic displayed in Figure 3 presents an example of the water flow of one of the companies. This served as a key element in communication during working sessions and interviews.
Example of water flow infographic using visual thinking principles.

Figure 3 Long description
This infographic illustrates the water flow in crude oil production, highlighting key stages and components. The process begins with extraction at a site labeled ′89 percent Agua,′ indicating the proportion of water in produced fluids. The flow progresses through exploration, perforation and extraction, leading to ′Tanque de Producción.′ Water is then routed through ′Tanque de Almacenamiento′ and ′Pozo,′ followed by treatment in ′Tanque de Carga de Aditivos′ and ′Celdas de Flotación.′ The treated water moves to ′Piscina de Sedimento′ and ′Piscina de Evaporación,′ before final discharge into an ′Estero′ and ′Laguna de Estabilización.′ Connections are marked with labels such as ′Curvación,′ ′Separador,′ ′Deshidratador,′ and ′Desarenador,′ indicating processing steps. The layout follows a left-to-right flow, with branches and returns clearly depicted. Icons represent wells, tanks and ponds, supporting understanding of the process. Spanish labels are used throughout, providing technical terms for each stage. The infographic effectively communicates the separation, treatment and discharge of water in oil production.
Similar infographics were created for industrial and domestic water, and energy and emissions flow of Companies A and B. They contributed to communicating and analyzing the information as well as identifying opportunities. For instance, in Company B, we found that the industrial water from a nearby oil production facility was being wasted and it could be redirected to the company site for reuse as industrial and domestic water within the pumping station.
Infographics and the Circular Strategy Cards were not implemented in Companies C1, C2, and C3 due to limited time and traditional practices. For these companies, a reduced number of online workshops were performed, and the process was carried out in parallel. The application of visual thinking in the process had a direct impact on the effectiveness of the model, as these companies had a medium and a low level of effectiveness, and a lower number of initiatives identified compared with the number of initiatives of Companies A and B.
The infographics and Circular Strategy Cards became communication elements so that, on the one hand, we could understand the sector's operational processes, and on the other hand, the companies’ staff could understand the principles and strategies of CE. These visualization tools facilitate the absorption of information, even for those with no prior experience in CE, which in turn accelerates the speed with which changes can be implemented in the organization. These visual resources not only facilitate the synthesis of information but also act as diagnostic features since key CE strategies can be quickly identified by companies.
For Companies A and B, opportunities became more tangible, allowing teams to prioritize CE strategies without losing sight of the big picture. In addition, the implemented visualization tools also allowed an understanding of interactions between different areas of the organization and processes that can be optimized through circularity. For instance, the water flow infographic used in Company A allowed us to explore, with the Environmental Professional and Coordinator, circular alternatives to reuse the sludge generated from the water treatment process. The personnel from Production and Special Project units were working on an alternative to reuse industrial water in an enhanced recovery process by injecting the wastewater to increase the amount of oil extracted. Professionals from different units such as the Environmental Auditor, Junior Facility Engineer, Facility Leader, Instrumentation and Automation Supervisor, and Integral Maintenance Supervisor provided information about inputs and outputs and environmental impacts of each of the phases of the water flow.
3.3. CDM co-creation approach
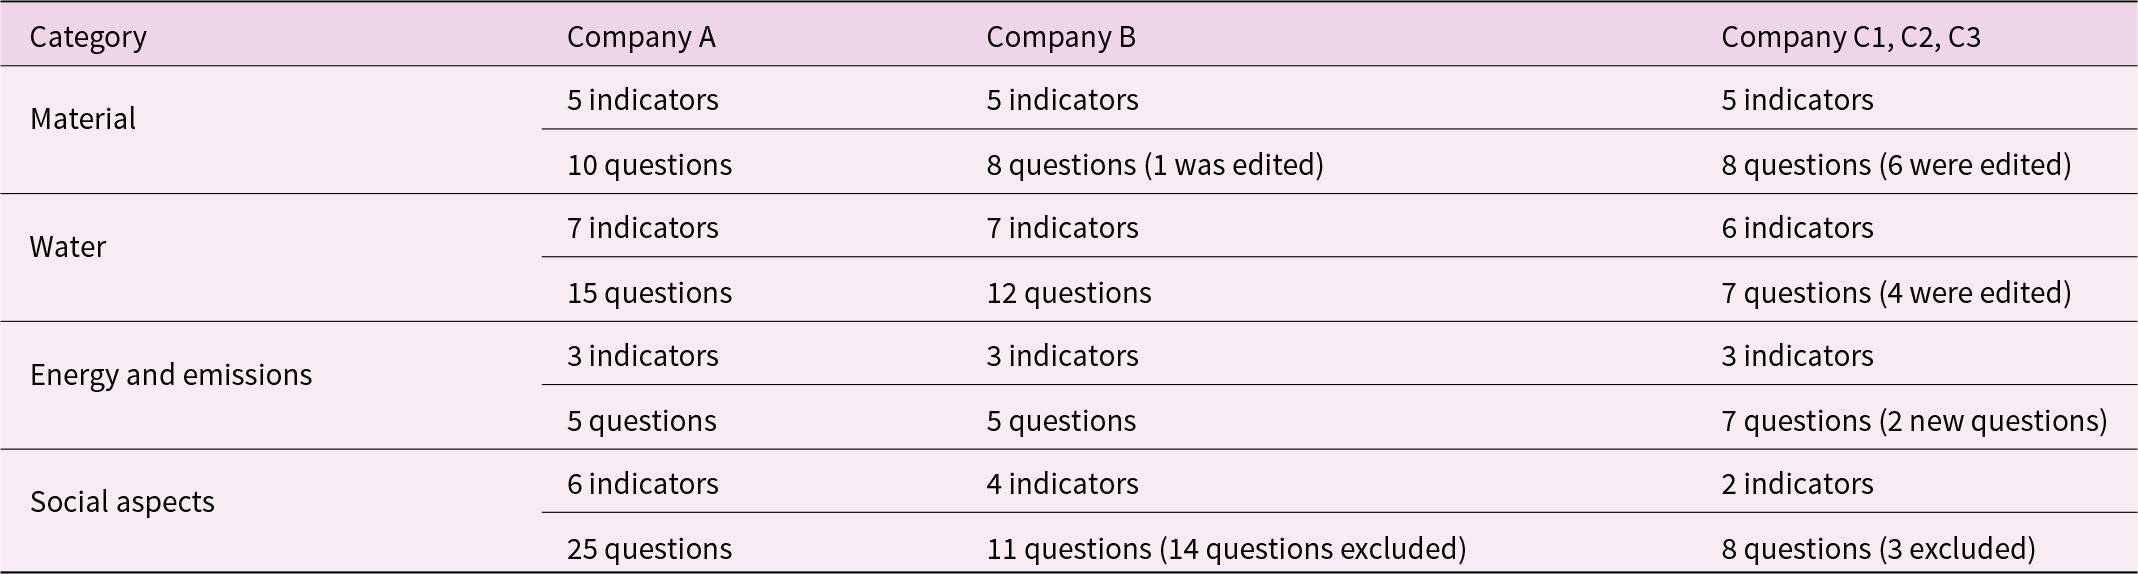
The main adaptations and changes to the CDM applied to the participating companies were related to the number of guiding questions used (see Table 5), and the evaluation criteria used to prioritize the circular initiatives.
Indicators and guiding questions changes based on the CDM co-creation phase

Table 5 Long description
Counts of indicators and guiding questions are compared across four categories for three companies, with Company C combining results from phases C1 to C3. Materials: all three have 5 indicators; questions drop from 10 in Company A to 8 in Company B (including one edit) and 8 in Company C (six edited). Water: indicators are 7 for Companies A and B and 6 for Company C; questions fall from 15 to 12 to 7, with four edits in Company C. Energy and emissions: all have 3 indicators; questions stay at 5 for Companies A and B but rise to 7 for Company C, including two new questions. Social aspects: indicators decrease from 6 in Company A to 4 in Company B to 2 in Company C; questions drop from 25 to 11 in Company B (14 excluded) and to 8 in Company C (three excluded). Overall, indicator totals change little except for reductions in water and social aspects for Company C, while guiding questions generally decrease across companies, with the main exception of added questions in energy and emissions. Edits, exclusions, and new questions are noted, but the table does not explain the reasons or criteria behind those changes.
The category of social aspects had a large reduction in the number of guiding questions, as it was determined that questions related to the indicator of decent work practices and respect for fundamental labor rights and principles were not needed, as the sector is very well monitored in this regard by its stakeholders in Colombia and Peru. Additionally, we were limited to contacting communities near operation sites because of a long history of incidents and conflict of the sector with communities and illegal armed groups. Therefore, social cartography was implemented only in Company A where relations with communities are positive, and safety was guaranteed for our team.
In Companies C1, C2, and C3, the number of guiding questions in the category of water circularity was reduced by almost half because water is not a main resource during natural gas transportation. Supplementary material: CDM Diagnostic tool presents the indicators and guiding questions used in each of the companies.
Oil and gas as resources that become consumed were excluded from the analysis. Instead, we focused the diagnostic phase on the operational circularity of long-term assets and waste by-products, which are resources that can be subject to circular measures.
Complementary field diagnostic tools were prepared during the process for Company A to complete the diagnostic of each category and were consequently used in the other companies. These tools described specific goals and data collection instruments such as interviews, observations, data, and photography records. For instance, one of the specific goals for the category Water circularity was to verify the industrial water flow of the oil field. Its related data collection instruments were instructed in terms of a guided tour and observation of the oil production and wastewater treatment process, interviewing personnel on-site to verify the water flow infographic, and requesting information about inputs and outputs during this flow.
The evaluation criteria presented in Table 3 were used to prioritize Company A initiatives and applied without major changes. These criteria were equally important during the evaluation process with this company. However, for Companies C1, C2, and C3, additional evaluation criteria were included, and weight was assigned to each of them. Circularity level, Implementation term, and Estimated investment were kept as criteria with a weighting of 30%, 10%, and 15%, respectively, and the following three criteria and weights were added:
• Stakeholder engagement 5%: assesses the level of integration for project implementation among different stakeholders. It is evaluated as low engagement if it impacts one actor, medium engagement if it impacts two or three actors, and high engagement if it impacts four or more actors.
• Technical and technological complexity 15%: assesses the degree of complexity of the technical and technological capabilities required to implement the project.
• Alignment with business core 10%: identifies the degree of affinity between the initiative and the core business activity.
During the strategic planning phase, six prioritized initiatives in Company A were further described, including their linear problem, circular focus, opportunities, and threats, together with a cost–benefit analysis for each of them. Additionally, we developed CE guidelines for this company.
In Company B, strategic planning included specific guidelines for the asset management process, video clips, press releases, internal publications, and circular recommendations to the suppliers.
For Companies C1, C2, and C3, a project template was adapted from the Colombian Ministry of Commerce, Industry, and Tourism (Ministerio de Comercio Industria y Turismo & Centro Nacional de Producción Más Limpia, 2020) and applied to the three prioritized initiatives per company to provide specific information about the economic, social, and environmental impacts, key actors, timeline, and indicators for monitoring their implementation, see supplementary material: Ficha de priorización.
3.4. CDM usefulness
To evaluate the results’ usefulness, we reviewed the continuation of CE projects and strategies resulting from the CDM's application. We assigned a high level if companies created programs or action plans based on the CDM process, a medium level if companies integrated CE indicators in their practices and developed some of the prioritized circular initiatives, and a low level if companies did not use further any outcome of the CDM. To evaluate this, we reviewed their sustainability reports and information published on their websites and social media channels.
The level of usefulness of the CDM in Company A is high. As described in its latest sustainability report, 4 years after the CDM was applied, this company created a CE program to work on the developed CE strategy and has implemented the six initiatives that were prioritized by the model. For instance, under the identified circular initiative Pipe re-manufacturing, the company reconditioned more than 3,000 units of pipes equivalent to 99% of the total in 2024 and therefore avoided purchasing new pipes. Additionally, in the last 2 years, the company has taken a step further by evaluating the maturity level of its circularity, incorporating CE indicators, and identifying new initiatives.
Company B's website presents the CE roadmap and main outcomes and activities collaboratively developed during the CDM application, such as diagnostics and pilots carried out with suppliers. Through an interview, it was known that the company has fully adopted the suggested CE procurement indicators and started working with suppliers on the prioritized initiatives such as remanufacturing of electric and electronic appliances and reuse of industrial and domestic wastewater. As there is no evidence of new strategic-level engagement beyond the initiatives identified by the model, we consider that Company B has a medium level of usefulness of the CDM.
Companies C1, C2, and C3 have adopted the CE indicators and specific goals that were given during the CDM application (e.g., circular asset management with a goal of at least 30% of decommissioned assets being reused, repaired, or recycled by the year 2030). However, it was not possible to track the progress of completed circular initiatives by February 2025, and no related information was published in their most recent sustainability report, 1 year after the CDM implementation. Therefore, we consider the level of usefulness in these companies is still low.
4. Discussion
Given the momentum of the CE in the LAC region, the CDM acts as a complementary framework to the macro-level policy instruments, providing actionable micro-level guidelines that empower firms to implement CE strategies. At the micro-level, the integration of CD into organizational processes is essential for companies aiming to navigate the complexities of the CE, enabling them to assess their current practices and recognize areas for improvement.
The CDM proposed in this study differs from other CD and CE frameworks in that it guides companies through a four-phase process and was co-created with LAC companies rather than derived from European literature or contexts. The CDM extends beyond Moreno et al.’s conceptual CD framework, which was derived from literature and aimed at product designers, rather than companies and CE consultants, by providing a structured process from diagnosis to strategic planning. Unlike European assessment tools such as C-METRIC and MATChe, which classify companies by circularity or readiness levels without guiding further action, the CDM connects the diagnostic findings directly to ideation, evaluation, and strategic planning, which makes the model action-oriented rather than assessment-only. Additionally, while prior LAC studies addressed CE in specific sectors or waste streams, to our knowledge, none of them provided a company-level framework that guides companies from diagnosis to strategic planning toward CE implementation.
Recognizing the lack of CD in the LAC context, we identified that the use of CD tools via infographics and the Circular Strategy Cards in Companies A and B led to a higher number of circular initiatives being identified and implemented compared to those that did not use these tools. This underscores the model's effectiveness in driving tangible changes within organizations. The CDM not only aids in diagnosing existing flows – such as material, energy, and water – but also guides firms in ideating and evaluating new circular initiatives that reflect their specific contexts. Each phase of the CDM introduces an innovative tool to implement CE principles. For instance, in Companies A and B, the diagnostic tool together with water flow infographics allowed personnel of different units to identify the reuse potential of industrial wastewater that had previously gone undetected. During the ideation phase in Companies A and B, the Circular Strategy Cards identified 51 and 40 initiatives, respectively, compared to the 21, 16, and 7 identified in Companies C1, C2, and C3, where the cards were not used. During the evaluation phase, the proposed evaluation criteria helped Company A to prioritize 6 initiatives from 51, and new criteria were included for the companies, allowing companies to adapt the criteria to their specific contexts and needs. Finally, during the strategic planning phase, Company A developed a CE program based on the CDM outputs and implemented all six prioritized initiatives, including reconditioning more than 3,000 pipe units, demonstrating the phase's capacity to produce actionable and practical results.
The CDM integrates specific opportunities, drivers, and barriers that characterize the LAC region. The Diagnostic tools are designed to identify and leverage drivers such as waste utilization and social impact, while also addressing barriers such as the low demand for secondary materials and challenges of measuring profitability in the LAC context. By incorporating questions and indicators that reflect these local realities, the model ensures that companies navigate the complexities of the CE landscape in LAC. This landscape differs from the European one in that it is characterized by a less mature CE infrastructure, lower CE literacy among company personnel, underdeveloped secondary materials markets, and strained relationships between companies and local communities. The structure and instruments selected for the CDM aim to respond to this specific LAC context by including tools such as social cartography for contexts where formal survey methods fail; visual thinking for contexts where CE literacy is limited; and co-creation processes for contexts where companies need to reshape the model rather than applying a framework from a different context.
The CDM has been designed for use in any industrial sector, even those characterized by significant resource extraction and consumption patterns. The CDM provides a practical pathway for these sectors to engage in CE processes, enabling them to find their tailored core-business circular opportunities and enhance collaboration with suppliers and stakeholders. In our case study, the exclusion of oil and gas from the co-creation process responds to the location of participating companies in the upstream and midstream segment of the value chain. At this extractive stage, oil and gas represent volume flows destined for transport (i.e., barrels of crude oil extracted and transported and volume of extracted and compressed gas), where opportunities for circular intervention are limited by operational and regulatory constraints. By contrast, the high intensity of main assets, by-products, and generated waste offer real potential for reuse, repair, reconditioning, and recycling strategies. In studies focusing on the downstream oil and gas sector, circularity can also be applied to the design of petrochemical products (e.g., plastic products). The adaptations to the evaluation criteria made during the co-creation process with the oil and gas companies have been incorporated into the evaluation matrix, demonstrating the CDM's capacity to be refined through sector-specific application while remaining applicable to any sector.
4.1. CDM limitations and further research
The exclusion of crude oil and gas flows reflects the current scope of the companies involved and not a definitive exclusion in the CDM. We recommend including a related indicator if the CDM is going to be applied in companies of the downstream value chain. This indicator is suggested and currently under review by the European Sustainability Reporting Standards for the oil and gas sector and is related to the Total volume of crude oil sold with a breakdown according to the final destination of the resource to petrochemical segment, fuel products, and other (EFRAG SRB, 2024). Oil and gas can thus be included in circularity assessments when evaluating companies working downstream in the petrochemical value chain.
The social indicators and guiding questions within the oil and gas sector could only be applied to a limited extent due to various reasons. First, the companies did not acknowledge a relation between social impacts and CE; and second, we only could apply the suggested CD tool in Company A. Nevertheless, it is important to map the social problems and opportunities in the areas where companies have influence. For instance, through the different sessions with communities and stakeholders of Company A, a lack of access to basic services such as drinking water, sewage systems, and electricity was identified. Likewise, the shortage of educational centers and the poor condition of existing infrastructure affect the education of children and young people. The inoperability of healthcare centers exacerbates the situation regarding access to medical services. Despite these challenges, the community showed a remarkable interest in participating in entrepreneurial projects and sustainable agricultural practices that contribute to the CE and environmental conservation. Social synergy initiatives, circular agriculture projects, and reuse of the decommissioned assets were identified as key initiatives for improving local infrastructure and contributing to the economic and social dynamics of the region. Beyond the company level, the CE projects and commitments developed through the CDM could contribute to national CE goals, and further research is needed on how the model results could support macro-level data collection in LAC.
5. Concluding remarks
The goal of this study was to develop a CDM that contributes to the implementation of CE strategies at a micro-level in the LAC context. The results demonstrate that the CDM effectively guided the five companies in the oil and gas sector in identifying, prioritizing, and initiating their CE actions that contribute to a structured transition toward more sustainable operations.
To strengthen the CDM social category, we recommend enhancing stakeholder engagement by including regular participation of community members and local leaders. CE academic research in the LAC region has been misaligned with practitioners’ and communities’ needs (Aguilar-Hernandez et al., Reference Aguilar-Hernandez, Guerrero, Vásquez-Ibarra, Rebolledo-Leiva and Gallego-Schmid2026). Additionally, it is necessary to recognize that community relationships in the region are often shaped by historical conflicts between extractive industries and local populations, which makes a stakeholder-oriented approach essential for an effective CE transition (Gallego-Schmid et al., Reference Gallego-Schmid, López-Eccher, Muñoz, Salvador, Londono, Barros, Guerrero, Mendoza, Nadal and Guerrero2024). This should be complemented by comprehensive social mapping as a continuous process, allowing for regular updates on social issues and opportunities. Implementing the social indicators and guiding questions of the model will clarify the connection between social impacts and CE and encourage companies to consider their negative or positive impact on social aspects such as access to services, education, and health among communities.
The application of the model revealed significant variations in effectiveness depending on factors such as implementation time, the use of visual thinking, and company engagement. Notably, companies that incorporated visual tools – such as infographics and Circular Strategy Cards – identified a higher number of CE initiatives and demonstrated a clearer pathway of CE adoption. Moreover, the study highlights the growing momentum of CE in Colombia and Peru that resonates with broader trends in LAC, where the integration of CE in extractive and industrial sectors remains an emerging yet increasingly relevant strategy for a CE transition (United Nations Environment Programme et al., 2023).
The steps recommended for the CDM application and described in Table 1 are intended for companies of any sector and include the improvements made to the model during the redesign phase with companies in the oil and gas sector. The redesign phase of the CDM demonstrated the applicability of the CDM within the oil and gas sector. Considering the changes in the guiding questions during this phase, we suggest the first step for its application in any other sector is to review and select the guiding questions that apply to a specific sector. The other steps recognize the changes we encountered during the redesign process by including additional CD tools and evaluation criteria that were best implemented. The model still needs to be validated in other countries and sectors.
In the supplementary material: Co-creation process with oil and gas companies in Colombia and Peru, we provide recommendations linked to each of the CE's principles for each of the categories of the CDM. If applying the CDM to different sectors such as construction and manufacturing, the focus should shift to their primary materials, components, and operations. Additionally, the strategic planning phase should present strategies, actions, and projects to increase the circular practices already in place in each country such as the use of local and artisanal materials for the different use or climate floors of the region (e.g., Colombian house made of a timber frame plastered with lime or mud, a technique called bahareque, when built over 1,600 m above sea level) ( Moreno, Reference Moreno2020; Rincón et al., Reference Rincón, Montoya and Archila2023).
The CDM needs to be validated in other economic sectors, and it is therefore necessary to adapt its tools and integrate the phases of the model into the specific context and needs of the sector. We suggest reviewing the 21 indicators and 55 guiding questions of the Diagnostic tool of the CDM and selecting the ones that apply to the specific sector. This selection could be done through a participatory process where different stakeholders are involved and consider the national strategy and sectoral objectives of the country as well.
Supplementary material
The supplementary material for this article can be found at https://doi.org/10.1017/sus.2026.10074.
Acknowledgements
We thank all personnel from the companies that participated and provided feedback during the redesign phase of the CDM, and Dr. Fernando Alberto Alvarez Romero for his valuable insights into circular design practices in Latin America and the Caribbean. We also thank the anonymous reviewers for their constructive comments and suggestions, which helped strengthen the entire manuscript.
Author contributions
J.A.H.J.: conceptualization, methodology, data collection, analysis, writing, reviewing, and editing. A.M.L.: conceptualization, methodology, data collection, analysis, and writing. G.A.A.H.: writing, reviewing, and editing. V.B.: writing, reviewing, and editing. J.M.M.: writing, reviewing, and editing.
Data availability statement
The CDM tools developed in this study, including the circular diagnostic tool, social cartography guide, and evaluation matrix, are available in the supplementary material accompanying this article. Raw interview data, company-specific diagnostic responses, and proprietary information collected from the participating oil and gas companies are not publicly available due to confidentiality agreements established with the participating companies through consultancy contracts with CAIA Ingeniería S.A.S.
Funding statement
The first phase of the development of the CDM was funded by Universidad de Bogotá Jorge Tadeo Lozano under the open call 2020 and project Fase I: Creación de un Modelo Metodológico de Diseño Circular basado en la Economía Circular y el Pensamiento Estratégico de Diseño. The second phase of the development of the CDM was funded by CAIA Ingeniería through consultancy projects with companies of the oil and gas sector during 2019–2023. Glenn A. Aguilar Hernandez is a Marie Curie Research Fellow of the UNravelling the socioeconomic and environmental Impacts of Circularity in Latin America (UNICA) project, which is funded by the European Commission under Marie Skłodowska-Curie Actions (Grant Agreement: 101103532).
Competing interests
The authors declare no conflicts of interest associated with this publication.


 Open access

