1 Introduction
In metrical stress theory, Polish is a classic example of a bidirectional stress system with internal lapses (McCarthy & Prince Reference McCarthy and Prince1993, Kager Reference Kager2001, McCarthy Reference McCarthy2003). In fact, all theoretical analyses characterise Polish as manifesting rhythmic secondary stresses, with a lapse adjacent to primary stress in odd-parity words: [(ˌσσ)(ˌσσ)σ(ˈσσ)] (e.g. Dłuska Reference Dłuska1974, Halle & Vergnaud Reference Halle and Vergnaud1984, Rubach & Booij Reference Rubach and Booij1985, Franks Reference Franks1985, Hammond Reference Hammond1989, Kraska-Szlenk Reference Kraska-Szlenk2003). Since this pattern is presented as lexically general and morphologically unrestricted, Polish emerges as the only uncontested case of the widely challenged and typologically rare bidirectional system (Gordon Reference Gordon2002). However, the alleged presence of alternating secondary stresses has never been confirmed in an acoustic study.
This paper reports on a detailed acoustic study of syllable prominence in Polish simple words and compounds. Using word-list data collected from ten native speakers of Polish, the acoustic prominence of various syllable positions was assessed. Specifically, syllables were labelled according to the stress levels found in traditional descriptions, and were compared to each other in terms of parameters previously shown to correlate with stress in Polish and other languages (Fry Reference Fry1955): maximum pitch, pitch change, pitch slope, maximum intensity, vowel duration and onset duration.
The results suggest that Polish lacks the alternating stresses posited in the phonological literature. Indeed, simple words appear to exhibit only one stress. This single stress coincides with what has traditionally been conceived of as primary stress, i.e. it falls on the penultimate syllable, and is acoustically robust, correlating with higher values for all measures investigated. By contrast, initial and odd-numbered syllables, reported to carry secondary and tertiary stresses respectively, show little evidence of increased prominence. Although initial syllables have higher values of maximum pitch, maximum intensity and onset length, these appear to be boundary-related effects. This interpretation is supported by the data from compounds, where a robust secondary stress is identified on the penultimate syllable of the leftmost stem, correlating with all measures except pitch change. The presence of secondary stress in compounds is determined by their prosodic structure: secondary stress only surfaces if the foot carrying it does not clash with the foot bearing primary stress.
The data presented in this paper challenge the classification of Polish as a bidirectional stress system with internal lapses. Based on acoustic data, I call into question the elaborate pattern of stresses posited for Polish simple words. I argue, however, that the distribution of clashes and lapses does shape the prosodic structure of compounds. I formalise the analysis of stress in compounds in Optimality Theory, arguing for an undominated ranking of *FtFt in Polish. In particular, each compound stem is parsed into a separate prosodic word as long as stressing both stems does not create adjacent feet. Otherwise, the compound constitutes a single prosodic word.
The paper is organised as follows. §2 outlines the generally accepted account of stress assignment in Polish simple words and compounds, and summarises the findings from previous acoustic studies of stress in Polish. In §3, I formulate predictions and hypotheses based on the claims made in the theoretical literature on Polish stress. §4 describes the methodology used in the production experiment. §5 presents and discusses the results for simple words, and §6 for compounds. An analysis of the stress pattern in Polish compounds, couched in Optimality Theory, follows in §7. §8 discusses the theoretical implications of the acoustic analysis and §9 concludes.
2 Previous studies
2.1 Location of stress in Polish
In this section, I summarise previous analyses of Polish stress, which have characterised it as a bidirectional system with internal lapses. The specific theoretical claims made in these studies will lay the groundwork for the production study presented in later sections.
2.1.1 Simple words
Polish primary stress is highly predictable, as it almost always falls on the penultimate syllable, irrespective of word length or morphological category (Rubach & Booij Reference Rubach and Booij1985). Penultimate stress is even preserved under suffixation (see (1); foot boundaries are denoted by parentheses). Although a few lexical exceptions with antepenultimate stress exist, they constitute prescriptive pronunciations.Footnote 1 Speakers use penultimate stress in normal conversational speech (Gussmann Reference Gussmann2007).
(1)


Secondary stresses, assigned left-to-right, arguably fall on every odd-numbered syllable in words of at least four syllables in length (Dłuska Reference Dłuska1957, Halle & Vergnaud Reference Halle and Vergnaud1984, Rubach & Booij Reference Rubach and Booij1985).Footnote 2 A lapse arises in odd-parity words, e.g. /ˌrεpɔrtεˈrɔvi/, often attributed to clash avoidance (Rubach & Booij Reference Rubach and Booij1985, Kraska-Szlenk Reference Kraska-Szlenk2003).
A further distinction is typically made between secondary and tertiary stress. On this analysis, the initial syllable is associated with secondary stress, while all other odd-numbered syllables carry tertiary stresses (Dłuska Reference Dłuska1957). This finer distinction of stress levels is motivated by impressionistic descriptions of the rhythmic stresses as being somehow weaker than the initial stress. Although theories of metrical stress (e.g. Rubach & Booij Reference Rubach and Booij1985, McCarthy & Prince Reference McCarthy and Prince1993, Hayes Reference Hayes1995) standardly disregard this distinction, they make very explicit predictions as to the occurrence of rhythmic stresses. For example, both Dłuska (Reference Dłuska1957) and Rubach & Booij (Reference Rubach and Booij1985) claim that secondary and tertiary stresses disappear in fast speech, with tertiary stresses being dropped before secondary stresses. Thus all stresses are expected to be realised in the most careful speech style, but only primary stress is predicted to remain in rapid speech.
The characterisation of the Polish stress system as having at least two levels of stress, assigned from opposite word edges, has been used as crucial evidence for distinguishing between theories of bidirectional foot parsing (McCarthy & Prince Reference McCarthy and Prince1993, Kager Reference Kager2001, McCarthy Reference McCarthy2003, Hyde Reference Hyde2008). Among the few languages believed to represent bidirectional systems which allow internal lapses, Polish is the best-documented. Such systems will create lapses in odd-parity words, but, crucially, the lapse will always arise adjacent to the main stress, arguably due to clash avoidance. Hence, heptasyllabic words are predicted to be parsed in one of two ways, depending on the location of primary stress. If the foot carrying primary stress is fixed on the right edge, we get the parse in (2a), observed in languages like Polish (Rubach & Booij Reference Rubach and Booij1985, Kraska-Szlenk Reference Kraska-Szlenk2003), Piro (Matteson Reference Matteson1965) and Lenakel (Lynch Reference Lynch1978). The mirror image of this parse, (2b), arises if primary stress is fixed on the initial syllable, as in Garawa (Furby Reference Furby1974).
(2)
Conversely, lapses are not expected to arise between two secondary stresses, rendering the parses in (3) unpredicted by the theory. Indeed, the only languages where (3a) has been argued to arise are Indonesian (Cohn Reference Cohn1989) and Spanish (Harris Reference Harris1983). As these productions seem to be restricted to Dutch borrowings in Indonesian and clitic forms in Spanish, (3a) has been argued to be a derived stress pattern, rather than a basic one (Kager Reference Kager2001).
(3)
Although the patterns in (2) have been reported, they are typologically relatively rare (Gordon Reference Gordon2002). The accuracy of the descriptions of some of these languages, like the already extinct Garawa and Piro (Lewis Reference Lewis2009), has also not been confirmed, as each of these cases is based on one descriptive source. In addition, for some languages, the pattern in (2) can be argued to arise through morphological processes, and represent phrase-level, not word-level stress. For example, Alber (Reference Alber2005) notes that the few heptasyllabic words provided for Garawa in Furby (Reference Furby1974) all appear to be morphologically complex. Similarly, all Piro words reported to exhibit secondary stress (Matteson Reference Matteson1965) most likely represent cases of morphological fusion, as suggested by the author himself. For example, one of the words Matteson provides is /ˌrumkaˌhetkoˌhimtaˌpanatˈkana/ ‘It is said that they were perhaps unfortunately asleep as they were going along’. Although Matteson classifies productions like this as a single ‘stress group’, coinciding with the phonological word, it seems possible that they are instead phonological phrases. Finally, the stress patterns in (2) are often lexically restricted. In Lenakel, (2a) can only be observed in verbs and adjectives (Hayes Reference Hayes1995).
It appears, therefore, that Polish is the only language for which the presence of the stress pattern in (2) has not yet been disputed. In particular, the parse in (2a) is believed to be morphologically and lexically general, as it is claimed to apply to simple, as well as derived words, and all grammatical categories. Since Polish remains the only uncontested case of bidirectional systems with internal lapses, it is vital that the accuracy of the traditional descriptions of Polish stress be verified acoustically. In fact, the acoustic data presented in this paper seem to indicate that the Polish stress system is not bidirectional, with simple words exhibiting a single stress.
2.1.2 Compounds
In traditional descriptions, Polish compounds are believed to depart from the bidirectional stress pattern reported for simple words, arguably due to their recursive prosodic structure (Rubach & Booij Reference Rubach and Booij1985, Greenberg Reference Greenberg1986, Kraska-Szlenk Reference Kraska-Szlenk2003).Footnote 3 In this section, I review previous analyses of compounds, contrasting their stress pattern with that of simple words. I will later present acoustic data that show that compounds are indeed different from simple words. Specifically, unlike simple words, compounds manifest secondary stress, which makes them similar to their Russian counterparts (Gouskova & Roon Reference Gouskova, Roon, Babyonyshev, Kavitskaya and Reich2009, Gouskova Reference Gouskova2010). I will demonstrate that the presence of two penultimate stresses (one primary, one secondary) depends on the prosodic structure of compounds, and is governed by clash avoidance.
Polish compounds have long been argued not to be uniform in terms of stress. First, compounds that are two or three syllables long are reported to carry only one stress, thus mirroring the stress pattern of simple words of the same length (compare (4a) with (4b)). Note that, in a subset of compounds, a theme vowel, [-i-] or [-o-], is present at the stem juncture.
(4)
Second, in compounds longer than three syllables, each stem is believed to mirror the stress pattern of simple words of the same length. Hence both stems are believed to manifest penultimate stresses, distinguished by a difference in prominence: the stress on the head (rightmost) stem is considered primary, and the stress on the leftmost stem secondary. This distinction is in line with the impression of Polish speakers that the leftmost stress is weaker (Rubach & Booij Reference Rubach and Booij1985, Kraska-Szlenk Reference Kraska-Szlenk2003). It is also consistent with the stress pattern proposed for simple words (compare (5a) with (5b)).
(5)
The stress pattern of compounds begins to depart from that of simple words when stems are at least trisyllabic. Since each stem reflects the stress pattern of a separate word, two penultimate stresses are reported to arise (Rubach & Booij Reference Rubach and Booij1985), as in (6a). If compounds and simple words patterned alike, we would observe the presence of secondary stress on the initial syllable, followed by tertiary stresses on odd-numbered syllables, as in (6b).
(6)
Since prominence on the non-head penultimate syllable represents secondary stress, tertiary stress in compounds has been associated with the same syllables that are expected to carry secondary stress in simple words, i.e. initials. Hence, tertiary stress is reportedly observed in stems that are at least quadrisyllabic (see (7), adapted from Rubach & Booij Reference Rubach and Booij1985, where tertiary stresses are underlined).
(7)
The presence of two penultimate stresses in examples like (6a) and (7) has been taken as evidence that Polish compounds manifest a recursive prosodic structure. In particular, Rubach & Booij (Reference Rubach and Booij1985) analyse compounds as two separate mots embedded in another mot, while Kraska-Szlenk (Reference Kraska-Szlenk2003) argues that they constitute two PWds contained within a morphological word (MWd). On the other hand, compounds with a single stress, as in (4a), suggest that there may not be a PWd boundary between compound stems, and in that case stress assignment should proceed just as it would in simple words. A similar claim has been postulated for Russian. Specifically, using evidence from vowel reduction, Gouskova (Reference Gouskova2010) argues that Russian compounds are single prosodic words. Even though Russian stress phonology is very different from that of Polish, I will later demonstrate that the phonology of compounds in the two languages turns out to be similar, as is the phonology of secondary stress. Indeed, compounds appear to be the only types of words in Polish which allow two stresses. I will argue that the location of these stresses is governed by clash avoidance.
2.2 Acoustic manifestation of stress in Polish
Although Polish stress has been studied extensively from the theoretical perspective, not much work has been devoted to its acoustics. This section outlines previous work on the perception and production of Polish stress, and underscores the general lack of evidence for lower levels of stress. In this review, I identify the acoustic correlates of stress that will be considered in the production study.
Polish primary stress has been shown to be perceptually very robust. Peperkamp & Dupoux (Reference Peperkamp, Dupoux, Gussenhoven and Warner2002) found that Polish speakers were unique in their ability to accurately identify the placement of primary stress, despite its non-contrastive nature. In the experiment, three stress cues (pitch, duration and intensity) were manipulated simultaneously, which implies that at least one of them correlates with stress in Polish. In fact, all three parameters were identified as stress cues in independent perception studies. Pitch fluctuations were argued to be the central stress cue for Polish listeners in synthesised (Jassem et al. Reference Jassem, Morton, Steffen-Batog and Jassem1968) and natural speech (Awedyk Reference Awedyk1986). In addition, Jassem et al. (Reference Jassem, Morton, Steffen-Batog and Jassem1968) found increased intensity to be an effective cue, but only if the change was 6 db in magnitude or more. Lengthened vowels were also perceived as stressed, even if their duration was increased by as little as 20%.
Production studies have confirmed that these particular acoustic parameters are manipulated to signal stress. Both Jassem (Reference Jassem1962) and Dogil & Williams (Reference Dogil and Williams1999) pointed to fluctuations in pitch as a correlate of primary stress, while Jassem (Reference Jassem1962) also identified duration as having ‘an accessory role’. A more recent study, Łukaszewicz & Rozborski (Reference Łukaszewicz and Rozborski2008), argued that maximum intensity was the most reliable correlate. This finding is consistent with early impressionistic descriptions of stress, which often mentioned a slight rise in loudness on the penultimate syllable (Benni Reference Benni1914, Dłuska Reference Dłuska1950).
Unlike primary stress, lower levels of stress are not perceptually salient. Indeed, native Polish listeners have been found to be remarkably inconsistent in their identification and localisation of secondary stress (Steffen-Batogowa Reference Steffen-Batogowa2000). Steffen-Batogowa (Reference Steffen-Batogowa2000: 104) concludes that Polish secondary stress is perceptually very weak, and ascribes it to its non-contrastive nature. This hypothesis does not, however, account for why primary stress should be so perceptually salient, as it is also non-contrastive.
The difficulty in detecting secondary stress is matched by mixed results from the few production studies that exist. Dogil & Williams (Reference Dogil and Williams1999) failed to find conclusive evidence for the presence of secondary stress. They did, however, suggest that secondary stress on the initial syllable may be marked by a longer and more fully articulated vowel (1999: 286). This suggestion is in line with Dłuska (Reference Dłuska1974) 's impressionistic claim that Polish syllables form an alternating pattern of long and short vowels, mirroring the pattern of rhythmic stresses. In an older study, Dłuska (Reference Dłuska1932) argued that secondary stress correlated with a longer onset consonant. No statistical analysis was provided, however.
To sum up, while Polish primary stress is perceptually and acoustically robust, quite the opposite is true of lower levels of stress. The elusive nature of the latter is troubling, given the amount of attention the Polish stress system has received in the phonological literature. Below, I argue that the acoustic elusiveness of Polish secondary stress is in no sense an isolated phenomenon. Indeed, in a number of unrelated languages, rhythmic stresses posited on the basis of impressionistic evidence have not been confirmed acoustically.
2.3 Acoustic work on secondary stress in other languages
This section summarises previous work on the acoustics of secondary stress. A synthesis of findings from languages other than Polish will justify the design of the present study. In addition, a discussion of a sample of studies which failed to identify correlates of secondary stress will foreground the elusive character of lower degrees of stress.
Acoustic studies of stress have rarely investigated the phonetic manifestation of lower degree stresses, focusing instead on the opposition between primary stress and unstressed syllables. Moreover, among the studies that did analyse secondary stress, only a handful were successful at identifying its acoustic correlates. Although these studies have shown that secondary stress can be cued by a range of parameters, languages commonly seem to employ a fixed set of acoustic cues to signal all levels of stress. The differentiation of stress levels then comes from the strengthening of a particular cue. For example, Gordon (Reference Gordon2004) demonstrated that Chickasaw vowels with secondary stress displayed F0, duration and intensity values that were intermediate between those of primary stress and unstressed vowels. Similarly, in Estonian, the same acoustic cues were independently found to correlate with primary and secondary stress syllables: F0 contours and onset length (Lehiste Reference Lehiste1966, Eek Reference Eek1982, Gordon Reference Gordon1995, Reference Gordon, Lehiste and Ross1997). Estonian stress levels are differentiated by the former characteristic, i.e. syllables with primary stress exhibit F0 rises, while syllables with secondary stress manifest an interruption in the F0 decline (Eek Reference Eek1982, Gordon Reference Gordon1995). Cue trading has also been observed in English compounds appearing in various prosodic contexts (Morrill Adams Reference Morrill Adams, Trouvain and Barry2007).
Another strategy that languages frequently employ in marking lower levels of stress is to use a subset of the correlates associated with primary stress. The presence of a pitch accent on the strongest stress often accounts for this distinction. For example, it has been argued that English primary and secondary stress syllables are identical to each other on such measures as F0, intensity and spectral balance, unless the word is pitch-accented (Plag et al. Reference Plag, Kunter and Schramm2011), in which case the primary stress syllable exhibits a larger pitch slope. Other parameters have also been suggested as differentiating between stress levels in English. Fear et al. (Reference Fear, Cutler and Butterfield1995) found primary and secondary stress syllables to pattern uniformly in terms of intensity, pitch and spectral characteristics, but to differ in terms of vowel duration. Mattys (Reference Mattys2000) characterised syllables with primary stress as manifesting an increase in pitch and duration, but not in intensity, as compared to syllables with secondary stress. Although the results of these studies do not completely converge, they all suggest that secondary stress in English is realised by a subset of correlates systematically associated with primary stress. Similar claims have been put forth for other languages. In a study of two speakers of Indonesian, Adisasmito-Smith & Cohn (Reference Adisasmito-Smith and Cohn1996) argued that they manifested secondary stress differently, one with a rise in amplitude, and the other by lengthening of the vowel. Both of these correlates, together with F0, were also found to be present on syllables carrying primary stress.
The acoustic nature of secondary stress has also been investigated in compounds. For Dutch, van Heuven (Reference Heuven1987) showed that while intensity, duration and pitch values distinguish primary from secondary stress in disyllabic words, the two levels of stress seem to exhibit equal prominences in compounds, but only when unaccented. Similarly, Morrill Adams (Reference Morrill Adams, Trouvain and Barry2007) demonstrated that systematic differences occurred between phrasal and compound stress in English, across intonational environments. In particular, intensity stood out as a reliable cue to compound stress in all environments, except for questions. In the latter context, as well as in the continuation-rise pattern, duration emerged as the most reliable cue. Thus, although compounds can also exhibit levels of stress, the stress correlates they employ do not necessarily need to align with those of simple words.
The existence of studies which were successful at identifying correlates of secondary stress should not overshadow the large body of work which has grappled with the issue of the acoustic elusiveness of secondary stress. Secondary stress has been particularly hard to describe phonetically in languages which do not exhibit concomitant phonological phenomena, such as vowel reduction or aspiration of consonants, present for example in English. In addition, issues in identifying correlates of secondary stress are also more common in languages for which a rhythmic pattern of stresses has been proposed. Examples likes these include Hungarian (Blaho & Szeredi Reference Blaho and Szeredi2011), Brazilian Portuguese (Arantes & Barbosa Reference Arantes and Barbosa2008) and Spanish (Prieto & van Santen Reference Prieto, van Santen, Parodi, Quicoli, Saltarelli and Zubizarreta1996, Díaz-Campos Reference Díaz-Campos, Campos, Herburger, Morales-Front and Walsh2000).Footnote 4 Although none of these studies investigated an exhaustive range of possible stress parameters, the production results parallel the reported scepticism on the part of native speakers towards the perception of secondary stress. In addition, studies which did reveal a rhythmic pattern of stresses in ‘binary plus clash’ systems (Gordon Reference Gordon2002), were able to demonstrate acoustic differences in stress levels based on such fundamental correlates of stress as vowel duration, intensity and pitch (Gordon & Rose Reference Gordon and Rose2006 for Émérillon; Hintz Reference Hintz2006 for South Conchucos Quechua).
The review of previous acoustic work on secondary stress justifies the selection of acoustic parameters in the present study. Since previous studies have shown that correlates of secondary stress are largely derivative of those signalling primary stress, the acoustic analysis presented here will focus on parameters known to be affected by stress in Polish (i.e. vowel duration, maximum pitch, pitch change and maximum intensity). The same set of parameters is analysed in compounds, as these could express secondary stress through different parameters than simple words. Simple words are additionally analysed with respect to onset duration and pitch slope.
3 Predictions and hypotheses
This paper fills the gaps in the phonetic description of Polish stress, with a special focus on lower levels of stress, as their acoustic make-up is the most doubtful. The analysis has two main goals. The first is to identity acoustic correlates of stress in Polish in a controlled manner. The second is to test predictions made by traditional descriptions of Polish stress. To achieve both goals, the acoustic prominence of syllables in different positions within simple words and compounds will be compared.
3.1 Predictions for simple words
3.1.1 Predictions for the penultimate syllable
Based on descriptions from the phonological literature, according to which the penultimate syllable bears primary stress, I expect this syllable to be systematically more prominent than any other syllable in a word. As far as the physical nature of this prominence is concerned, I expect the penult to show (i) the largest pitch excursions (Jassem Reference Jassem1962), (ii) the largest maximum pitch (Dogil & Williams Reference Dogil and Williams1999), (iii) longer vowel duration (Jassem Reference Jassem1962) and/or (iv) greater vowel intensity (Łukaszewicz & Rozborski Reference Łukaszewicz and Rozborski2008). These parameters may mark stress singly, or jointly.
3.1.2 Predictions for odd-numbered syllables
Increased prominence is also expected on odd-numbered syllables, counting from the left edge. Specifically, in words of at least four syllables in length, the initial syllable, described as bearing secondary stress, is predicted to be more prominent than the adjacent unstressed syllable. For example, in /dεlεgɔvaw/ ‘delegate (3sgpast)’ and /dεlεgɔvanɨ/ ‘delegate (pastpart)’, the vowel in /dε-/ is expected to be more prominent than that in /-lε-/. In words of at least six syllables, a higher prominence is expected on all odd-numbered syllables. That is, in /dεlεgɔvanεmu/ ‘delegate (pastpartdat)’, in addition to /dε-/ being more prominent than /-lε-/ due to secondary stress, /-gɔ-/ is expected to be more prominent than the adjacent /-lε-/ and /-va-/, because of tertiary stress. These predictions do not apply to odd-numbered syllables that are penultimate (primary stress) or word-final (unstressed).
Although the possible acoustic manifestations of lower levels of stress vary across languages, there are two obvious possibilities for Polish. First, lower levels of stress may be expressed by the same acoustic correlates as primary stress or by a subset of them. In this case, initial and odd-numbered syllables would be expected to manifest an increase on at least some of the acoustic measures correlating with the penultimate syllable. Second, a different set of correlates could be employed for different stress levels. As the latter is rare, if not unattested, all syllables will be compared on the same acoustic measures.
3.1.3 Predictions for even-numbered and pre-tonic syllables
Even-numbered and pre-tonic syllables, described as unstressed in all previous research, are not expected to demonstrate significantly higher values on any of the correlates investigated here. For example, /-lε-/ in /dεlεgɔvaw/ and both /-lε-/ and /-va-/ in /dεlεgɔvanεmu/ are expected to be less prominent than adjacent syllables. By the same token, the pre-tonic /-gɔ-/ in /dεlεgɔvanɨ/ is not expected to correlate with stress parameters per se, but it may show slightly increased values as it immediately precedes the penultimate syllable.
The predictions for even-numbered syllables again exclude the penultimate (primary stress) and the final syllables. The final syllable is treated separately from the other unstressed syllables because this position has been shown cross-linguistically to undergo the effects of domain-final lengthening (for English, see Lehiste Reference Lehiste1973, Oller Reference Oller1973, Klatt Reference Klatt1975, Cooper & Paccia-Cooper Reference Cooper and Paccia-Cooper1980, Wightman et al. Reference Wightman, Shattuck-Hufnagel, Ostendorf and Price1992; for Tamil, see Byrd et al. Reference Byrd, Kaun, Narayanan, Saltzman, Broe and Pierrehumbert2000).
3.2 Predictions for compounds
As all compounds featured in the word list are at least quadrisyllabic, I expect each stem to mirror the stress pattern of single-root words of the same length (see §2.1.2). Specifically, I expect both stems to exhibit robust penultimate stresses. In addition, I predict that the two stresses will differ in their degree of acoustic robustness, with the primary stress on the head of the compound (rightmost stem) being stronger than the secondary stress on the non-head penultimate syllable. In addition, tertiary stress is expected on the initial syllable of all stems with at least four syllables. As in the case of simple words, I will test whether the presence of degrees of stress is reflected in the measures of the acoustic correlates available for primary stress.
3.3 Hypothesis: Polish manifests degrees of stress
Analysing different syllable positions separately will allow me to assess the accuracy of the descriptions of Polish stress presented in the literature. Specifically, I will attempt to verify the representation of Polish stress as a bidirectional system with internal lapses (Rubach & Booij Reference Rubach and Booij1985, Kraska-Szlenk Reference Kraska-Szlenk2003). For this claim to be supported, the hypothesis that Polish manifests degrees of stress needs to be confirmed.
For Polish simple words to have four degrees of stress, the prominence hierarchy in (8a) should hold. In terms of the syllable distinctions I have assumed, this hierarchy of stress levels translates into the syllable positions ranked in (8b). The crucial distinction, however, is between unstressed syllables and all others, as it is possible for primary, secondary and tertiary stresses to be realised in a similar manner. A similar hierarchy for compounds is provided in (8c).
(8)
To be able to test this hypothesis, I conducted a production study with native speakers of Polish, aimed at eliciting lower levels of stress. The following section lays out the methodology of the experiment.
4 Methodology
4.1 Speakers
Ten native speakers of Polish (six women and four men) were recruited to record the word list. With the exception of one speaker, who was 58, the age range was 27–31. All but two of the speakers were natives of Bytów, a town in northern Poland, located near Gdańsk. The other two speakers were lifelong residents of Poznań (central Poland). The speaker sample represents a range of education levels: two speakers had high-school degrees, three were enrolled in college and five held Master's degrees. All of the speakers spoke Standard Polish, which is usually associated with urban areas like Warsaw and Poznań.
Like most Poles, these speakers had some familiarity with foreign languages, and two of them had advanced proficiency in English. None of the speakers reported any speech or hearing impediments.
4.2 Stimuli
The word list contained 138 words, split between simple words (100) and compounds (38).Footnote 5 Throughout the paper, compounds are distinguished from simple words by the presence of a hyphen between stems.
Simple words were nouns, verbs and adjectives, and ranged in length from four to six syllables. All of them were expected to carry primary and secondary stress, but only six-syllable words were expected to carry tertiary stress. Compounds included nouns and adjectives, and varied in length from four to nine syllables. As with simple words, all compounds were expected to show primary and secondary stress. Tertiary stress, however, was only expected to appear on stems that had at least four syllables. This was the case with some of the six-syllable compounds, and all longer ones.
The word list was constructed in such a way to contain largely CV syllables, the concern being that a following coda could affect vowel duration. In terms of the consonants used, voiceless consonants were avoided, because they tend to cause breaks in pitch tracking. The glides /j w/ were also dispreferred, as they make segmentation difficult. Six vowel phonemes were used: /i ɨ ε a ɔ u/. Care was taken to ensure that all syllable positions in a word (i.e. initial, penultimate, etc.) were represented by at least ten tokens of each vowel.
4.3 Experimental procedure
All recordings were done in Poland, using a Marantz PMD-660 solid state digital recorder, set at a sampling rate of 44·1 kHz. The speakers were recorded individually, reading the word list three times from a computer screen. During the recordings, the speakers wore an Audio-Technica ATM 75 headset, which ensured that the microphone remained at the same distance from the mouth. The word lists were randomised for all speakers and all lists, and were displayed using presentation software (Ibex). All tokens were presented individually, in the middle of the screen, embedded in a carrier phrase: Mówię_ponownie ‘I say_again’. The speakers were told to read the sentence in careful speech, and in case of a mispronunciation, to repeat the whole sentence before moving on to the next one. Reading was completely self-paced, in that the speakers determined when the next word would appear on the screen by hitting the ‘1’ key on the keyboard. They were allowed to take as many breaks as they desired.
4.4 Acoustic measurements
The recordings were analysed using Praat (Boersma & Weenink Reference Boersma and Weenink2010). First, a script was used to extract each word in its frame, creating a WAV file and an associated text grid. Using these text grids, vowels were segmented in all words, and all three trials. This was done manually by the author and two undergraduate research assistants. To ensure that the segmentations were consistent, strict segmentation criteria were followed, based on the inspection of the waveform and the spectrogram. In particular, vowel boundaries were determined on the basis of the presence of periodic glottal pulses, formant structure and, in the case of adjacent voiceless consonants, the voice bar. All segmentations were checked by the author before the analysis was conducted, and any mistakes were corrected.
Next, the pitch, intensity and duration of the extracted vowels were analysed. A total of 202 tokens were excluded from the analysis. This number included the first three and the last three word-list items, which remained the same for all speakers and all trials. 32% of all eliminated tokens came from one of the speakers in the study, who read the word lists at a rate faster than the others. In addition, tokens which had been mispronounced in any way were discarded. Lastly, tokens produced with a pause or hesitation in the middle of the word were removed, as they often resulted in the lengthening of one of the syllables. Excluding the discarded tokens, the total number of vowels analysed was 18,606 (12,289 for simple words and 6,317 for compounds).
A subset of the vowels from simple words were analysed with respect to onset duration. For this purpose, the voiced stop [b] was extracted from all syllables where it constituted a single onset followed by the vowel [a], and preceded by any vowel. The data set contained 18 words that met these criteria. The duration of the stop was measured in all of these words, for all speakers and in all three list readings (481 tokens in total). Closure and burst were included in the overall consonant duration: the stop duration was measured from the end of the periodic waveform of the preceding vowel to the onset of periodicity signalling the beginning of [a]. A total of 61 tokens of word-initial [b] were excluded from the analysis. There were two exclusion criteria. First, some speakers had variable production of the final vowel in the carrier word preceding the stop (/muvjε/ ‘I say’). The final vowel is underlyingly nasal, but typically undergoes denasalisation in final position. Some speakers, however, were hypercorrecting, and sometimes pronounced the vowel as nasal. Since the second part of nasal vowels in Polish is a glide, these productions posed a challenge to segmentation, and were thus excluded. Second, tokens were discarded if speakers paused before the focus word or put contrastive stress on any of the syllables.
In the analysis of pitch I used a Praat script which measured the point of highest and lowest F0 within a vowel (maximum and minimum pitch), along with the time-stamps of these measurements. The script used the ‘get maximum pitch’ function in Praat, but it started measuring pitch 10 ms into the vowel, and stopped 15 ms before the end of the vowel, to avoid undefined pitch tracking. Vowel tokens with undefined values, or with values that diverged from the norm, were re-measured manually. The original values were taken in linear Hertz, and were later converted to semitones using the formula 12×log2Hz. The semitone scale is used to standardise the pitch range of multiple speakers, as it is argued to be a better approximation of the perception of speech spans (Nolan Reference Nolan, Solé, Recasens and Romero2003). Using semitones, pitch change was calculated for all vowels by subtracting minimum pitch from maximum pitch. Pitch slope was measured by further dividing this number by the time interval (in seconds) between these points of measurement (time of maximum pitch–time of minimum pitch). The direction of pitch excursions was established on the basis of whether the time difference between maximum and minimum pitch was positive or negative. A positive number indicated a pitch rise, while a negative number indicated a pitch fall. Inspection of the spectrograms did not reveal bitonal pitch patterns, consistent with Jassem's (Reference Jassem1959) word-list data, which were also unitonal.
Vowel intensity, vowel duration and onset duration were collected using Praat scripts, and were again based on the interval boundaries determined manually by the author and two research assistants. Intensity, measured in dB, was only recorded at its peak, under the assumption that a stressed syllable would have a higher maximum intensity value than an unstressed syllable. Vowel duration and onset duration, measured in milliseconds, were extracted using the same script.
4.5 Statistical analysis
The effect of syllable position on potential stress parameters was tested in a series of mixed effects regression models fitted in R (R Development Core Team 2011) using the lmer() function of the lme4 package (Bates & Maechler Reference Bates and Maechler2009). Separate models were fitted for each parameter investigated, i.e. vowel duration (in milliseconds), onset duration (in milliseconds), maximum pitch (in semitones), pitch change (in semitones), pitch slope (in semitones/second) and maximum intensity (in dB), with Syllable Position, Vowel Height and Gender as fixed effects. The inclusion of Vowel Height as a fixed effect was motivated by the existence of vowel-intrinsic differences, such as duration, pitch and intensity (Fairbanks et al. Reference Fairbanks, House and Stevens1950, House & Fairbanks Reference House and Fairbanks1953, Peterson & Lehiste Reference Peterson and Lehiste1960, Whalen & Levitt Reference Whalen and Levitt1995). Due to an unbalanced design, vowels /ε/ and /u/ were missing from odd-numbered syllables, which required the vowels to be grouped in order to test the interaction with Syllable Position. This grouping was done on the basis of vowel height: high (/i ɨ u/), mid (/ε ɔ/) and low (/a/). Vowels belonging to each category patterned very closely in terms of duration and intensity, which will be discussed further in the respective sections. The inclusion of Gender as another fixed effect was motivated by the expectation of a bimodal distribution of pitch ranges for maximum pitch. Finally, the models include two random effects, Speaker and Item. This allowed me to control for between-speaker differences, such as speech rate and pitch, as well as between-item differences resulting from different word length, such as vowel duration.
The models reported here constitute the best fit arrived at through a step-wise evaluation process whereby non-significant factors were discarded (Baayen Reference Baayen2008). Specifically, for each mixed-effect model, the inclusion of more than one fixed effect and random intercept was determined by an ANOVA model comparison, based on likelihood ratio tests. None of the fully crossed models converged. Whenever possible, the p-values reported in this paper were obtained through the Markov chain Monte Carlo method (MCMC), using the pvals.fnc() function of the languageR package. Otherwise, significance was determined on the basis of t-scores. Lastly, post hoc Tukey tests (the glht function in the multcomp package) were conducted, to determine which syllable positions were significantly different from each other. This method was chosen over the Tukey HSD function because it reports Bonferroni adjusted p-values.
5 Results for simple words
In this section I present the results from mixed effects regression modelling for simple words. In all cases, Syllable Position and Vowel Height were employed as interacting predictors, with Gender as a fixed effect not tested for interactions. While an acoustic parameter could conceivably affect different vowels to different degrees depending on syllable position, no such interaction is expected for gender.
5.1 Coding
Six syllable positions were distinguished in the analysis of simple words, corresponding to the following degrees of stress: initial (secondary stress), odd-numbered (tertiary stress), even-numbered (unstressed), pre-tonic (unstressed), penultimate (primary stress) and final (unstressed). The final syllable was treated separately from other unstressed syllables because syllables in domain-final position have been shown to exhibit boundary-related lengthening (for English, Lehiste Reference Lehiste1973, Oller Reference Oller1973, Klatt Reference Klatt1975, Cooper & Paccia-Cooper Reference Cooper and Paccia-Cooper1980, Wightman et al. Reference Wightman, Shattuck-Hufnagel, Ostendorf and Price1992; for Tamil, Byrd et al. Reference Byrd, Kaun, Narayanan, Saltzman, Broe and Pierrehumbert2000). Since the initial, pre-tonic, penultimate and final syllables were given separate labels, they were never included in the odd- or even-numbered categories. This allowed for no overlap between the stress positions. (9) illustrates the way six-syllable words were coded.
(9)
5.2 Duration
5.2.1 Vowel duration
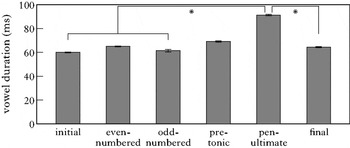
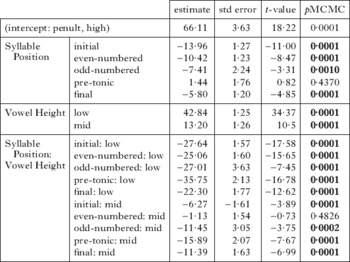
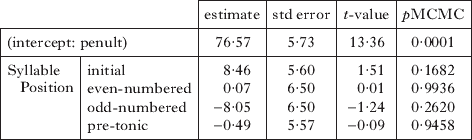
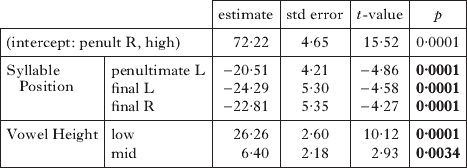
The mixed-effects model for vowel duration revealed significant effects of Syllable Position, Vowel Height and the interaction of Syllable Position and Vowel Height, with no effect of Gender (Fig. 1 and Table I). As in the case of all models presented in this section, the pattern is first illustrated in the form of a graph, followed by a table summarising the regression results and a discussion of the effects observed. In all regression tables in this section, the p-value is given in bold if significant below the 0·05 level. The intercept represents the baseline to which the remaining levels of a factor are compared. For Syllable Position, the penult was selected as the baseline, as it was expected to be markedly different from other syllables, being the locus of primary stress. In cases where a significant effect of Vowel Height is obtained, the baseline represents the average value of high vowels in the penultimate position. If Gender is also significant, the baseline stands for the mean for high vowels in the penultimate position and in female speech. The estimates for the remaining levels of each variable indicate the amount by which the mean is predicted to increase (if the number is positive) or decrease (if it is negative) for that particular level, as compared to the estimate for the intercept. Thus, in Table I, the estimate for the intercept provides the mean vowel duration for high vowels in penultimate syllables. Negative estimates for most of the remaining levels of Syllable Position indicate that the penult is longer than most syllables. The regression table also provides the standard error and t-values for each factor level, and two-tailed MCMC probabilities p.
Mean vowel duration (in ms) according to syllable position.

Fixed-effect coefficients in a mixed-effects model fitted to vowel duration in simple words.

The fact that an effect of Syllable Position was obtained implies that the length of vowels tends to vary depending on which syllable position they occupy. Regression results in Table I show that high vowels in the penultimate position are much longer than the same vowels in most positions in the word. This observation can be inferred from the negative values of the estimates provided for the remaining levels of Syllable Position, as compared to the baseline. The exception is the pre-tonic syllable, whose estimated mean value is positive (1·44 ms), and thus slightly higher than the penultimate syllable. Tukey post hoc tests confirmed that the effect of Syllable Position was due to a significantly longer vowel on the penultimate syllable as compared to other positions, except for the pre-tonic syllable (for all pairwise comparisons, p<0·05). The initial syllable, traditionally associated with secondary stress, is significantly shorter than all other syllables (all p<0·05). Other significant differences were also observed, i.e. even-numbered syllables were identified as longer than finals (p<0·001) and pre-tonic syllables as longer than all syllables, except for the penult (all p<0·01). These last two effects are likely spurious, and possibly result from the large sample size or unequal n's. Recall that the present data set combines six-syllable words, which include odd-numbered syllables, with four- and five-syllable words, which do not. Hence, odd-numbered syllables are underrepresented. In fact, increased duration on the even-numbered and pre-tonic syllables disappears if only six-syllable words are taken into account. Moreover, although these differences in length are statistically significant, they are not likely to be perceptually distinguishable. Klatt (Reference Klatt1976) reports 25 ms as the just-noticeable difference (JND) in vowel length for English listeners. While this threshold is certainly surpassed by the penultimate syllable, length differences between the other syllables are confined to the much lower range of 0·6–9 ms.
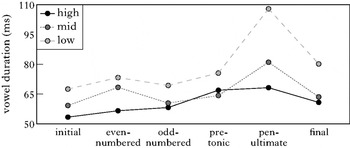
Vowel duration also manifests an effect of Vowel Height. In addition, the interaction of Syllable Position with Vowel Height emerges as significant. The estimates provided in Table I suggest that both mid and low vowels are much longer than penultimate high vowels, and incur an increase of 13 ms and 43 ms respectively. This effect can be ascribed to vowel-inherent differences. In the present data set, a negative correlation between vowel height and length is observed: the higher the vowel, the shorter it is. Hence, the low vowel /a/ is the longest (84·15 ms), followed by mid vowels /ε ɔ/ (68·4 ms) and high vowels /i ɨ u/ (59·14 ms). Tukey pairwise comparisons between these sets of vowels found all these differences to be highly significant (all p<0·0001). These vowel-specific durations also seem to account for the presence of the interaction effect between Vowel Height and Syllable Position. Figure 2 illustrates that durational differences are more pronounced with low and mid vowels as compared to high vowels. This effect may have to do with the fact that high vowels are the shortest, and thus do not have such a vast durational range as the much longer low vowel /a/. Crucially, all vowels replicate the pattern sketched in Fig. 1. Note that the initial syllable is consistently the shortest, which may point to vowel reduction in this position.
Mean vowel duration (in ms) for high, mid and low vowels according to syllable position.

5.2.2 Onset duration
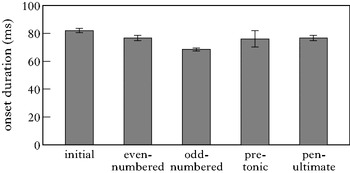
A separate mixed-effects model was built for onset duration, with the fixed effect of Syllable Position and random intercepts of Speaker and Item (Fig. 3 and Table II). Since only the stop onset in [ba] syllables was investigated, the effect of Vowel Height was not examined.
Mean onset duration (in ms) according to syllable position.

The model for onset duration did not find Syllable Position to be a significant predictor. Regression results are summarised in Table II. Recall that the final syllable is not featured, as no instances of [ba] syllables occurred in this position.
Fixed-effect coefficients in a mixed-effects model fitted to onset duration in simple words.
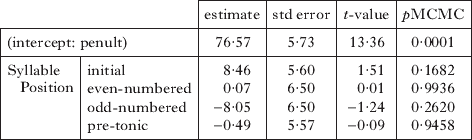
Table III and Fig. 3 illustrate that onset duration generally oscillates around 76·6 ms, which is the average value for the penultimate syllable. Two syllable positions slightly depart from this mean: onsets of initial syllables are on average 8·5 ms longer than those of the baseline, while those of odd-numbered syllables are 8 ms shorter. These differences are not statistically significant, nor are they likely to be perceptually salient. Although sources vary on the JND for the duration of consonants, even the smallest increment proposed, that of 10 ms (Klatt Reference Klatt1976), is greater than the differences observed here.
Mean duration (in ms) of [ba] onsets according to syllable position.

5.3 Maximum intensity
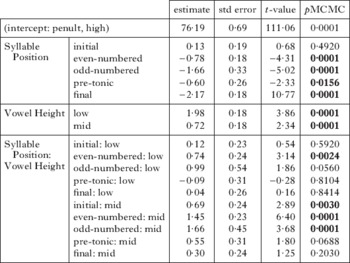
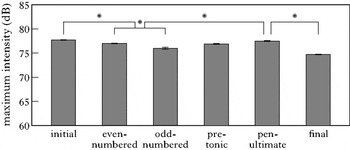
The mixed-effects model for maximum intensity revealed significant effects of Syllable Position, Vowel Height and the interaction of Syllable Position with Vowel Height (Fig. 4 and Table IV). There was no effect of Gender.
Fixed-effect coefficients in a mixed-effects model fitted to maximum intensity in simple words.

Mean maximum intensity (in dB) according to syllable position.

A significant effect of Syllable Position suggests that maximum intensity values vary depending on the position of the syllable within the word. Table IV illustrates that baseline high vowels have a higher maximum intensity (76·19 dB) on the penult than in any other position, except word-initially. The means provided in Table IX below illustrate that the initial and penultimate syllables have the highest maximum intensity values (initial: M=77·7 dB; penultimate: M=77·5 dB), while the final has the lowest (M=74·7 dB). These numbers suggest that intensity generally decreases towards the right edge of the word, only peaking again on the penultimate syllable. Tukey post hoc tests confirmed that the initial and penultimate syllables have significantly higher maximum intensity values than most syllables (all p<0·05), without being significantly different from each other (p=0·98). By contrast, final syllables are significantly lower in intensity than all other positions (all p<0·001), except for odd-numbered syllables (p=0·48). The downward trend in intensity is also visible in the fact that even-numbered syllables have a significantly greater maximum intensity than odd-numbered and final syllables (both p<0·05). Before culminating on the penult, maximum intensity starts rising on the pre-tonic syllable, which manifests higher intensity than the odd-numbered and final syllables (both p<0·05). Figure 4 presents the distribution of maximum intensity across syllable positions.
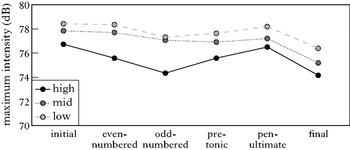
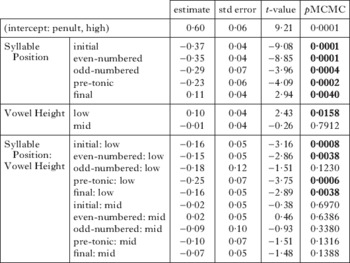
The effect of Vowel Height as well as the significant interaction of Vowel Height and Syllable Position are again attributable to inherent differences in intensity between vowels. Table IV shows that mid and low vowels have higher maximum intensities than the baseline high vowels, by 0·72 dB and 2 dB respectively. A negative correlation thus obtains: the higher the vowel, the lower its inherent intensity. Hence, the low vowel /a/ has the largest maximum intensity (78 dB), mid vowels /ε ɔ/ are in the middle of the range (77·1 dB), while high vowels /i ɨ u/ exhibit the lowest values of all (75·3 dB). Tukey tests established differences between all three vowel categories as statistically significant (all p<0·0001). Since vowels differ in terms of their maximum intensities, their intensity profiles are also expected to differ depending on their position in a word; hence the presence of the interaction effect. In fact, vowels of all heights exhibit the declination effect illustrated in Fig. 4, with a single peak coinciding with the penultimate syllable, but intensity fluctuations are more prominent for high vowels (see Fig. 5). Table IV shows that the interaction effect mostly concerns mid vowels and the first three syllable positions, which happen to exhibit close intensity values.
Mean maximum intensity (in dB) for high, mid and low vowels according to syllable position.

5.4 Maximum pitch (in semitones)
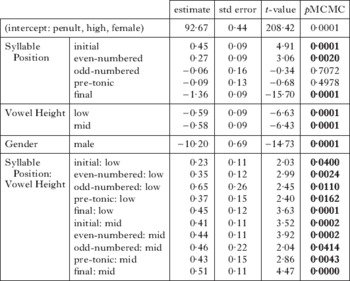
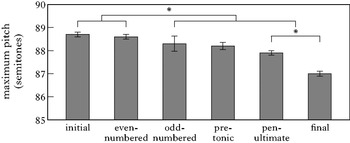
The model for maximum pitch showed significant effects of Syllable Position, Vowel Height and Gender, as well as a significant interaction of Syllable Position with Vowel Height (Fig. 6 and Table V).
Fixed-effect coefficients in a mixed-effects model fitted to maximum pitch in simple words.

Mean maximum pitch (in semitones) according to syllable position.

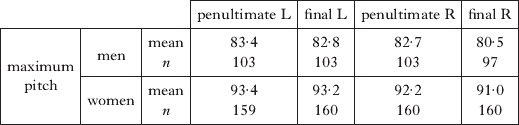
Figure 6 illustrates that values of maximum pitch vary greatly depending on Syllable Position. However, these values can be predicted based on whether a syllable is placed closer to the left or right edge of a word, as a result of a downward trend exhibited by this parameter. In particular, the regression results in Table V show that the estimated coefficients for the first two syllables in a word are positive, implying a higher pitch compared to the baseline penult. Syllables adjacent to the penult, however, have negative coefficients, which suggests that, at least in the case of the baseline high vowels, maximum pitch rises on the penultimate syllable. This general downward trend in maximum pitch is confirmed by Tukey post hoc tests. These pairwise comparisons established that syllables at the left edge of words (initial and even-numbered syllables), when compared to all others, exhibit significantly larger maximum pitch values (all p<0·05). On the other hand, the syllable at the right edge (final) manifests significantly lower maximum pitch (all p<0·001). Although, on average, the initial syllable has slightly higher pitch than even-numbered syllables, this difference is marginal (0·1 semitones), and indeed does not reach significance (p<0·08). Note that, except for the penultimate and final syllables, adjacent syllables are typically not significantly different from each other. This result is expected given that adjacent syllables' mean pitch values are very close to one another (see Table IX below) and do not exceed even the lower bound of the perception threshold reported for pitch, i.e. 1–3 semitones ('t Hart Reference Hart1981). Thus significant comparisons only arise between distant syllables, which seem to differ in pitch as a result of the observable pitch declination.
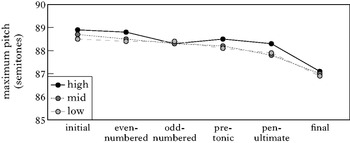
The significant effect of Vowel Height, as well as the significant interaction of Vowel Height with Syllable Position, suggests not only that vowels vary in their maximum pitch, but also that they display different pitch patterns across words. Table V shows that mid and low vowels on average have lower maximum pitch than the baseline high vowels, which is reflected in their negative coefficients. Overall means confirm this observation: high vowels /i ɨ u/ exhibit higher average maximum pitch (88·1 semitones) than mid or low vowels (for both, 88·06 semitones). Tukey pairwise comparisons conducted on the mixed-effects model confirmed that the pitch differences between high and low vowels were significant (p<0·01). The interaction effect can also be attributed to inherent pitch differences between vowels of different height. Figure 7 illustrates that for mid and low vowels, the decline in pitch across a word is gradual, while for high vowels pitch dips slightly on the odd-numbered syllable.
Mean maximum pitch (in semitones) for high, mid and low vowels according to syllable position.

The significant effect of Gender is fully expected, due to differences in male and female pitch ranges. Table V illustrates that maximum pitch is consistently higher in women's speech (baseline estimate), and decreases by 10·2 semitones in men's speech. Both genders, however, manifest a gradual declination of pitch throughout the length of the word, with men showing a slight peak on the penultimate syllable. Means for maximum pitch for each gender and across all syllable positions are listed in Table IX below.
5.5 Pitch change
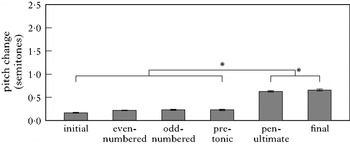
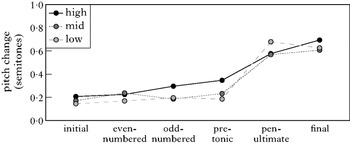
The model for pitch change (Fig. 8 and Table VI) showed a significant effect of Syllable Position, Vowel Height and their interaction. Gender was not significant. This result is expected, given that pitch change represents the size of pitch excursions within a syllable, which is a relative measure, and thus should not be affected by differences in pitch ranges across genders.
Mean pitch change (in semitones) according to syllable position.

Fixed-effect coefficients in a mixed-effects model fitted to pitch change in simple words.

The significant effect of Syllable Position implies that the syllable positions distinguished do not manifest uniform values of pitch change. Regression results in Table VI show that all syllable positions, with the exception of the final, have much lower values of pitch change than the baseline penultimate syllable. Indeed, Fig. 8 and Table VI illustrate that two of the syllables, the penultimate and the final, are characterised by large pitch changes, while the remaining syllables do not exhibit much fluctuation at all. Tukey tests confirmed that the penultimate and final syllables are statistically different from each of the remaining syllables (all p<0·001), as well as from each other (p<0·05). No further comparisons were significant.
The observed effect of Vowel Height and the interaction of Vowel Height with Syllable Position again appear to stem from inherent differences in the range of pitch fluctuations for vowels of different height. Table VI shows that low vowels in penultimate position exhibit a larger pitch change than the baseline high vowels (an increase of 0·1 semitones), while the mean value for mid vowels is almost identical to that of high vowels (a decrease of 0·01 semitones). Overall, high vowels exhibit significantly larger pitch changes (M: 0·44 semitones) than mid (M: 0·36 semitones) and low vowels (M: 0·38 semitones), possibly due to inherently higher maximum pitch. The coefficients provided in Table VI also indicate that the interaction effect only arises when high and low vowels are compared. Indeed, pitch change across syllable positions is consistently lower for low vowels than for high vowels, except for the penultimate position, where a greater pitch change is manifested by low vowels. Crucially, all vowels replicate the dichotomy between the penultimate and final on the one hand and the remaining syllables on the other, but in the case of the low vowel /a/ the penultimate is marked by a larger pitch change than the final (see Fig. 9).
Mean pitch change (in semitones) for high, mid and low vowels according to syllable position.

5.5.1 Direction of pitch excursions
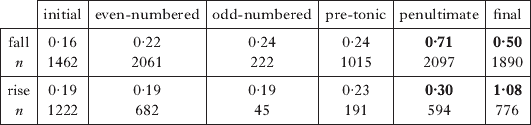
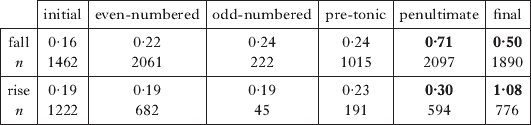
As pitch change was not able to differentiate between the penultimate and final syllables, the direction of pitch excursions was investigated. A visual inspection of pitch contours for a subset of the data revealed that syllables were overwhelmingly unitonal, i.e. with pitch that was either falling or rising. Hence, pitch contours for all 12,256 vowels were determined, by subtracting the time at which minimum pitch occurred from the time at which maximum pitch was measured. A positive number indicated rising pitch, while a negative number signified falling pitch.
Falling pitch was found to be the majority pattern for all syllable positions, with rising pitch reported for 35% of all syllables analysed. For the penultimate and final syllables, the two pitch directions were associated with quite different pitch change values. In the case of the final, pitch rises (observed in 71% of finals) show a pitch change that is twice as large (1·08 semitones) as that of pitch falls (0·5 semitones). The reverse holds for penults, where the most common, falling pattern (observed in 78% of penults) is associated with a larger pitch change (0·71 semitones) than that of syllables with rising pitch (0·3 semitones). In the recordings of the ten speakers, pitch rises on the final syllable, reminiscent of a question-like intonation, were overwhelmingly observed in female speech. Thus, if the rising pitch pattern is disregarded, a marked difference arises between the penultimate and final syllables (see Table VII), suggesting that the penultimate syllable is typically more pronounced in terms of pitch change.
Mean pitch change (in semitones) according to direction of pitch excursions.
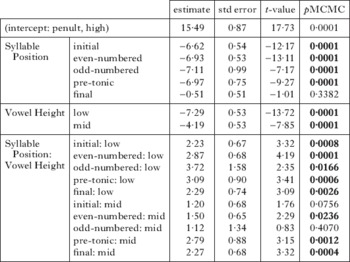
5.6 Pitch slope
Fixed-effect coefficients in a mixed-effects model fitted to pitch slope in simple words.

The measure of pitch slope introduces a temporal dimension with respect to changes in pitch. That is, it divides pitch change by the temporal distance between pitch peak and trough. The mixed-effects regression model fitted for pitch slope identified as significant the same effects that occurred with pitch change: Syllable Position, Vowel Height and the interaction of Syllable Position with Vowel Height. Indeed, as can be seen from the means presented in Table IX, pitch slope yielded results that were qualitatively similar to those of pitch change. The penultimate and final syllables stand out as having larger pitch slopes than the remaining syllables, with the penult being more pronounced for high vowels. Regression results in Table VIII thus bear a resemblance to Table VI, and will not be discussed further.
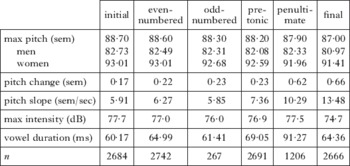
Means for all parameters according to syllable position in simple words.

5.7 Discussion: simple words
The results obtained from simple words indicate that there are substantial differences in the acoustic realisation of different syllable positions. The syllable that stands out the most is the penultimate, as a number of acoustic correlates are associated with it. In particular, the penult is the longest syllable, and one of the two loudest ones. In contrast to most other syllables, it manifests a large pitch change and a steep pitch slope. It is also marked by higher maximum pitch in subsets of the data, e.g. in women's speech, and for high vowels. This association of the penult with several acoustic correlates supports the claim that this syllable carries primary stress.
This finding is consistent with previous research, which showed that primary stress in Polish correlates with pitch fluctuations (Jassem Reference Jassem1962), maximum pitch (Dogil & Williams Reference Dogil and Williams1999) and maximum intensity (Łukaszewicz & Rozborski Reference Łukaszewicz and Rozborski2008). A novel result is that duration is also established as a stress correlate. To date, most studies have mentioned duration as having only an accessory role in marking stress. Such a weak effect is unexpected in light of findings from perception studies which showed that lengthening a vowel by as little as 20% of its duration is an effective cue to stress for Polish listeners (Jassem et al. Reference Jassem, Morton, Steffen-Batog and Jassem1968). The fact that the present study was able to find a significant effect of duration could be due to a different experimental design: I used word-list data, as opposed to data from spontaneous speech. This allowed for a much stricter control over sentence prosody and other sources of variation. Another methodological difference was that previous research customarily lumped all syllables into two groups: stressed (penultimate syllables) and unstressed (all others). The results from the previous section show that initials and finals differ significantly from other syllables, and thus grouping all non-penultimate syllables together is likely to have skewed the results. For example, final syllables tend to be lengthened phrase-finally (or PWd-finally, as will be seen in compounds). If these lengthened tokens, presumably more frequent in spontaneous speech, were included in previous analyses, a longer duration on the penult could have gone unnoticed.Footnote 6
Initial and odd-numbered syllables, traditionally believed to bear secondary and tertiary stress respectively, do not show much evidence of acoustic robustness. In particular, odd-numbered syllables are no more salient than the unstressed even-numbered syllables on any of the measures. On the contrary, odd-numbered syllables have shorter onsets, and exhibit lower maximum intensity and maximum pitch than even-numbered syllables. Some acoustic prominence is, however, observed on the initial syllable, traditionally associated with secondary stress. This position displays the largest maximum pitch and maximum intensity, and has the longest onset.
In terms of maximum pitch, the initial syllable is more prominent than all other positions, with the exception of the immediately following even-numbered syllable. The pitch differences between these two syllables are so small (0·1 semitones) that they are far below the just noticeable difference (JND) reported for speech, i.e. 1–3 semitones ('t Hart Reference Hart1981). If greater maximum pitch on the initial syllable were to signal secondary stress, one would expect the presence of a robust contrast with the adjacent syllable. I propose that, instead of signalling stress, the high maximum pitch value on the initial syllable results from ‘F0 declination’ – the cross-linguistic tendency for F0 to steadily decline across consecutive syllables in an utterance (Bolinger Reference Bolinger and Lunt1964, Cohen & 't Hart 1967, Maeda Reference Maeda1974, Ladd Reference Ladd1984).
A similar trend can be observed with respect to maximum intensity. On this measure, the initial syllable scores significantly higher than all other syllables, including the even-numbered (unstressed) position. Note, however, that even-numbered syllables have larger intensities than odd-numbered syllables, which suggests that intensity cannot be a marker of tertiary stress. Indeed, intensity values appear to progressively decrease towards the ends of words in Polish, and only rise on the penult to mark primary stress. This observation is in line with the trend reported for other languages, where intensity declines over utterances (Trouvain et al. Reference Trouvain, Barry, Nielsen and Andersen1998 for English and Dutch; Garnier et al. Reference Garnier, Dohen, Lœvenbruck, Welby, Bailly, Yehia, Demolin and Laboissiere2006 for French). As a reviewer points out, another possibility is that the increased pitch and intensity on the initial syllable result from the focus position of target words. Although the focus position is bound to result in more acoustic prominence on the initial syllable, the pitch and intensity profiles in whole utterances do point to declination effects in Polish. The spectrograms in the online supplementary materials give pitch and intensity patterns for target words in carrier phrases. These illustrate that both intensity and pitch values drop steadily over the length of entire phrases. The declination effect does not, however, preclude the possibility of the initial syllable carrying stress. After all, the difference in intensity between the initial and even-numbered syllables is large enough to be statistically significant, as opposed to the pattern observed for maximum pitch. Further experimentation, preferably investigating several prosodic environments, would be required to determine if increased intensity on the initial could signal stress. Data from compounds, presented in the next section, do not lend credence to this hypothesis, however. If intensity on the initial syllable were to mark stress, one would expect an intensity peak on the right-stem initial. Instead, only the left-stem initial exhibits prominence, and the overall intensity pattern unfolds as it would in simple words.
Finally, the initial syllable stands out in terms of onset duration. This could suggest that Polish is like Estonian in marking secondary stress by the lengthening of the onset (Gordon Reference Gordon, Lehiste and Ross1997). However, durational differences between the initial and the adjacent even-numbered syllables are not large enough to have perceptual significance. Sources vary on the JND for the duration of consonants, but even the smallest increment proposed, that of 10 ms (Klatt Reference Klatt1976), is almost twice the difference observed. Yet longer onsets are consistent with domain-initial strengthening that is independent of stress. It is thus more likely that longer word-initial onsets represent yet another word-boundary effect, well attested in the literature (Oller Reference Oller1973, Klatt Reference Klatt1974, Turk & Shattuck-Hufnagel Reference Turk and Shattuck-Hufnagel2000). Crucially, onsets in odd-numbered syllables, traditionally reported to bear tertiary stress, do not undergo lengthening. Their means are, in fact, shorter than those of other syllable positions. While this effect could point to syllable reduction, it is expected due to polysyllabic shortening – the length of all syllables undergoes compression in longer words (Turk & Shattuck-Hufnagel Reference Turk and Shattuck-Hufnagel2000). Recall that odd-numbered syllables were extracted from six-syllable words, while the remaining syllables belonged to four- and five-syllable words. Overall, the increase in onset duration visible on the initial syllable, as well as in F0 and maximum intensity, appear to be artefacts of this syllable's location at the left edge of words.
In what follows, I analyse data from compounds, which provide further support for the seemingly non-iterative nature of stress in Polish simple words. Specifically, a robust secondary stress is identified on the penultimate syllable of the non-head, leftmost stem in a subset of compounds. Moreover, the same domain-strengthening processes that operate in simple words are found to apply to the leftmost stem, which argues against the initial syllable being marked by secondary stress in simple words. Through a formal analysis, couched in Optimality Theory, I argue that the avoidance of adjacent feet largely accounts for the stress pattern observed in compounds.
6 Results for compounds
In this section, I present the acoustic and formal analysis of compounds. I start by reporting the results of the acoustic study for all compounds combined. Next, I restrict the analysis to four-syllable compounds, traditionally analysed as patterning with simple words in terms of stress (Rubach & Booij Reference Rubach and Booij1985, Kraska-Szlenk Reference Kraska-Szlenk2003).
The analysis of compounds focused on the acoustic parameters identified as correlating with primary stress in simple words: maximum pitch, pitch change, maximum intensity and vowel duration. Pitch slope was abandoned, as it yielded comparable results to pitch change. Mixed-effects models were again fitted to each parameter. Syllable Position, Vowel Height and Gender were treated as fixed effects, and Speaker and Item as random effects. Most models included by-speaker and by-item intercepts, but by-speaker and by-item slopes for Syllable Position and Vowel Height were used whenever they improved the model (specified in the discussion of each model). Random slopes were never included for Gender, as this predictor is fully correlated for any given speaker. The full model with both random slopes did not converge for any of the parameters. Note that, in the analysis of compounds, the interaction of Syllable Position with Vowel Height could not be tested, due to an imbalanced design. Lastly, the significant effect of a predictor was again determined by an ANOVA model comparison. As the lme4 package in R does not implement MCMC sampling in models containing random correlation parameters, the significance of levels provided in regression tables was determined based on t-values. Tukey post hoc pairwise comparisons were done using the glht function in the multcomp package in R.
6.1 All compounds
The following analysis combines data from all compounds in the word list. As outlined in §2.1.2, each compound stem in Polish is generally believed to mirror the stress pattern of simple words of the same length. Thus predictions as to the placement of levels of stress in compound stems are the same as the ones that applied in simple words. One additional distinction needs to be stipulated, however: the rightmost stem, being the head of the compound, is expected to be more prominent than the leftmost stem. Hence, evidence of prominence on the right-stem penult will be treated as primary stress, while prominence on the left-stem penult will be associated with secondary stress. Since levels of stress are shifted, tertiary stress is now expected to fall on the initial syllable of either stem.
6.1.1 Coding
The coding followed the widely accepted two-PWd analysis of Polish compounds, treating each stem separately. The coding yielded the following syllable positions: initial, pre-lapse, pre-tonic, penultimate and final. The initial position contains stem-initial syllables predicted to carry tertiary stress. If the initial syllable also happened to be penultimate or pre-tonic, it was coded as penultimate or pre-tonic respectively. Hence ‘initial’ only refers to syllables that begin four- or five-syllable stems. The pre-tonic position contains unstressed vowels followed by main stress. The pre-lapse position appears only in five-syllable stems, and corresponds to an unstressed vowel immediately preceding a lapse (lapses were coded together with other pre-tonic vowels).Footnote 7 The penult marks a vowel predicted to bear primary stress (if it belongs to the rightmost stem) or secondary stress (if it belongs to the leftmost stem). The final position is the last vowel in a stem. In the analysis of compounds, vowels were also coded for the stem they appeared in (L for left, and R for right). Hence almost all syllable categories have a left and right counterpart. The pre-lapse position is an exception, which only appeared in rightmost stems, as leftmost stems never contained five syllables. An example of the coding of compounds is given in (10).
(10)
6.1.2 Vowel duration
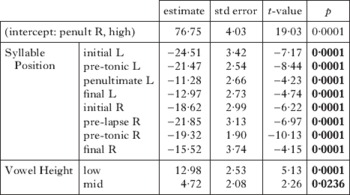
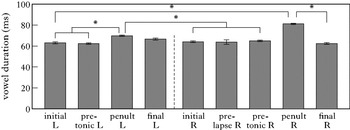
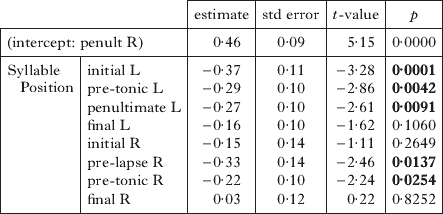
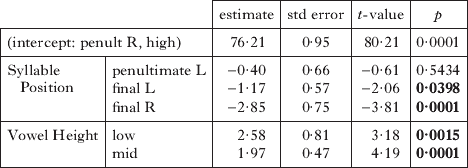
The mixed-effects regression model fitted for vowel duration (Fig. 10 and Table X) found significant effects of Syllable Position and Vowel Height, but not of Gender. The model included by-speaker slopes for Syllable Position, and by-word slopes for Vowel Height. In all figures in this section, stem boundaries are indicated by a dashed line. For all regression tables, the right-stem penult was selected as the baseline, as it was expected to carry primary stress. In any model which includes Vowel Height and/or Gender as a significant predictor, the baseline represents the mean value of the penult for high vowels and/or female speech.
Fixed-effect coefficients in a mixed-effects model fitted to vowel duration in compounds.

Mean vowel duration (in ms) according to syllable position in compounds.

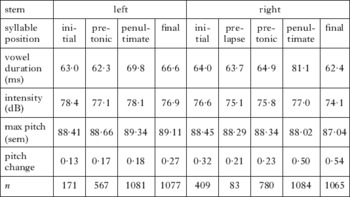
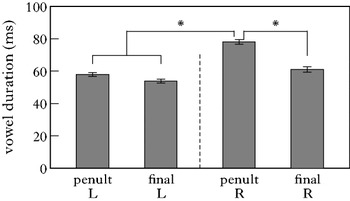
The significant effect of Syllable Position implies that vowel duration is affected by the position a syllable occupies within a word. Table X shows that all syllable positions are significantly shorter than the baseline, i.e. the right-stem penultimate syllable. This is evidenced in the large negative coefficients calculated for each position. Note that the left-stem penult is the longest of the remaining syllables, as its coefficient is the smallest. Tukey post hoc tests confirmed that the effect of Syllable Position is due to a significantly greater duration of the two penults (left stem: M=69·8 ms; right stem: M=81·1 ms). Both penults are significantly longer than most other syllables (all p<0·01), with the right-stem penult still significantly longer than the left-stem penult (p<0·01). The only comparisons that did not reach significance were between the left-stem penult and both finals (for both, p=1). Another syllable which stands out in length is the left-stem final, found to be significantly longer than the initial and pre-tonic syllables sharing its stem (both p<0·05). This longer duration may be due to the syllable's position between PWds. Finally, the left-stem initial is significantly shorter than the right-stem initial position (p<0·05). Means for particular syllable positions are presented in Table XV below.
Vowel Height was identified as another significant predictor of vowel duration. As in simple words, vowel duration increases as vowel height decreases: mid and low vowels are longer than the baseline high vowels in the penultimate position, by 4·72 ms and 12·98 ms respectively. Tukey pairwise comparisons between these sets of vowels were again significant (all p<0·05).
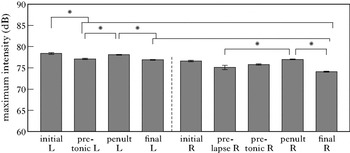
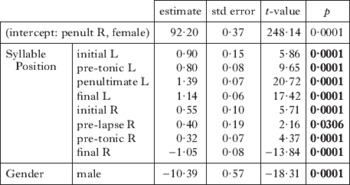
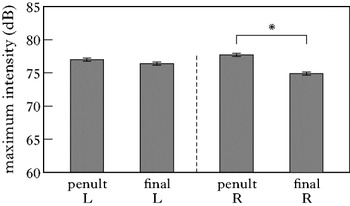
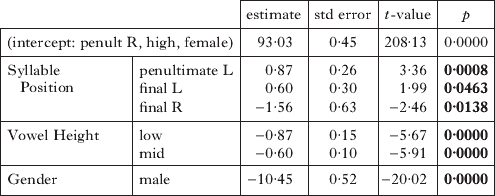
6.1.3 Maximum intensity
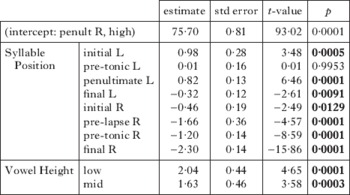
The mixed-effects regression model fitted for maximum intensity (Fig. 11 and Table XI) found a significant effect of Syllable Position and Vowel Height, but not of Gender. By-speaker and by-word slopes for Vowel Height were included in the model.
Fixed-effect coefficients in a mixed-effects model fitted to maximum intensity in compounds.

Mean maximum intensity (in dB) according to syllable position in compounds.

Syllable Position was found to be a significant predictor of maximum intensity values. In general, the largest maximum intensity is found on leftmost stems: the two highest average maximum intensity values belong to the left-stem initial (M=78·4 dB) and penultimate (M=78·1 dB) syllables. This pattern is reminiscent of simple words, where intensity declination was observed. Despite the fact that the left stem manifests greater intensity, penults in both stems have higher intensity values than adjacent syllable positions. In fact, the syllable with the highest maximum intensity in rightmost stems is again the penult (M=77 dB). Tukey pairwise comparisons support these observations. Specifically, the left-stem penult has significantly greater maximum intensity than all other syllable positions (all p<0·001), except for the left-stem initial (p=1). Maximum intensity on the latter also exceeds that of all remaining syllables (all p<0·05). A very similar pattern is observed on the rightmost stem. Here, the penult has a significantly greater maximum intensity than all other syllables that share the same stem (all p<0·001), except for the initial syllable (p=0·21). Although the right-stem initial position has a greater maximum intensity than other non-penultimate right-stem syllables (for all comparisons, p<0·05), it is almost equal in intensity to the adjacent left-stem final syllable (p=1).
Vowel Height is another significant predictor of maximum intensity. As in simple words, this effect can be attributed to different inherent intensities for vowels of different height. Table XI illustrates the trend already observed in simple words: maximum intensity increases as height decreases. Tukey pairwise comparisons established that mid and low vowels were significantly different from high vowels on this parameter (both p<0·0001), but were not different from each other (p=0·19).
6.1.4 Maximum pitch
The mixed-effects regression model fitted for maximum pitch (Fig. 12 and Table XII) found significant effects of Syllable Position and Gender, but not of Vowel Height. By-speaker and by-word slopes for Vowel Height were included in the model.
Fixed-effect coefficients in a mixed-effects model fitted to maximum pitch measurements in compounds.

Mean maximum pitch (in semitones) in different syllable positions in compounds.

The significant effect of Syllable Position implies that maximum pitch values can be predicted based on the position of a syllable within a word. Table XII shows that in female speech all syllable positions are significantly different from the baseline right-stem penult. Positive coefficients for all positions except for the right-stem final suggest that maximum pitch values are typically higher on syllables leading up to the right-stem penult. This result likely reflects the same declination effect observed for maximum pitch in simple words. Note that the syllable position associated with the largest positive coefficient (highest maximum pitch) is the left-stem penult, traditionally described as carrying secondary stress. In addition, Table XIII shows that in men's speech, the highest maximum pitch on the right stem is also associated with the penultimate syllable. Post-hoc Tukey tests confirmed these differences to be statistically significant. In particular, the left-stem penult has a significantly larger maximum pitch than any other syllable position (all p<0·05), while the right-stem penult has significantly greater pitch than the following final syllable (p<0·001), but has significantly lower pitch than the preceding pre-tonic syllable (p<0·001). Lastly, a number of significant comparisons arise which seem to result from pitch declination. Specifically, the right-stem final's maximum pitch is significantly lower than that of any other syllable (all p<0·001). The left-stem final, in turn, has higher pitch than all syllables belonging to the rightmost stem (all p<0·01), as well as the left-stem pre-tonic syllable (p<0·01). The latter also manifests higher pitch than some right-stem syllables, i.e. the pre-tonic, the penultimate and final syllables (all p<0·01).
Means (in semitones) and sample sizes for maximum pitch in compounds.
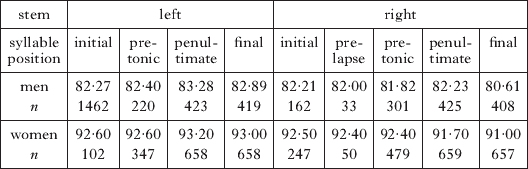
Values of maximum pitch are also affected by Gender. Table XIII summarises the pitch pattern observed in male and female speech. Unsurprisingly, maximum pitch is consistently lower for men than for women. It is worth noting, however, that in men's speech, the right-stem penult displays a pitch peak absent from women's speech.
6.1.5 Pitch change
The model fitted for pitch change (Fig. 13 and Table XIV) reveals a significant effect of Syllable Position, with no effect of Vowel Height or Gender. The model presented here includes by-speaker slopes for Syllable Position and Vowel Height, and by-word slopes for Vowel Height, as they improved the overall fit.
Fixed-effect coefficients in a mixed-effects model fitted to pitch change in compounds.
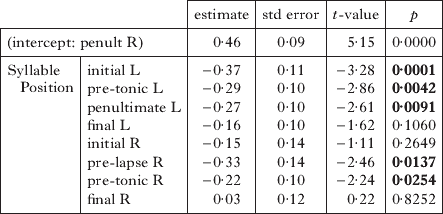
Mean pitch change (in semitones) according to syllable position in compounds.

The significant effect of Syllable Position suggests that pitch change is not uniform across syllable positions. The negative coefficients observed in Table XIV for the various levels of this predictor indicate that almost all syllables exhibit a significantly lower pitch change than the baseline right-stem penultimate position. The only exception is the right-stem final, whose mean pitch change is very close to that of the right-stem penult. Post hoc Tukey tests confirm that the effect of Syllable Position is due to a significantly greater pitch change on the right-stem penult when compared to the left-stem initial and pre-tonic syllables (both p<0·05). No other comparisons were statistically significant. Note that the left-stem penult does not manifest a statistically greater pitch change than any other syllable.
Means for all parameters in compounds are given in Table XV.
Means for all parameters according to syllable position in compounds.

6.2 Four-syllable compounds
I now turn to the analysis of four-syllable compounds with two disyllabic stems, such as /bɔgɔ-bɔjna/ ‘god-fearing’. These compounds have been described as constituting single PWds, based on the assumption that they exhibit the same stress pattern as simple words (primary stress on the penultimate, secondary stress on the initial syllable). I show that they do pattern with simple words, rather than compounds. This affinity, however, is due to the absence, rather than the presence, of secondary stress.
6.2.1 Vowel duration
The model fitted for vowel duration (Fig. 14 and Table XVI) found significant effects of Syllable Position and Vowel Height. In addition, by-speaker slopes for Syllable Position and Vowel Height, as well as by-word slopes for Syllable Position, improved the model, and were thus included in the best fit reported here.
Fixed-effect coefficients in a mixed-effects model fitted to vowel duration in four-syllable compounds.
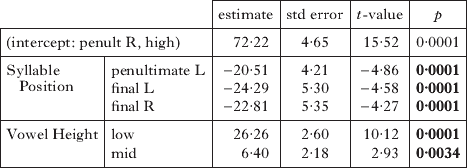
Mean duration (in ms) according to syllable position in four-syllable compounds.

The significant effect of Syllable Position implies that vowel duration varies with the position of a syllable within a word. Table XVI shows that the baseline right-stem penult is significantly longer than all other syllable positions. In fact, all syllables are between 20 and 25 ms shorter than the right-stem penult, which is consistent with Klatt's (Reference Klatt1976) reported value for the perceptual threshold for vowel length, i.e. 25 ms. Tukey tests confirm the special status of the right-stem penult, as it is identified as significantly longer than all other positions (p<0·05). Although the left-stem penult is on average longer than the left-stem final, this difference is not statistically significant (p=0·37).
Vowel Height also emerges as a predictor of vowel duration. Table XVI illustrates that both mid and low vowels are longer than the baseline high vowels in the penultimate position, with the low vowel /a/ being the longest of all. Tukey tests identified the comparison of high and low vowels as statistically significant (all p<0·001).
6.2.2 Maximum intensity
The model fitted to maximum intensity measurements also established a significant effect of Syllable Position and Vowel Height. By-speaker slopes for Syllable Position and Vowel Height as well as by-word slopes for Syllable Position were included in the model. Regression results are provided in Table XVII.
Fixed-effect coefficients in a mixed-effects model fitted to maximum intensity in four-syllable compounds.
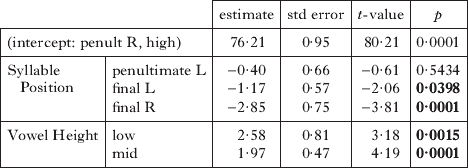
The fact that Syllable Position was identified as a predictor of maximum intensity suggests that intensity does not display a uniform pattern throughout the length of compounds. This is compatible with results reported in previous sections, where a declination effect was consistently observed. Figure 15 and Table XVII again show that all syllable positions are lower in intensity than the baseline right-stem penult. The left-stem penult (corresponding to the left-stem initial elsewhere in this paper) again exhibits higher intensity than all remaining positions, while the right-stem final's intensity is lowest of all. These observations are confirmed by Tukey tests, which identify the right-stem penult as having significantly greater intensity than the following final (p<0·001). Although mean maximum intensity is slightly greater on the right-stem penult (M=77·7 dB) than on the left-stem penult (M=77 dB), this difference is not statistically significant (p=0·9). Possibly due to the declination effect, the right-stem final was found to manifest significantly lower intensity than the left-stem penult (p<0·05).
Mean maximum intensity (in dB) according to syllable position in four-syllable compounds.

Vowel Height is another predictor of maximum intensity values. Table XVII shows that baseline high vowels overall have lower intensity (by about 2 dB) than mid and low vowels in the penultimate position. Tukey pairwise tests found the comparison between high and mid vowels, and high and low vowels, to be significant (in each case, p<0·01), as opposed to that between mid and low vowels (p=0·6).
Fixed-effect coefficients in a mixed-effects model fitted to maximum pitch measurements in four-syllable compounds.
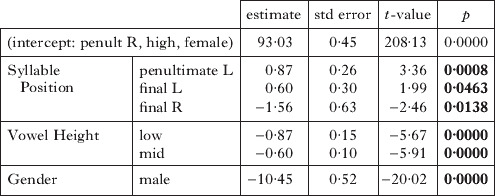
6.2.3 Maximum pitch
As in previous sections, the model for maximum pitch identified Syllable Position, Vowel Height and Gender as predictors of the values of this parameter. The model reported here includes by-speaker slopes for Syllable Position and by-word intercepts. Regression results are provided in Table XVIII.
Means (in semitones) and sample sizes for maximum pitch in four-syllable compounds.
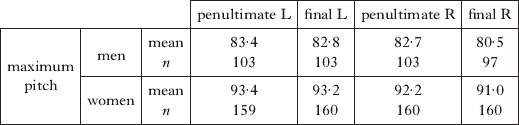
As a significant predictor, Syllable Position reveals fluctuations in the pattern of maximum pitch displayed by compounds. Contrary to the analysis of all compounds, this effect was no longer due to greater pitch on the penults. Instead, the results reflect the declination pattern found for simple words. Specifically, Fig. 16 and Table XVIII illustrate that maximum pitch is highest on the left-stem penult (word-initial syllable) and decreases consecutively with every syllable. Tukey tests confirmed the left-stem penult to be significantly different from the right-stem syllables (p<0·01), but not the left-stem final (p=0·5). Although the right-stem penult has greater maximum pitch than the following final (p<0·05), its values are lower than those of left-stem syllables.
Mean maximum pitch (in semitones) in different syllable positions in four-syllable compounds.
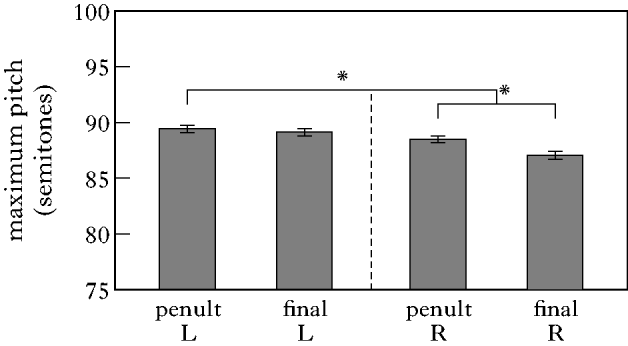
Another significant predictor of maximum pitch values is Vowel Height. Table XVIII shows that high vowels on average have higher pitch than mid and low vowels in the baseline penultimate position. As the coefficients for mid and low vowels are close, and imply a decrease in pitch of 0·6 and 0·9 semitones respectively, one would not expect them to be significantly different from each other. In fact, Tukey tests confirmed that high vowels had greater pitch than mid and low vowels (for both, p<0·001), but a comparison of mid and low vowels did not yield significance (p=0·16).
Finally, the effect of Gender implies that men and women have different pitch ranges. Indeed, Table XVIII shows that for high vowels in the right-stem penultimate position maximum pitch is generally 10 semitones lower for men than for women. This finding is consistent with results reported in previous sections. Crucially, Table XIX illustrates that both genders exhibit the declination pattern evident in Fig. 16.
6.2.4 Pitch change
In the model for pitch change, syllable position emerged as the only significant predictor. In terms of random effects, only by-speaker slopes for Syllable Position were included in the model, as by-word slopes and intercepts did not improve the overall fit. Regression results are provided in Table XX.
Fixed-effect coefficients in a mixed-effects model fitted to pitch change in four-syllable compounds.
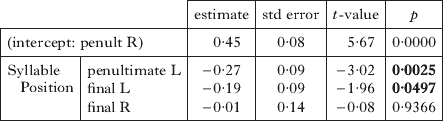
Figure 17 illustrates that the significant effect of Syllable Position is due to strikingly different pitch change values for the two stems. Table XX identifies the right-stem penult as the syllable characterised by the largest pitch change, with the remaining positions associated with negative coefficients. Tukey tests confirmed these observations, establishing a significant contrast between the right-stem and the left-stem penults (p<0·05). However, no significant difference was observed between the right-stem penult and adjacent syllables: the left-stem final (p=0·19) and right-stem final (p=0·99).
Mean pitch change (in semitones) according to syllable position in four-syllable compounds.

Means for all parameters according to syllable position in four-syllable compounds.
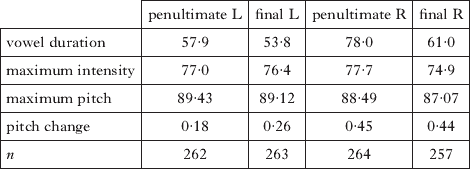
6.3 Discussion: compounds
The analysis of compounds confirms the location and acoustic make-up of main stress in Polish, as well as identifying the presence of secondary stress. In line with theoretical descriptions of Polish compounds, the head stem shows a penultimate (primary) stress, while the non-head stem optionally shows another penultimate (secondary) stress. The two stresses are robust, in that they correlate with multiple acoustic parameters, i.e. maximum pitch, maximum intensity and duration. What differentiates them, however, is that the head penultimate syllable additionally correlates with a large pitch change. It is also substantially longer than the non-head penultimate syllable (81·1 ms as compared to 69·8 ms).
The presence of two stresses is not, however, confirmed for four-syllable compounds. Here, it is only the right-stem penult that is acoustically more prominent than the neighbouring vowels, and manifests greater pitch change, maximum intensity and duration. It is worth noting that this syllable position does not correlate with maximum pitch, as it did in the analysis of all compounds. Instead, pitch values are highest on the left-stem penult (compound-initial), and decrease progressively towards the ends of words. This pattern is reminiscent of what was observed for simple words. Thus, while longer compounds have penultimate stresses on each stem, four-syllable compounds are indistinguishable from simple words on the basis of stress correlates.
The number of stresses informs the prosodic analysis of compounds. It is typically assumed that the number of (primary) stresses in compounds coincides with the number of PWds present (Nespor Reference Nespor1999). A question arises, therefore, as to the nature of the second stress we have observed in Polish compounds. If it is in fact secondary, then Polish compounds should constitute single PWds. If it is a separate instantiation of primary stress, a prosodic boundary should be present between stems. I argue that the latter interpretation is most valid. First, the location of the second stress corresponds to the canonical position of primary stress in Polish, i.e. the penultimate syllable. Second, although its weaker prominence could point to it being a lower-degree stress, the head stem is expected to be stronger in compounds that form a phonological phrase (see Nespor Reference Nespor1999 for an analysis of prominence in [word]+[word] compounds in left- and right-branching languages). Lastly, the present data set points to phonetic evidence for the presence of a prosodic boundary between compound stems. Glottal stop insertion, which arguably applies across PWd boundaries in Polish in cases of vowel hiatus (Kraska-Szlenk Reference Kraska-Szlenk2003), was sometimes observed between stems in [samɔ-ɔbrɔna] ‘self-defence’ and [vɔdɔ-ɔtpɔrnɔɕtɕ] ‘water-proof (n)’. Hence, although the left-stem stress in compounds is phonetically weaker than the right-stem stress, it is more accurate to describe it as a separate instantiation of primary stress on phonological grounds.
By that token, Polish compounds differ in terms of their prosodic structure: some are two-PWd structures ([ʑεˈlɔnɔ][bεˈʒɔvɨ] ‘green-beige’), while others constitute single PWds ([bɔgɔ-ˈbɔjna] ‘god-fearing’). As such, the latter share the structure of compounds whose second constituent is monosyllabic, such as [duɕ-ˈi-grɔʃ] ‘penny pincher’ and [ʒuwt-ˈɔ-dʑup] ‘greenhorn’. For these compounds, Rubach & Booij (Reference Rubach and Booij1985) propose a rule of ‘demoting’, which erases the internal PWd (or mot) boundary to avoid stress clash. In the following section I reanalyse this pattern as an effect of the *FtFt constraint. Specifically, I argue that compound stems are parsed into separate PWds and assigned separate stresses only if the emergent trochees are non-adjacent.
The presence of a greater pitch change on the head penult also has implications for the structure of compounds. Jassem (Reference Jassem1962) identified pitch change as the most robust correlate of main stress in Polish, and claimed that Polish stress is essentially a pitch accent. If pitch change were the only, or main, correlate of stress, as Jassem (Reference Jassem1962) argues, then all compounds should be treated as single PWds. Yet the association of the non-head penult in longer compounds with such parameters as maximum pitch, maximum intensity and duration is undeniable, and cannot indicate anything other than stress. I would therefore like to suggest that while pitch change is associated with pitch accent in Polish, it does not in itself represent word-level stress. Rather, word-level stress is represented by greater maximum pitch, maximum intensity and duration. At the same time, the fact that a pitch accent falls on the penultimate syllable in Polish is not accidental, and results from the general tendency for pitch accents to be attracted to the strongest stress in an utterance (see Hayes Reference Hayes1995 for English). I believe that the same interaction of stress and pitch takes place in Polish – pitch accents are attracted to (stressed) penultimate syllables. Instead of indicating the presence of a single PWd, the greater pitch change on the head penultimate syllable may thus be a reflection of a recursive structure. To propose that Polish compounds represent recursive PWds is not at all controversial. For example, Rubach & Booij (Reference Rubach and Booij1985) argue that compound stems are mots embedded in another mot, while Kraska-Szlenk (Reference Kraska-Szlenk2003) analyses them as PWds embedded in a MWd. The recursive analysis is supported by the fact that the right-stem penult is acoustically more prominent. According to Nespor (Reference Nespor1999), this added prominence on the head stem is evidence that the compound stems together form a phonological phrase. Lastly, a pitch accent on the right-stem penult could potentially account for the perceived levels of stress in compounds. Perceptual evidence would be required to support this conjecture, however.
The analysis of compounds sheds new light on the issue of the absence of lower levels of stress in simple words. In simple words, tertiary stress was found to be non-existent, while possible evidence of secondary stress was recognised on the initial syllable. This position coincided with a larger maximum pitch, maximum intensity and onset duration, all of which could also be explained as boundary effects. In the analysis of compounds, tertiary stress was expected to arise on initials in all stems of at least four syllables in length (positions coded as Initial L and Initial R), but again, phonetic evidence is scarce. The only measures correlating with these positions were maximum pitch and maximum intensity. Both parameters have the highest values on the left-stem initial syllable, which could be due to its compound-initial position. Although the right-stem initial also exhibits a larger maximum intensity than the two following syllables, it is not significantly different from the syllable that precedes it (Final L). In fact, its mean maximum intensity is lower than that of the left-stem final. Thus, the correlation of maximum pitch and maximum intensity with left-stem initials again appears to result from the general downward trend in F0 and intensity.
7 Analysis of compounds
In what follows, I provide an analysis of the stress pattern in Polish compounds, based on the results of the present study. The analysis is formalised in Optimality Theory.
I follow previous research on Polish stress in assuming that the main stress is parsed into a trochaic foot, and that this foot is always aligned with the right edge of a PWd (Rubach & Booij Reference Rubach and Booij1985, Kraska-Szlenk Reference Kraska-Szlenk2003). This suggests that the constraints FtHead-L and Align(PWd, R; Ft, R) are active in Polish, and that they dominate their respective mirror constraints, FtHead-R and Align(PWd, L; Ft, L). As FtHead-L and Align(PWd, R; Ft, R) are almost never violated in the language, they will not be included in the tableaux, and only candidates with word-final trochees will be considered. Formal definitions of the constraints used are provided in (11).
- (11)
Parse-σ
Assign a violation mark for every syllable not dominated by a foot (McCarthy & Prince 1993).
b. EndRule-L
Assign a violation mark for every word-level prominence that precedes another prominence at the word level (Prince 1983, McCarthy 2003).
a.
Compounds in Polish generally exhibit prominences on penults of both stems. This common difference between simple words and compounds in terms of the number of stresses allowed has been attributed to the fact that compounds involve multiple morphological stems (Alderete Reference Alderete1999, Fitzgerald Reference Fitzgerald2001, Gouskova Reference Gouskova2010). Thus I adopt the Align(Stem, L; PWd, L) constraint, which requires that the left edge of a morphological stem coincide with the left edge of a PWd.
(12) Align-(Stem, L; PWd, L)
Assign a violation mark for each stem whose left edge is not aligned with the left edge of a PWd (McCarthy & Prince 1993).
Following previous analyses of Polish (e.g. Rubach & Booij Reference Rubach and Booij1985, Kraska-Szlenk Reference Kraska-Szlenk2003), I have taken the presence of stress as evidence for the prosodic structure of compounds, assuming that the number of stresses corresponds to the number of PWds. Thus I analyse compounds that are at most four syllables long as constituting single PWds, and compounds longer than that as constituting two PWds.
(13) demonstrates that the ranking of Align(Stem, L; PWd, L) above Parse-σ accounts for the parsing of compounds like /ʑεlɔnɔ-bεʒɔvɨ/ into two separate PWds instead of one (candidate (b)). It also disfavours misalignments of PWd edges (c). Further, the ranking of EndRule-L above Parse-σ ensures that no PWd will receive more than one stress (d).
(13)
Four-syllable compounds like /nɔvɔ-mɔdnɨ/ ‘modern’ exhibit only one stress, and thus depart from the prosodic structure of compounds like /ʑεlɔnɔ-bεʒɔvɨ/. I propose that the dichotomy in the number of stresses present on compounds in Polish is the result of clash avoidance. In particular, both compound stems are assigned independent stresses, as long as doing so does not create adjacent (stressed) feet, regardless of whether a PWd boundary separates them. The data from Polish compounds show that a lapse of a single unstressed syllable between stresses suffices for these stresses to surface, as in [ʑε(ˈlɔnɔ)]PWd [bε(ˈʒɔvɨ)]PWd. Conversely, a potential clash of stressed feet is present in compounds like *[(ˈnɔvɔ)][(ˈmɔdnɨ)]. The clash is avoided by parsing the two stems into a single PWd, assigned only one stress, which falls on the rightmost, head stem: [nɔvɔ-(ˈmɔdnɨ)].Footnote 8 To account for this dependency between prosodic structure and clash avoidance, *FtFt (Kager Reference Kager1994, Elenbaas & Kager Reference Elenbaas and Kager1999) needs to be introduced into the ranking.
(14)
(15) demonstrates that *FtFt must dominate Align(Stem, L; PWd, L) for a single stress to arise in four-syllable compounds. Specifically, *FtFt bans adjacent stressed feet, be it in a single PWd (b), or in separate PWds (c).
(15)
The rankings established so far combine to give the overall ranking in (16). Since *FtFt is undominated, the prosodic structure of Polish compounds appears to be largely determined by clash avoidance. EndRule-L is also undominated by any of the constraints presented in this analysis, which speaks to the fact that Polish words have non-iterative footing.
(16)
The ranking in (16) makes very specific predictions about compounds in Polish, i.e. all compounds whose rightmost stem is a disyllable should manifest only one stress, due to clash avoidance.Footnote 9 For example, a potential clash is present in /nɔvɔ-mɔdnɨ/ ‘modern (nom)’, but not in /nɔvɔ-mɔdnεmu/ ‘modern (gen)’. If clash avoidance drives prosodic structure in Polish compounds, these two compounds should exhibit a different number of stresses. Specifically, /nɔvɔ-mɔdnɨ/ is predicted to involve only one stress, and thus constitute one PWd: [nɔvɔ-(ˈmɔdnɨ)]PWd, while /nɔvɔ-mɔdnεmu/ should involve two stresses and constitute two PWds: [(ˌnɔvɔ)]PWd [mɔd(ˈnεmu)]PWd. This prediction should hold for all compounds, irrespective of length. This is not to say, however, that the presence of other factors possibly overriding clash avoidance is precluded. First, some compounds are more lexicalised than others. That is, some adjective–adjective combinations are more fossilised than others. For example, while the compound /ʧarnɔ-bjawɨ/ ‘black-white’ is a fixed expression that exists as a dictionary entry, /ʧarnɔ-bεʒɔvɨ/ ‘black-beige’ is not. It is possible that the non-fossilised compounds could exhibit two stresses and perhaps even depart from the prosodic structure of compounds altogether. Second, lexical frequencies of compounds may be a confounding factor in their prosodic make-up (see Gouskova Reference Gouskova2010 for Russian). The speakers recorded for this study expressed some doubt as to the stress pattern in compounds that were relatively old-fashioned, e.g. /ʧɨɕtɕi-but/ ‘shoe-shiner’, often initially stressing both stems before correcting themselves. Although the variation observed for /ʧɨɕtɕi-but/ may also have to do with the avoidance of stressing the linking vowel, it shows that Polish speakers might not be consistent in interpreting the prosodic structure of compounds. A follow-up experiment, focusing on the acoustic properties of compounds with varying stem length, would have to be conducted to broaden our understanding of Polish compound prosody.
8 Discussion
The production study presented in this paper suggests that the acoustics of Polish simple words and compounds may not reflect the four levels of stress posited by impressionistic accounts of Polish stress. The acoustic analysis of a series of parameters successfully identified multiple correlates of primary stress. The penultimate syllable in simple words and the head-stem penultimate syllable in compounds correlate with greater values of vowel duration, maximum intensity, maximum pitch and pitch change. The same parameters were generally not found to peak on syllables traditionally associated with lower levels of stress. Although initial syllables in simple words, previously described as bearing secondary stress, were characterised by higher pitch, greater intensity and longer onsets, these effects may be boundary-related phenomena. As such, they are unlikely to represent stress, but could account for the perception of stress on this syllable. It is possible, however, that the observed intensity peak on the initial syllable does in fact represent secondary stress. More acoustic and perceptual work would be needed to address this issue. In particular, without literature on JNDs specific to Polish, it is hard to estimate whether the differences observed in intensity between initial and even-numbered syllables are large enough to be perceived as stress. In addition, it remains an open question whether the initial prominence would be replicated, for example, in a reading task, where the target word would not be focused. Irrespective of what the initial prominence on Polish words represents, the crucial observation is that odd-numbered syllables, supposedly marked by tertiary stress, were not found to be any more salient than adjacent unstressed syllables.
The limited evidence for the presence of lower levels of stress in simple words has a number of implications. At the level of the acoustic analysis, one could argue that secondary and tertiary stresses in Polish simple words may employ a different set of parameters than the ones investigated here. Theoretically, the possibilities are endless. However, it would be typologically unusual for Polish to employ different acoustic parameters for different levels of stress (see §2.3). Since Polish primary stress already exhibits multiple correlates, it is reasonable to expect for lower levels of stress to employ at least a subset of those. With that caveat in mind, let us consider a few possibilities.
Lower levels of stress could potentially be manifested through the use of parameters not investigated in this study. Changes in vowel quality are but one common consequence of the presence of stress. An analysis of formant values could provide some insight into possible vowel reduction in the case of unstressed syllables. If Polish does exhibit a rhythmic pattern of stresses, one would expect full and reduced vowels to alternate. Other measures which have been shown to correlate with stress concern spectral balance, such as the open quotient, amplitude of voicing and closure rate/skewness of the glottal pulse (for American English, see Okobi Reference Okobi2006, and for American English and Dutch, see Sluijter & van Heuven 1996). Neither of these studies investigated the role of these correlates in marking lower levels of stress, however.
Another possibility is that lower levels of stress in Polish are marked by articulatory parameters, none of which have been investigated here. Indeed, it has been suggested for English that lower degree stresses are more reliably characterised by articulatory parameters than acoustic ones (e.g. de Jong Reference De Jong1991 and Beckman & Edwards Reference Beckman, Edwards and Keating1994, as cited in Dogil & Williams Reference Dogil and Williams1999). Yet there is no indication that this is the case for Polish. Dogil & Williams (Reference Dogil and Williams1999) conducted a pilot study using the EMA technique, in which they compared stressed and unstressed syllables in terms of movement size and movement shape for the cycle of the middle tongue. No significant differences were found.
Yet another way to explain the data is to suggest that rhythmic stresses do not have fixed locations in Polish words, and may fall on, for example, even-numbered syllables, designated as unstressed in traditional descriptions. In fact, even-numbered syllables are longer than the adjacent initial and odd-numbered syllables. Next, they have a slightly greater pitch change than initials (by 0·5 semitones), but this number is much smaller than the JND of 1–3 semitones required for speech perception ('t Hart Reference Hart1981). Finally, maximum intensity is significantly higher on even-numbered syllables than on odd-numbered syllables (by 1 dB), but this effect may be ascribed to intensity declination. Importantly, all of these effects disappear in compounds, where the pre-lapse position (corresponding to even-numbered syllables in simple words) is not significantly different from adjacent syllables on any of the four measures. On the contrary, its intensity values are lower than those of adjacent syllables. Thus, although slightly higher values on some measures could indicate secondary stress on even-numbered syllables, these correlations are probably accidental.
Finally, the lack of robust acoustic correlates for subsidiary degrees of stress may suggest that these stresses are simply not there. While no acoustic evidence points to the presence of tertiary stresses at all, the semblance of secondary stresses in Polish appears to be an artefact of boundary-induced effects. This possible absence of lower levels of stress is supported by perception studies, which have shown that the discrimination of what is believed to be secondary and tertiary stress in Polish is extremely unreliable (Steffen-Batogowa Reference Steffen-Batogowa2000). Although some degree of stress deafness (Dupoux et al. Reference Dupoux, Pallier, Sebastián and Mehler1997) is to be expected because of the non-contrastive nature of lower levels of stress in Polish, the fact that stress placement identification issues do not extend to primary stress, which is also non-contrastive, at the very least suggests that Polish speakers less readily discern the presence of secondary and tertiary stress. In addition, unlike in English or Russian, there are no known segmental consequences for the stressed–unstressed distinction in Polish. That is, stress has a phonetic effect on the stressed syllable only, making it longer, louder and more dynamic in terms of pitch. Unstressed syllables, however, are not thought to be reduced in any way. There are also no phonological processes that would depend on the presence of lower levels of stress, or that could provide abstract evidence to support the existence of these stresses.
The absence of lower levels of stress in Polish would bear on theories of bidirectional foot parsing (Kager Reference Kager1993, McCarthy Reference McCarthy2003). All previous work on Polish stress, whether purely theoretical or experimental, has relied on descriptions of the language that have depicted it as a system manifesting bidirectional foot assignment, with lapses arising through clash avoidance, always adjacent to the main stress (Dłuska Reference Dłuska1957, Rubach & Booij Reference Rubach and Booij1985). These impressionistic descriptions provided indirect support for the existence of bidirectional systems as such, by including in this group a well-documented, robust language. In addition, Polish was the only language where the bidirectional stress pattern had not been contested on morphological or lexical grounds. In the light of the data presented in this paper, the description of Polish stress as a bidirectional system is called into question. Specifically, acoustic data point to the existence of only one stress per word, and show no signs of lower levels of stress. If Polish were to be excluded from the group of languages manifesting the bidirectional stress system with internal lapses, the validity of this stress type would be undermined. In particular, the same mechanisms responsible for the perception of illusory secondary stress in Polish may have been at play in the descriptions of the remaining languages reported to show this system. This hypothesis is rendered even more probable in the case of extinct languages, such as Piro and Garawa, each of which is only described by one primary source. The theoretical implication of the absence of bidirectional stress systems with internal lapses is the inadequacy of the constraint sets that have been used to generate these systems, as they overgenerate not only the Polish pattern in (2a), but also its mirror image in (2b). It appears that only iterative bidirectional systems with internal clashes should be predicted. Although this stress pattern, dubbed as ‘binary plus clash’ in Gordon's (Reference Gordon2002) stress typology, is equally typologically rare, its existence has been verified in acoustic studies (Gordon & Rose Reference Gordon and Rose2006 for Émérillon, Hintz Reference Hintz2006 for South Conchucos Quechua).
Further experiments would be needed to decide between these alternative interpretations. Acoustic and articulatory parameters not investigated in this paper could potentially yield a different result. In addition, since Polish primary stress correlates with multiple parameters, it is possible that there is not a single parameter that marks stress. Instead, stress may be expressed through a particular configuration of correlates. As the associate editor points out, statistical classification and clustering analyses could reveal effects not captured in this paper. Specifically, the measured values could be fed into supervised (classification) and unsupervised (clustering) machine learning paradigms using models for competing stress patterns, e.g. iterative vs. non-iterative. If Polish is a bidirectional stress system, the expectation is that the iterative model will do better at classifying or clustering the syllables. It is also possible that the present analysis was underpowered statistically because it distinguished several syllable positions. An analysis that would pool measurements across all positions with the same expected stress level could reveal more robust distinctions.Footnote 10 Lastly, controlled perception experiments would perhaps provide most insight into whether rhythmic stresses are posited by Polish speakers. Since Polish speakers do not have robust intuitions about the presence or location of secondary stress (Steffen-Batogowa Reference Steffen-Batogowa2000), powerful discrimination techniques would have to be employed. One such technique is the mismatch negativity design used in both EEG and MEG (Idsardi & Poeppel Reference Idsardi, Poeppel, Cohn, Fougeron and Huffman2012). Similar to standard habituation techniques, mismatch negativity designs rely on an ‘oddball’ response to a stimulus that differs from the rest. In the case of Polish stress, an oddball stimulus would presumably be a word-initial syllable with secondary stress in a series of unstressed initial syllables (possibly cross-spliced into words of the same length). However, a question arises as to the creation of the stimuli themselves. As we have not yet found a single acoustic parameter that would correlate with lower levels of stress, its supposed presence in the stimuli could not be verified.
9 Conclusions
This paper has challenged the validity of traditional descriptions of Polish stress, and more generally, of theories of directional foot parsing. The Polish stress system, with its alleged internal lapses, has been described as an example of a rare bidirectional system (Kager Reference Kager1993, McCarthy Reference McCarthy2003). However, the lack of acoustic evidence for the existence of secondary and tertiary stress seriously undermines this claim.
The location of primary stress on the penultimate syllable is unquestionable, as this position consistently correlates with greater values of all of the parameters investigated. However, the presence of lower levels of stress is doubtful. In particular, there is no indication that every other syllable carries stress, as odd-numbered syllables (traditionally associated with tertiary stress) were not found to be any more prominent than unstressed syllables. Similarly, although the initial syllable, purportedly manifesting secondary stress, is the most prominent position in terms of maximum pitch and maximum intensity, this prominence may well result from F0 and intensity declination over utterances. This claim is supported by data from compounds, where only left-stem initials have greater pitch and intensity, and right-stem initials are not significantly different from adjacent syllables.
The only types of words that do allow more than one stress are compounds, but the number of stresses they exhibit is not unrestrained. Quadrisyllabic compounds have only one (penultimate) prominence, and constitute a single PWd. Compounds longer than four syllables manifest robust penultimate stresses on each stem, indicating a two-PWd structure. This dichotomy in the prosodic structure of compounds is argued to result from clash avoidance, visible in the undominated ranking of *FtFt.