Introduction
Human toxocariasis is an important worldwide zoonotic disease caused by Toxocara canis or Toxocara cati (Moreira et al., Reference Moreira, de Lima Telmo, Mendonça, Moreira, McBride, Scaini and Conceição2014). Humans acquire the disease through the ingestion of fully embryonated eggs or the infective larvae in the tissues of paratenic hosts (Resende et al., Reference Resende, Gazzinelli-Guimarães, Barbosa, Oliveira, Nogueira and Gazzinelli-Guimarães2015). The larvae migrate through the blood vessels to many organs of the body (Fan et al., Reference Fan, Holland, Loxton and Barghouth2015). Depending on the intensity of infection, the immune response status of the host, and the affected organs, the disease is classified into asymptomatic (covert or common toxocariasis), visceral, ocular and neurotoxocariasis (NT) (Resende et al., Reference Resende, Gazzinelli-Guimarães, Barbosa, Oliveira, Nogueira and Gazzinelli-Guimarães2015). NT is a chronic condition that may persist for several years and it has been linked to reduced cognitive functions (Walsh and Haseeb, Reference Walsh and Haseeb2012), neuropsychological disturbances, depression, behavioural changes and neurodegenerative diseases (Fan et al., Reference Fan, Holland, Loxton and Barghouth2015; Janecek et al., Reference Janecek, Waindok, Bankstahl and Strube2017).
Concerning the treatment of NT in particular, there are several problems. Firstly, there is no well-documented drug capable of killing Toxocara larvae (Kayes, Reference Kayes1997); and the available drugs such as thiabendazole, mebendazole, diethylcarbamazine and albendazole are with variable results (Othman, Reference Othman2012). However, albendazole is the most commonly used to treat NT owing to its good penetration into the central nervous system (CNS) (Nicoletti, Reference Nicoletti, Garcia, Tanowitz and Del Brutto2013). Secondly, despite the seriousness of NT, the decision to treat this disease may be challenging due to the allergic responses that may occur during or after treatment (Finsterer and Auer, Reference Finsterer and Auer2007). These allergic reactions may be more dangerous than the disease itself in sensitive organs such as the brain (Pawlowski, Reference Pawlowski2001). Accordingly, the treatment of NT with anthelmintics is usually done under a cover of an anti-inflammatory agent (Othman, Reference Othman2012). On the other hand, this concomitant administration of anti-inflammatory drugs during the antiparasitic treatment would decrease the larvicidal effect of the used drugs as the action of an anthelmintic is assisted by the inflammatory response (Othman, Reference Othman2012). Thirdly, the immunological privilege in brain tissue allows the larvae to keep surviving following an anthelmintic therapy (Lloyd, Reference Lloyd, Palmer, Soulsby and Simpson1998). Therefore, the immunological intervention using immunomodulators was thought to be an effective solution to overcome these obstacles during toxocariasis treatment (Kayes, Reference Kayes1997). Fortunately, some immunomodulators showed successful results when they were combined with anthelmintic drugs in animal models (Hrckova and Velebny, Reference Hrckova and Velebny2001).
Regarding the brain, this unique organ, astrocytes are the most plentiful cell type and they play a crucial role in maintaining the homoeostasis in the brain through regulating neuroinflammation and restricting brain-invading pathogens and parasites (Meyer and Kaspar, Reference Meyer and Kaspar2017; Chou and Fan, Reference Chou and Fan2018). Both astrocytes apoptosis (programmed cell death) and gliosis (formation of glial scars) are involved in the pathogenesis of neurodegenerative disorders and as a double-edged weapon; they are also involved in brain homoeostasis (Mengying et al., Reference Mengying, Yiyue, Tong, Yue, Limpanont, Ping, Okanurak, Yanqi, Dekumyoy, Hongli, Watthanakulpanich, Zhongdao, Zhi and Zhiyue2017). Apoptosis is a gene-regulated process that might occur in extrinsic or intrinsic pathways. The key players of both pathways are cysteine-containing, aspartate-specific proteases known as the family of caspases (Young et al., Reference Young, Roth, Klocke, West, Holtzman, Labruyere, Qin, Dikranian and Olney2005). However, in astrogliosis, glial fibrillary acidic protein (GFAP) gene activation and protein production play a central role (Yang and Wang, Reference Yang and Wang2015). This protein is uniquely found in astrocytes and its mRNA expression is regulated by several factors including transforming growth factor (TGF)-β which is increased during CNS infection and injury (Doyle et al., Reference Doyle, Cekanaviciute, Mamer and Buckwalter2010). Moreover, astrocytes express S100B protein which has a neuropathological influence on the CNS functions; thus, its expression is considered as an indicator for the degree of dystrophic neuritis (Kleindienst et al., Reference Kleindienst, Hesse, Bullock and Buchfelder2007).
Bearing in mind the complexity of brain homoeostasis during infection and the absence of an effective drug against NT, the search for a new therapy is now a necessity. One of the recently emerged therapeutic approaches for various diseases is cytotherapy or introducing new cells into the damaged tissues (Leu et al., Reference Leu, Lin, Yuen, Yen, Kao, Sun and Yip2010; Zhang et al., Reference Zhang, Jing, Rui, Xu and Wang2014). Among the numerous cell types, mesenchymal stem cells (MSCs) are the most commonly used in several animal models and few clinical trials of brain injuries and immune disorders (Wei et al., Reference Wei, Yang, Han, Qu, Shao and Shi2013). They gave promising results owing to their general characters as progenitor cells capable of self-renewal (Weiss and Troyer, Reference Weiss and Troyer2006), differentiation into specialized cells (Weger et al., Reference Weger, Diotel, Dorsemans, Dickmeis and Weger2017) and trans-differentiation through the acquisition of the identity of a different phenotype of other tissue (Lodi et al., Reference Lodi, Iannitti and Palmieri2011). Additionally, MSCs are immune-privileged cells that can interact with cells of the immune systems through the release of many trophic factors including TGF-β; therefore, they have powerful immunomodulatory effects (Caplan, Reference Caplan2009; Wei et al., Reference Wei, Yang, Han, Qu, Shao and Shi2013).
In light of the above, this study aims to investigate for the first time the outcome of MSC therapy alone or combined with albendazole on brain damage induced by chronic T. canis infection in an experimental mouse model. The assessment was done through studying histopathological changes, immunohistochemical expression of caspase-3 and TGF-β, mRNA gene expression of S100B and GFAP by real-time polymerase chain reaction (PCR), and measurement of T. canis DNA by real-time PCR.
Materials and methods
Experimental animals
Pathogen-free Swiss albino mice, 6–8 weeks of age and weighing an average of 20 ± 2 g were used in this study. Mice were kept in the animal house at the Faculty of Medicine, Menoufia University under controlled temperature and humidity conditions (25 ± 2°C, 70%), with free access to standard food and water. The study was approved by the Scientific Research Ethical Committee, Faculty of Medicine, Menoufia University and all procedures involving animals complied with the international ethical guides on the care of laboratory animals.
Parasite and infection
Toxocara canis adult worms were obtained from the small intestine of naturally infected dogs aged 2–3 months as described by Fan et al. (Reference Fan, Lin, Du and Su2003). Briefly, the adult worms were collected in Petri-dishes containing physiological saline (0.9% NaCl). The mature female worms were isolated, the distal parts of the worms were dissected, the uteri were removed and cut then the eggs were collected. The eggs were allowed to embryonate by incubation in 0.5% formol-saline solution (99.5 mL of physiological saline and 0.5 mL of formaldehyde 40%) at 28–30°C for 4–8 weeks.
Albendazole
Albendazole (Sigma, USA) was given at a dose of 100 mg kg−1 day−1 once orally for 5 successive days according to Yarsan et al. (Reference Yarsan, Altinsaat, Aycicek, Sahindokuyucu and Kalkan2003), commencing 6 weeks after infection in the form of an aqueous suspension in 0.1 mL of distilled water.
Mesenchymal stem cells
Preparation and isolation of MSCs from mice compact bones was done according to the protocol of Zhu et al. (Reference Zhu, Guo, Jiang, Li, Wang, Yao and Mao2010). Briefly, Dulbecco's modified Eagle's medium (DMEM) (GIBCO, USA) was supplemented with fetal bovine serum (FBS) 10% (v/v), 100 U mL−1 penicillin and 100 μg mL−1 streptomycin [1:100 dilution of penicillin/streptomycin (100×) stock solution] (Sigma, USA). Then 10 albino mice of average 2–3 weeks old were sacrificed by cervical dislocation. Each mouse was rinsed with 100 mL of 70% (v/v) ethanol for 3 min in a beaker. The skin of the inguinal region was incised, the muscles were disassociated, the femur was cut then the muscles and tendons were removed. The collected bones were placed on sterile gauze and rubbed to remove the attached soft tissues from the bones. The bones were placed in a sterile Petri-dish with 5 mL of DMEM medium supplemented with 0.1% (v/v) penicillin/streptomycin solution and 2% FBS (v/v). The epiphyses just below the end of the bone marrow cavity were removed to deplete haematopoietic cells from the tibiae and femurs. A syringe needle was inserted into the bone cavity and the bone marrow was flushed out with 3 mL of DMEM medium for three times until the bones became pale. The bones were excised carefully into chips of approximately 1–3 mm3 which were transferred into a plastic culture flask containing 3 mL of DMEM with 10% (v/v) FBS in 1 mg mL−1 (w/v) of collagenase II (GIBCO, USA) for 1–2 h at 37°C in a shaking incubator. The bone chips were washed three times before being cultured in 6 mL of DMEM supplemented with 10% (v/v) of FBS at 37°C in a 5% CO2 incubator. After 5 days in culture, the adherent cells were harvested by removing the medium and adding 3 mL of 0.25% (w/v) trypsin with 0.02% (w/v) of EDTA. Immunophenotyping and characterization of the harvested cells was done by staining with fluorescein isothiocyanate-conjugated anti-mouse Sca-1, CD11b and CD45 antibodies. Finally, MSCs were labelled with 50 μ m of ferumoxide (iron oxide) nanoparticles (Sigma, USA) in 4 mL RPMI medium for 30 min followed by centrifugation at 2000 × g for 10 min.
Experimental design
Fifty-five mice were used in this study, 10 healthy non-infected mice were assigned to the control group (GI) and 40 mice were infected with T. canis, each mouse was inoculated orally with a single dose of 1000 embryonated T. canis eggs (Othman et al., Reference Othman, Abdel-Aleem, Saied, Mayah and Elatrash2010). The infected mice were divided into the following four groups of 10 mice each (n = 10): GII was the infected non-treated group (infected control), GIII was treated with MSCs only at a dose of 3 × 10⁶ MSCs in 0.1 mL of phosphate-buffered saline (PBS) via the tail vein of each mouse (Jasmin et al., Reference Jasmin Jelicks, Koba, Tanowitz, Mendez-Otero, de Carvalho and Spray2012), GIV was treated with albendazole at a dose of 100 mg kg−1 day−1 once orally with olive oil for 5 successive days (Yarsan et al., Reference Yarsan, Altinsaat, Aycicek, Sahindokuyucu and Kalkan2003) and GV was treated with albendazole combined with MSCs. Treatment was commenced 6 weeks post-infection, and the experiment was terminated 4 weeks later. An additional group of healthy mice (n = 5) was served as a stem cell homing control group which received the same dose of MSCs and they were sacrificed according to the previous schedule.
Sampling
Each mouse was sacrificed by cervical dislocation; the brain was removed, washed with a physiologic solution and divided into three parts. One part was fixed in 10% buffered formalin for histopathological and immunohistochemical studies. Another part was immediately stored at −80°C until DNA extraction and detection of T. canis DNA by real-time PCR. The third (25 mg) part was homogenized in the presence of a highly denaturing Trizol reagent (600 μL), ethanol was added and the sample was transferred to the Zymo-Spin IIC column to obtain high-quality RNA eluted in 30–50 μL RNase-free water which was stored at −80°C until reverse transcription polymerase chain reaction (RT-PCR) was done to assess gene expression of S100B and GFAP.
Homing of MSCs in brain tissues
The Prussian blue staining method was performed to detect the iron oxide-labelled MSCs in brain tissues of stem cell-treated groups. According to Frank et al. (Reference Frank, Miller, Arbab, Zywicke, Jordan, Lewis and Bulte2003), brain sections were deparaffinized, incubated with 2% potassium ferrocyanide (Perl's reagent) (Sigma, USA) in 3.7% HCl for 30 min at 60°C then the sections were washed and counter-stained with nuclear fast red.
Histopathological study
The brain tissue of each mouse was fixed in 10% buffered formalin, processed to paraffin blocks and sections (5 μ m thick) were prepared and stained with haematoxylin and eosin (H&E) (Carleton et al., Reference Carleton, Drury and Wallington1980). The sections were examined under a light microscope (Olympus BX41, model BX 41 TF, Japan) provided with a digital camera (Olympus Imaging Crop, model no. E420DC7, 4V).
Immunohistochemical study
For each mouse, serial sections (4 μ m thick) were prepared for immunostaining with rabbit polyclonal caspase-3 antibody (CPP4, Thermo Fisher Scientific, CA, USA) and purified mouse TGF-β monoclonal antibody (ab27969, Abcam, UK). The process of immunostaining was done according to the manufacturer's instructions. Negative control slides were prepared by omitting the primary antibody from the staining procedure. While tissue sections prepared from tonsil and breast carcinoma were used as a positive control for caspase-3 and TGF-β, respectively.
Determination of gene expression of S100B and GFAP by real-time RT-PCR
RT-PCR was performed using the Quanti-Tect Reverse Transcription Kit (Qiagen, USA). About 10 μL of the extracted total RNA was added to the reverse-transcription master mix containing all the components required for first-strand complementary DNA (cDNA) synthesis in a 20-μL reaction mixture. The resulting cDNA was amplified using the Quanti-Tect SYBR Green PCR Kit (Applied Biosystems, USA). The reverse-transcription reactions were stored at −20°C for further PCR amplification. To determine gene expression of S100B and GFAP (biomarkers of brain damage), forward and reverse primers of each gene were used according to Liao et al. (Reference Liao, Fan, Kao, Ji, Su, Lin and Cho2008). The primers of S100B were sense-GACTCCAGCAGCAAAGGTGAC and antisense-CATCTTCGTCCAGCGTCTCCA while the primers of GFAP were sense-GAATGGCCACTAAGGCAGTC and antisens-TGCACTCCCTCTCTCCTGTT. Additionally, GAPDH (sense-ACCACAGTCCATGCCATCAC and antisense-TCCACCACCCTGTTGCTGTA) gene expression was tested as an endogenous reference control. Each primer was reconstituted by the addition of the labelled amount of tris-EDTA (TE) buffer solution. For each reaction, 12.5 μL of Quanti-Tect SYBR Green PCR master mix, 5 μL of cDNA, 1 μL of each primer and 5.5 μL of RNase-free water were mixed in a total reaction volume of 25 μL. The real-time cycler was programmed for initial activation of PCR reaction at 95°C for 15 min followed by 45 cycles of three steps cycling. Each cycle comprised denaturation at 94°C for 15 s, annealing at 60°C for 30 s and extension at 72°C for 34 s. Melting curve analysis of the PCR products was performed to verify their specificity and identity using 7500 software version 2.0.1 (Applied Biosystems, USA) incorporated in the real-time cycler.
Real-time PCR for detection of T. canis larva DNA in brain tissue
Genomic DNA was extracted from frozen brain tissue using the JET™ Genomic DNA purification mini kit (Thermo Scientific, Lithuania). PCR for the T. canis gene was carried out using the sense primer Tcan1 (5-AGTATGATGGGCGCGCCAAT-3), and the antisense primer NC2 (5-TTAGTTTCTTTTCCTCCGCT-3) of T. canis ITS-2 region (Jacobs et al., Reference Jacobs, Zhu, Gasser and Chilton1997). The reaction mix volume of 25 μL was prepared by mixing 12.5 μL of SYBR green master mix, 1 μL of each primer (final concentration 0.5 μ m), 5.5 μL of nuclease-free water and 5 μL (0.1 μg μL−1) of DNA extract for each reaction or DNA was replaced with 5 μL of nuclease-free water for the negative control reactions. The cycling parameters were set as follows: an initial denaturation step at 98°C for 2 min, one cycle of denaturation at 98°C for 5 min, then 40 cycles of a denaturing step at 94°C for 45 s, annealing/extension at 64°C for 45 s and final extension at 72°C for 10 min. Thermal cycling was run in 96-well plates in the 7500 Real-Time PCR system (Applied Biosystems, USA). Standard curves were created with T. canis eggs DNA extract in serial concentrations as the positive control. Data were analysed by using Applied Biosystems’ 7500 software version 2.0.1.
Statistical analysis
The data were collected, tabulated, analysed by using SPSS (statistical package for social science, version 22.0 on IBM compatible computer), and expressed as mean ± s.d. To investigate the significance of the quantitative data, one-way analysis of variance (ANOVA) or Kruskal–Wallis tests were used. Each test was followed by a post-hoc test to determine the significance between groups. Pearson's correlation coefficient was applied to examine the strength and direction of the relationship between two variables. Chi-square test was used to study the significance of the qualitative data. The results with P ⩽ 0.05 were considered significant.
Results
Homing of MSCs in brain tissues
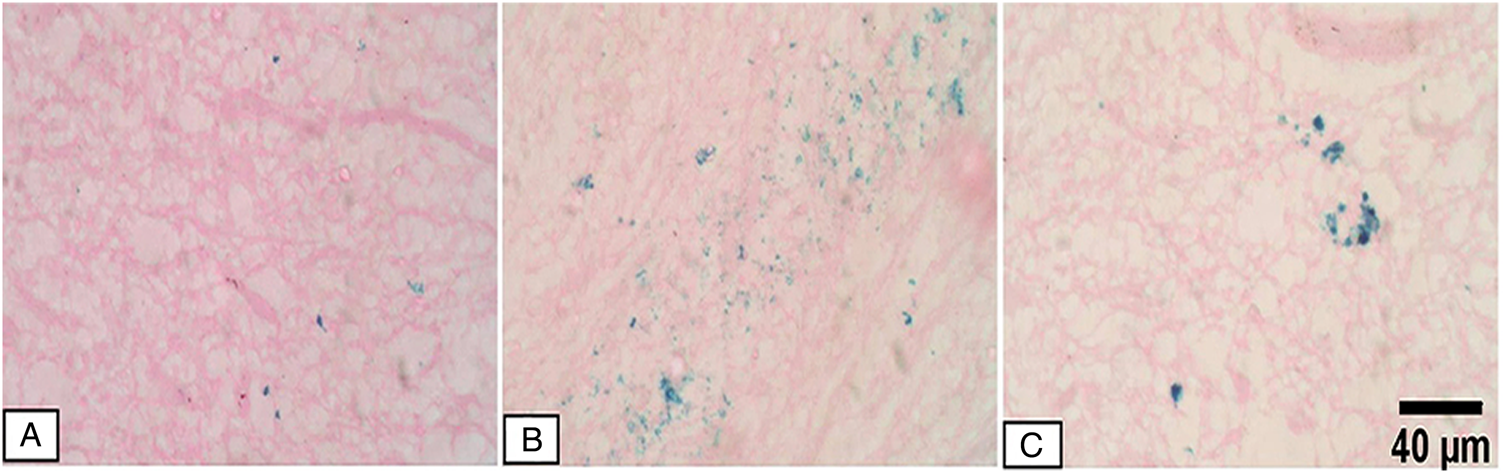
In the current study, there was an obvious homing of MSCs in the brain tissues of the infected mice when compared to the normal control mice receiving MSCs only (Fig. 1).
Detection of iron oxide-labelled MSCs in mice brain tissues by Prussian blue stain: (A) brain tissue of a normal mouse received MSCs at a dose of 3 × 10⁶ MSCs in 0.1 mL of PBS via the tail vein (MSC-control group) showing few blue spots which indicate the presence of iron oxide-labelled MSC cells. (B) Brain tissue of a mouse from GV (MSCs/ALB-treated) showing numerous blue spots indicating homing of stem cells into the infected tissue with T. canis larvae. (C) Brain tissue of a mouse from GV (SC/ALB-treated) showing clusters of blue spots (MSCs).

Histopathological study
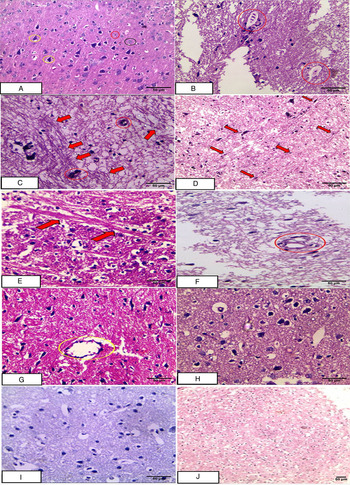
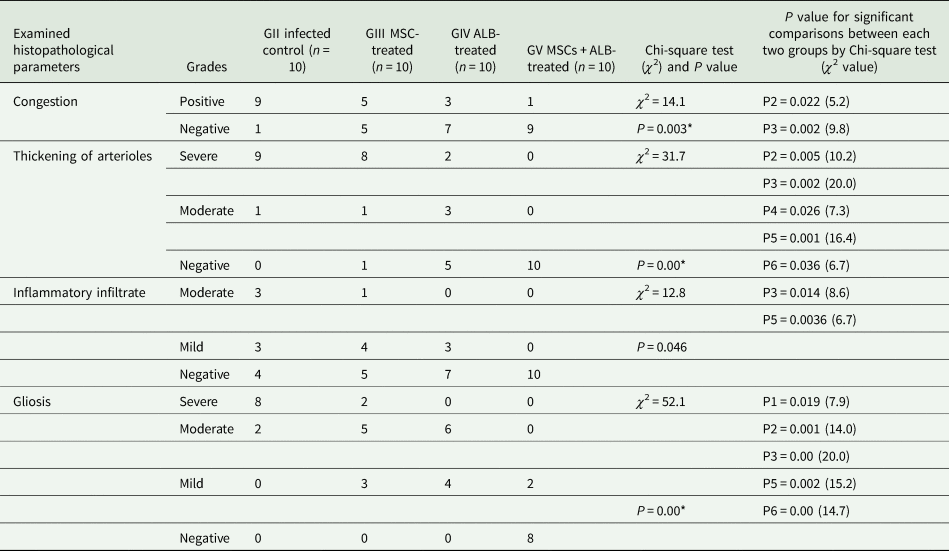
The positive control group (GII) showed the highest percentages of congestion, thickening of arterioles, inflammatory infiltrate and gliosis. Additionally, numerous T. canis larvae were also seen (Fig. 2B–D). Stem cell therapy (GIII) (Fig. 2E and F) resulted in a slight improvement of the pathological changes while albendazole (GIV) (Fig. 2G and H) resulted in more obvious improvements. However, the best results were obtained with MSC therapy combined with albendazole (GV) (Fig. 2I and J) (see Table 1).
H&E-stained brain sections from different studied mice groups: (A) normal control group (GI) showing normal brain tissue with normal pyramidal cells (yellow circle), neuroglia (black circle) and granule cells (red circle). (B) The infected control group (GII) showing T. canis larvae (red circles) surrounded with mononuclear inflammatory infiltrate. (C) The infected control group (GII) showing thick-walled blood vessels (red circles) together with long-standing severe fibrillary gliosis (red arrows). (D) The infected control group (GII) showing diffuse activation of microglial cells (red arrows) and moderate gliosis. (E, F) Brain tissues from GIII (MSC-treated) showing long-standing fibrillary gliosis (red arrows) together with moderate thickening of an arteriole (red circle). (G, H) Brain tissues from GIV (ALB-treated) showing mild to moderate fibrillary gliosis, moderate thickening of an arteriole (yellow circle) and areas of astrocytosis (H). (I, J) Brain tissues from GV (MSCs/ALB-treated) group showing restoration of the normal architecture of brain tissues.

Histopathological changes among the studied groups

*P is the P value for the comparison between all groups; P1 is the P value for the comparison between GII and GIII by the Chi-square test, P2 for GII vs GIV; P3 for GII vs GV; P4 for GIII vs GIV; P5 for GIII vs GV and P6 for GIV vs GV.
Immunohistochemical study
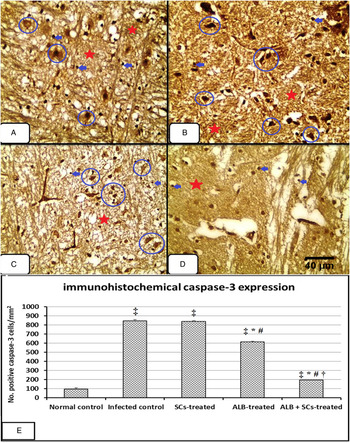
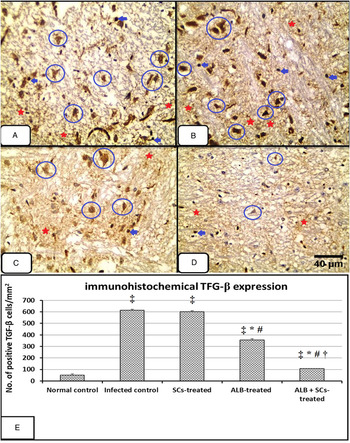
The highest scores (no. of positive cells per mm2 of brain tissues) of the immunohistochemical expression of caspase-3 (Fig. 3) and TGF-β (Fig. 4) were recorded in the infected control group (GII) (845.5 ± 14.3 and 613.5 ± 9.7, respectively). Their expressions were still significantly high with MSC therapy (GIII) (837.6 ± 13.1 and 600.4 ± 8.3, respectively). Albendazole (GIV) induced significant reductions of both markers (612.7 ± 8.5 and 356.1 ± 10.03, respectively). The lowest significant values (194.8 ± 10.1 and 106.6 ± 9.5, respectively) were reported with the combined treatment (GV).
Immunohistochemical caspase-3 expression in mice brain tissues: (A) GII (+ve control) showing strong diffuse nucleo-cytoplasmic expression of caspase-3 in the pyramidal cells (blue circle), glial cells (blue arrow) and the neuropil (red asterisk). (B) GIII (MSC-treated) showing less improvement in caspase-3 expression. (C) GIV (ALB-treated) showing moderate nucleo-cytoplasmic expression of caspase-3. (D) GV (MSCs/ALB-treated) showing patchy mild nucleo-cytoplasmic expression of caspase-3 in the neuronal cells and the neuropil (caspase-3 immunoperoxidase stain). (E) The number of positive caspase-3 cells per mm2. Data are expressed as mean ± s.d. (n = 10). ‡ indicates significance (P < 0.05) of the value vs GI (normal control), * indicates significance vs GII (infected control), # indicates significance vs GIII (stem cell-treated) and † indicates significance vs GIV (ALB-treated) by Kruskal–Wallis (k = 33.4; P = 0.00) followed by a post-hoc test.

Immunohistochemical TGF-β expression in mice brain tissues (red arrows): (A) GII (+ve control) showing strong cytoplasmic expression of TGF-β in the pyramidal cells (blue circle), glial cells (blue arrow) and the neuropil (red asterisk). (B) GIII (MSC-treated) showing no improvement in TGF-β expression. (C) GIV (ALB-treated) showing moderate cytoplasmic expression of TGF-β. (D) GV (MSCs/ALB-treated) showing patchy mild cytoplasmic expression of TGF-β in the neuronal cells (TGF-β immunoperoxidase stain). (E) The number of positive TGF-β cells per mm2. Data are expressed as mean ± s.d. (n = 10). ‡ indicates significance (P < 0.05) of the value vs GI (normal control), * indicates significance vs GII (infected control), # indicates significance vs GIII (stem cell-treated) and † indicates significance vs GIV (ALB-treated) by one way ANOVA (F = 6584.6; P = 0.00) followed by a post-hoc test.

RT-PCR gene expression of S100B and GFAP
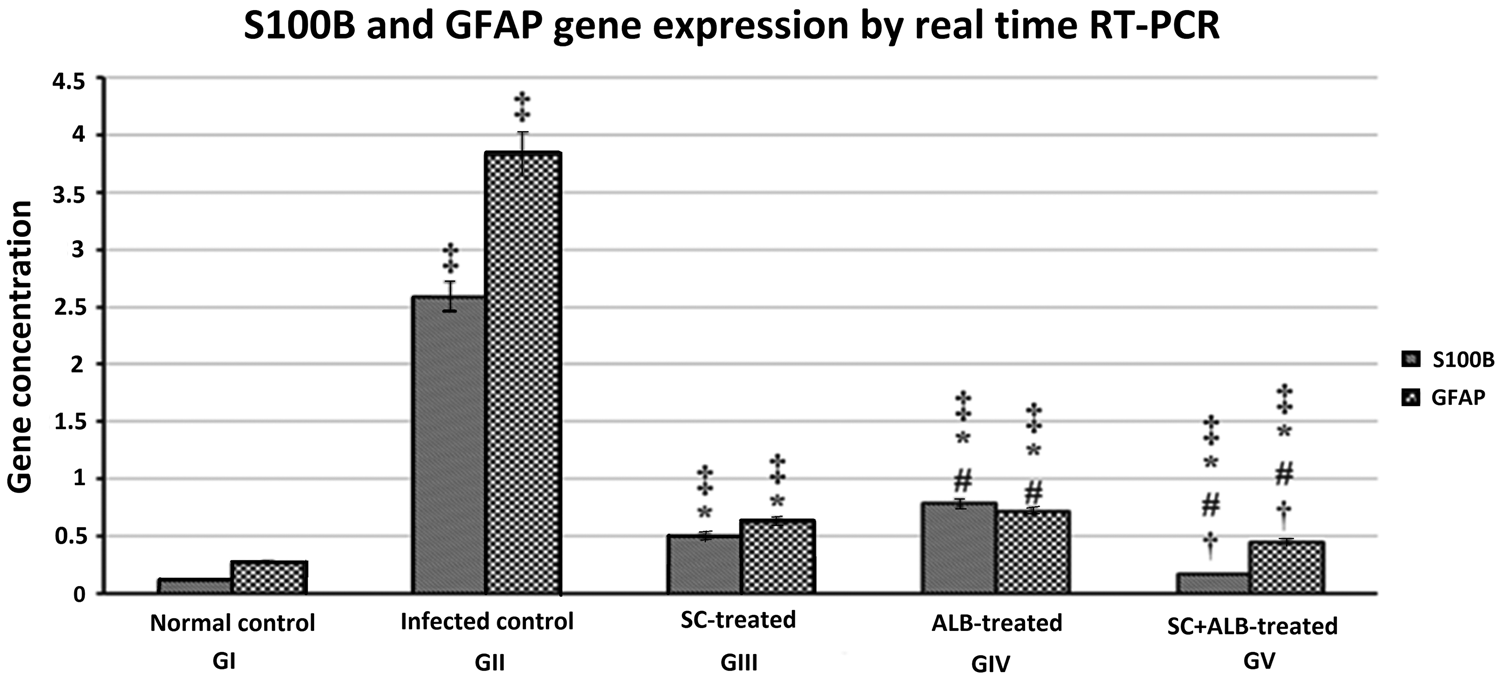
All the treated groups showed significant reductions in gene expressions of S100B and GFAP when they were compared to the infected control (GII) (2.59 ± 0.168 and 3.83 ± 0.045, respectively). The lowest significant values were reported with the combined treatment (GV) (0.171 ± 0.005 and 0.448 ± 0.004, respectively); however, the reduction did not reach the normal values the normal control group (GI) (0.120 ± 0.012 and 0.270 ± 0.005, respectively) (Fig. 5).
S100B and GFAP gene expression in mice brain tissues from different studied groups: data are expressed as mean ± s.d. (n = 10). ‡ indicates significance (P < 0.05) of the value vs GI (normal control), * indicates significance vs GII (infected control), # indicates significance vs GIII (stem cell-treated) and † indicates significance vs GIV (albendazole-treated) by Kruskal-Wallis test followed by a post-hoc test.

Detection of T. canis larva DNA in brain tissue by real-time PCR
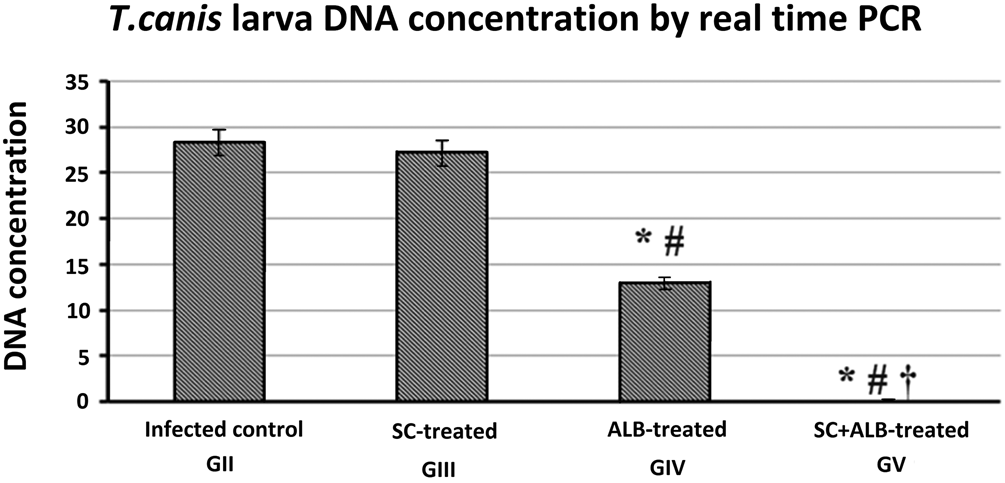
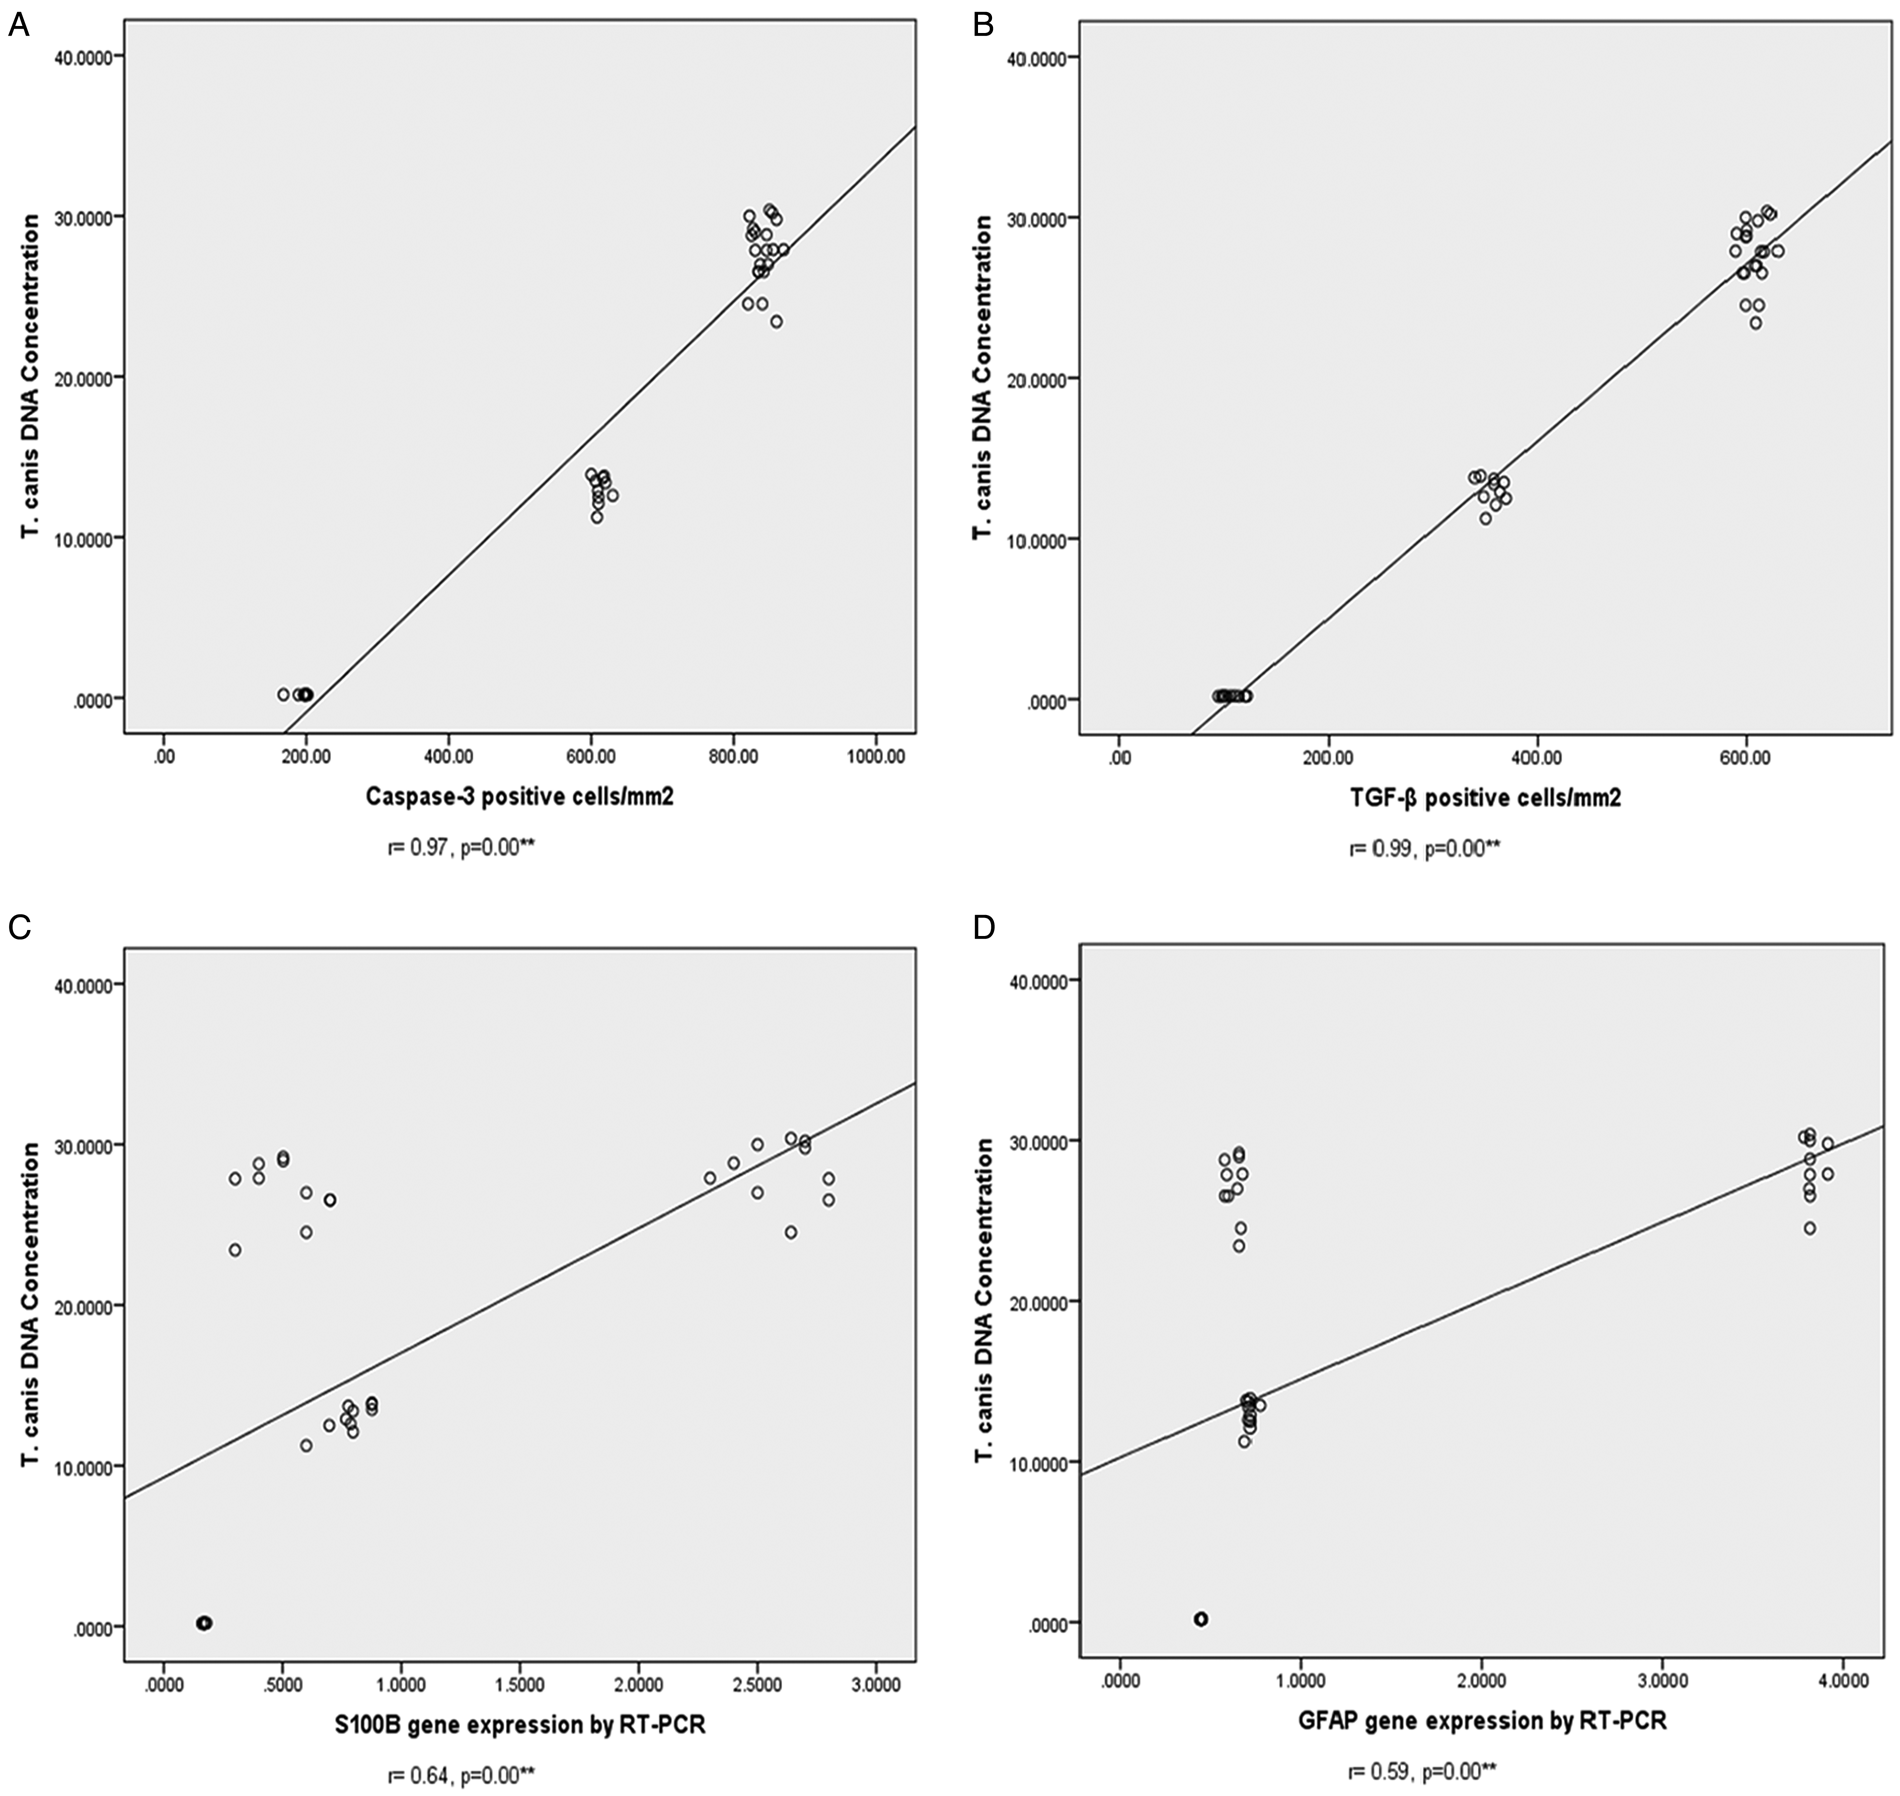
Albendazole-treated group (GIV) showed a significant reduction of T. canis DNA concentration (12.9 ± 0.86) in comparison with the infected control (GII) (28.3 ± 1.91) and MSC-treated (GIII) (27.1 ± 1.9) groups. The most significant reduction was reported with the combined treatment (GV) (0.190 ± 0.011) (Fig. 6). Interestingly, there were strong positive correlations between the amounts of T. canis larva DNA and caspase-3, TGF-β, S100B and GFAP expression in brain tissues of the different studied groups (Fig. 7).
Toxocara canis larva DNA concentrations in mice brain tissues from different studied groups: data are expressed as mean ± s.d. (n = 10). * indicates significance (P < 0.05) of the value vs GII (infected control), # indicates significance vs GIII (SC-treated) and † indicates significance vs GIV (ALB-treated) by one way ANOVA (F = 878.1; P = 0.000) followed by a post-hoc test.

Pearson's correlation coefficient between T. canis DNA concentrations and the studied cytokines and brain injury biomarkers in mice brain tissues.

Discussion
This study demonstrates for the first time the therapeutic effects of MSCs combined with albendazole on NT in a mouse model. In the current study, the histopathological examination of the infected control group (GII) revealed the highest percentages of congestion, thickening of arterioles, moderate inflammatory infiltrate and severe gliosis. These results were in accordance with Oryan et al. (Reference Oryan, Sadjjadi and Azizi2010) who reported similar pathological changes in chicken infected with T. cati. Also, Janecek et al. (Reference Janecek, Beineke, Schnieder and Strube2014) reported similar structural brain damage in the cerebrum of T. canis-infected mice with the presence of activated microglia and focal accumulation of phagocytic cells. Similarly, Othman et al. (Reference Othman, Abdel-Aleem, Saied, Mayah and Elatrash2010) reported many T. canis larvae scattered in brain tissues of the infected group inducing vascular congestion but without inflammatory infiltrate.
Regarding the inflammatory infiltrate, in human cases, Finsterer and Auer (Reference Finsterer and Auer2007) found that T. canis infection may induce cerebral vasculitis and occlusion of multiple small branches of the middle cerebral artery which may develop even during anthelminthic therapy. They assumed that these ischaemic lesions occur because of chronic inflammation, production of anti-cardiolipin antibodies and the release of eosinophilic cationic protein (Oujamaa et al., Reference Oujamaa, Sibon, Vital and Menegon2003; de Boysson et al., Reference de Boysson, Silva, Comoz, Boutemy and Bienvenu2015). Moreover, Deshayes et al. (Reference Deshayes, Bonhomme and de La Blanchardière2016) reported active inflammatory lesions, areas of vasculitis and obstructive hydrocephalus in the magnetic resonance images of human NT and biopsies of these lesions revealed eosinophilic granulomas.
In contrary to our study, Liao et al. (Reference Liao, Fan, Kao, Ji, Su, Lin and Cho2008) and Eid et al. (Reference Eid, El-Kowrany, Othman, El Gendy and Saied2015) found no inflammatory infiltration or evident pathological changes in brain sections of experimentally infected immunosuppressed mice with T. canis despite the presence of numerous larvae in the brain. They attributed their results for the immune evasion of T. canis larvae or as a protective measure operated by the brain tissues to reduce inflammation. Also, the results obtained by Othman et al. (Reference Othman, Abdel-Aleem, Saied, Mayah and Elatrash2010) in their study on male Swiss albino mice did not reveal any visible inflammatory reactions around the migrating larvae despite the increased expression of interleukin-6, tumour necrosis factor-alpha and inducible nitric oxide synthase. These contradictory findings could be explained as Liao et al. (Reference Liao, Fan, Kao, Ji, Su, Lin and Cho2008) conducted their study on female ICR mouse strain while in the current study we used female BALBc mice. This apparent influence of strain and gender on the pathogenesis of experimental toxocariasis has been documented by Abo-Shehada and Herbert (Reference Abo-Shehada and Herbert1989) who assumed that the differences between mice strains might depend on the capability of the larvae to penetrate the intestine and the gender-related difference was because of an effective cell-mediated immune response in male mice that appeared to be regulated by male sex hormones.
The results of the current work revealed significant increases of caspase-3, TGF-β, S100B and GFAP in the infected control group (GII). These increases were strongly correlated with the amount of T. canis larvae DNA in brain tissues detected by real-time PCR which we used instead of the larval count method as it was found more sensitive and able to detect less than one larva per sample (25 mg) (Borecka et al., Reference Borecka, Gawor, Niedworok and Sordyl2008).
In the current study, the highest score of caspase-3 expression in the infected control group (GII) is in agreement with Chou and Fan (Reference Chou and Fan2018) who reported that the exposure of astrocyte to Toxocara excretory-secretory antigen (TES-Ag) caused astrocyte apoptosis associated with accelerated caspase-3 cleavage and activity. They explained this induction of apoptosis as a strategy of the larvae to evade the immune response. The highest score of TGF-β immunohistochemical expression in the infected control group could be explained as TGF-β is the most potent pro-fibrogenic growth factor (Piera-Velazquez et al., Reference Piera-Velazquez, Mendoza and Jimenez2016) which is involved in the regulation of the brain's response to inflammation and injury. Therefore, the increased levels of TGF-β1 have been correlated with the deposition of scar materials and gliosis in brain tissues after traumatic, severe hypoxic-ischaemic injuries (Kleindienst et al., Reference Kleindienst, Hesse, Bullock and Buchfelder2007), experimental cerebral toxocariasis (Liao et al., Reference Liao, Fan, Kao, Ji, Su, Lin and Cho2008) and cerebral toxoplasmosis (Cekanaviciute et al., Reference Cekanaviciute, Dietrich, Axtell, Williams, Egusquiza, Wai, Koshy and Buckwalter2014). In the same context, GFAP mRNA expression which is the key sign of brain damage and reactive astrocytosis (Liberto et al., Reference Liberto, Albrecht, Herx, Yong and Levison2004; Othman et al., Reference Othman, Abdel-Aleem, Saied, Mayah and Elatrash2010) was enhanced in the current work. This increase in GFAP expression seems to be TGF-β dependent as in a previous experimental study on cerebral toxocariasis, the astrocytes treated with TGF-β1 showed a rapid and dose-dependent increase in GFAP mRNA expression (de Sampaio et al., Reference de Sampaio, Spohr, Martinez, da Silva, Neto and Gomes2002). The results of our study are in accordance with Liao et al. (Reference Liao, Fan, Kao, Ji, Su, Lin and Cho2008) who reported cerebral injury and increased levels of GFAP and S100B in experimental NT. They stated that the increased GFAP expression may be a response to protect the brain from damage during toxocariasis through the massive production of GFAP by the reactive astrocytes to form a glial scar. This glial scar might act as a physical barrier between the injured and the normal cells which consequently paves the way to restore an intact blood–brain barrier (Röhl et al., Reference Röhl, Lucius and Sievers2007). Moreover, the significant increase in S100B in the infected control group is in harmony with Kleindienst et al. (Reference Kleindienst, Hesse, Bullock and Buchfelder2007) who stated that this biomarker expression draws a parallel with the density of dystrophic neuritis and the axonal injury.
Regarding albendazole treatment, our results revealed improvements in the pathological alterations without restoration of the normal tissue architecture. This result was in agreement with Finsterer and Auer (Reference Finsterer and Auer2007) who reported an improvement of the clinical neurologic signs, but the lesions found on imaging studies only decreased in size or number and did not disappear after the antihelminthic drug therapy for NT. In the current study, we started treatment at the 6th week post-infection instead of the first day of infection similar to most experimental studies to reflect the actual situation during the treatment of human toxocariasis as drug therapy is usually initiated during the symptomatic chronic stage (Othman, Reference Othman2012). Albendazole treatment in our study reduced T. canis DNA significantly; however, it could not eliminate the parasitic DNA. This reduction was correlated with significant reductions of caspase-3, TGF-β, S100B and GFAP expressions, but without restoration of the normal values. These findings are consistent with a previous study conducted by Velebny et al. (Reference Velebny, Tomasovicova, Hrckova and Dubinsky1997) in which the efficacy of albendazole given at 28th day post-infection was 38.3%. They attributed their result to the immunosuppressive and immunomodulatory actions of TE-antigens which ensure the protection of the migrating larvae from the effective immune response of the host.
In the current study, we observed homing of MSCs to the brain tissues of the infected mice. The migration of MSCs to the damaged tissue has been reported previously in different models (Kraitchman et al., Reference Kraitchman, Tatsumi, Gilson, Ishimori, Kedziorek, Walczak and Young2005). The precise mechanisms involved in their migration to the areas of inflammation are still unknown; however, a process similar to that of leucocyte migration is supposed to occur with the involvement of chemokines and adhesion molecules (De Becker et al., Reference De Becker, Van Hummelen, Bakkus, Broek, De Wever, De Waele and Van Riet2007). Also, MSCs reside in specialized niches in perivascular areas which allow their complete access to the tissues (Caplan, Reference Caplan2009). This obvious homing of MSC into the infected brain tissues and their nature as immune modulators could explain the results obtained in the current study.
In the literature, there are several studies reported improvement of the pathological lesions associated with various diseases after MSC therapy either alone or combined with drugs. For instance, MSCs reduced inflammation, fibrosis, granuloma diameter and inhibited collagen deposition in the liver tissues of infected mice with Schistosoma japonicum (Xu et al., Reference Xu, Qian, Zhu, Zhang, Yan, Zhang, Mao, Wang, Xu and Xu2012; Zhang et al., Reference Zhang, Jing, Rui, Xu and Wang2014) and Schistosoma mansoni (Hammam et al., Reference Hammam, Elkhafif, Attia, Mansour, Elmazar, Abdelsalam, Kenawy, Aiman and El-Khatib2016). The repeated injections of granulocyte colony-stimulating factor (a factor that stimulates stem cell mobilization from bone marrow) had decreased inflammation and fibrosis in the heart tissues of infected mice with Trypanosoma cruzi (Macambira et al., Reference Macambira, Vasconcelos, Costa, Klein, Lima, Guimarães and Soares2009), and MSCs reversed the right ventricular dilatation in T. cruzi-infected mice (Jasmin et al., Reference Jasmin Jelicks, Koba, Tanowitz, Mendez-Otero, de Carvalho and Spray2012). Also, the transplanted MSCs into naïve mice increased the host resistance against malaria (Thakur et al., Reference Thakur, Tousif, Awasthi, Sanyal, Atul, Punia and Das2013). Additionally, Leu et al. (Reference Leu, Lin, Yuen, Yen, Kao, Sun and Yip2010) reported a marked reduction of brain infarct size, enhancement of angiogenesis and neurogenesis with an attenuation of the inflammatory reaction and apoptosis and improvement of neurological functions after MSC therapy in a rat model of cerebral infarction.
The results of the current study revealed slight improvements of the pathological changes associated with high caspase-3 and TGF-β expressions with MSCs in GIII while the combined treatment resulted in the lowest significant expressions with almost restoration of the normal tissue architecture. In contrary to our results, Leu et al. (Reference Leu, Lin, Yuen, Yen, Kao, Sun and Yip2010) reported that MSCs had markedly decreased caspase-3 expression in the infarction area in an experimental model. This discrepancy could be attached to the difference between the pathogenesis of stroke and the infection-induced injury. Herein, T. canis DNA concentration in MSC-treated group (GIII) was still high; therefore, we assume that TES-Ag continued to trigger astrocyte apoptosis and other pathological changes. Interestingly, in GIII, there were significant decreases in mRNA expression of S100B and GFAP compared to the albendazole-treated group (GIV) though the latter group showed a more significant reduction of the detected T. canis DNA. These results might be attributed to the neuroprotective mechanisms of MSCs because of their ability to secrete a broad range of regulatory factors for several processes such as neurogenesis, apoptosis and glial scar formation, immunomodulation, angiogenesis and neuronal cell survival (Teixeira et al., Reference Teixeira, Carvalho, Sousa and Salgado2013).
In conclusion, this study showed significant improvements in the pathological changes such as congestion, thickening of arterioles and inflammatory infiltrate in brain tissues of infected mice with T. canis after treatment with albendazole combined with MSCs. These findings correlate with the most significant reduction of T. canis larva DNA concentration in brain tissues. Moreover, in this group, the almost eradication of the migrating larvae and the anti-apoptotic effect of MSCs resulted in a significant reduction of caspase-3 expression and TGF-β. As astrogliosis and GFAP expression in experimental NT are TGF-β dependent, the significant reduction of TGF-β in the current study resulted in significant reductions of gliosis, GFAP and S100B mRNA gene expressions. These results could be referred to an additive action between the immunomodulatory, angiogenesis stimulating properties of MSCs and the antiparasitic effect of albendazole. However, besides the promising successes of stem cells as new therapies for many diseases, further studies are still required to evaluate and validate MSCs as a new adjuvant line to treat NT and other cerebral parasitic diseases in particular.
Acknowledgements
We would like to thank Prof Hala Gabr Metwaly (Clinical Pathology Department, Faculty of Medicine, Cairo University) for preparation and providing MSCs; Prof Eman Abd El-Fattah Badr (Medical Biochemistry Department, Faculty of Medicine, Menoufia University) for performing molecular studies; Prof Eman Ahmady (Clinical Pathology Department, Faculty of Medicine, Menoufia University) for examination of Prussian blue-stained slides and Prof Dalia Refaat Al-Sharaky (Pathology Department, Faculty of Medicine, Menoufia University) for histopathological and immunohistochemical studies.
Financial support
This research did not receive any specific grant from funding agencies in the public, commercial or not-for-profit sectors.
Conflict of interest
None.
Ethical standards
The authors assert that all animal procedures contributing to this work comply with the international ethical guides on the care of laboratory animals and the study was performed after being approved by the Scientific Research Ethical Committee, Faculty of Medicine, Menoufia University.