Ever since British abolitionists first highlighted the issue in the 1780s, the mortality of enslaved Africans in the middle passage from Africa to America has been a preoccupation of scholars studying the Atlantic slave trade. Following Philip Curtin's pioneering work on the epidemiology of the slave trade in the late 1960s, discoveries of new shipping data have allowed major strides to be made in tracking long-run trends in slave mortality.1
See, for example, Klein, Middle Passage; Cohn and Jensen, “Determinants”; Eltis, “Voyage Length”; Cohn, “Deaths of Slaves”; Steckel and Jensen, “New Evidence”; Klein and Engerman, “Slave Mortality”; and Klein, Engerman, Haines et al., “Transoceanic Mortality.”
Klein and Engerman, “Slave Mortality.”
Haines and Shlomowitz, “Explaining.”
Slave mortality has been pivotal to discussions of the “middle passage” from Africa to the Americas. Historians typically define it as starting when ships left the coast. For each slave, however, it actually began as soon as he or she boarded ship. This might be weeks, if not months, before the ship began its voyage to the Americas. Moreover, a considerable number of enslaved Africans died before the Atlantic crossing. Understanding how shippers adapted their purchasing strategies to the risks of slave mortality in transit, and how this affected survival rates, requires redefining the middle passage to embrace the whole time spent by slaves on board ship. In other words, we have to shift attention from the merchant's point of view to the slave experience. Only then will we be able further to advance understanding of slave mortality or survival in transit and the factors that helped to shape them.
The article focuses on day-to-day slave purchasing strategies pursued by masters of 39 Dutch voyages to “Guinea” (or West Africa) for slaves in 1751–1797, when the slave trade in general and the Dutch slave trade in particular were at their height. It also examines day-to-day slave mortality between the first purchase and final sale of slaves for the same voyages and the factors associated with them.
SOURCES AND METHODOLOGY
The Middelburgsche Commercie Compagnie (hereafter MCC) was a Dutch company that dispatched some 118 slaving voyages to Africa between the 1730s and 1790s. Its records are among the most detailed of all slave-trading groups. They have long attracted the attention of students of the slave trade, but to our knowledge they have not previously been used to reconstruct the day by day slave purchase and slave mortality patterns that the high survival rate of logs, journals, and other papers for MCC ships makes possible. Records of this sort exist for 70 (or 60 percent) of known MCC slaving voyages; of these 39 are for voyages destined for West Africa or “Guinea” and 31 for West-Central Africa, principally the Loango Coast. We shall focus here on the Guinea voyages. “Guinea” in this context is defined as the coastal area between the River Senegal in the north and Cape Lopez in the south and comprises Senegambia, Sierra Leone, the Windward Coast, the Gold Coast, the Bight of Benin (or Slave Coast), and the Bight of Biafra.4
All the primary materials used in this article are from the MCC records at Zeeuws Archief in Middelburg, Netherlands. The document numbers for the 39 voyages studied are 391–97, 511–17, 537–41, 542–45, 748–51, 775–80, 781–86, 830–36, 837–41, 842–47, 853–57, 858–62, 896–902, 903–09, 910–15, 916–21, 922–28, 968–72, 973–77, 994–98, 999–1003, 1004–12, 1103–10, 1125–29, 1153–59, 1189–92, 1193–97, 1217–21, 1234–38, 1239–45, 1246–51, 1252–56, 1302–06, 1312–17, 1385–90, 1391–96, 1397–1401, 1405–10, and 1411–18.
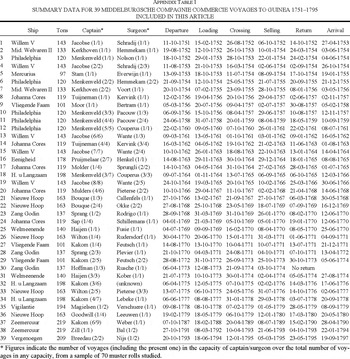
The Appendix summarizes the data on the names of the ships, masters, and surgeons as well as on ships' tonnages and voyage schedules for the 39 voyages included in this study. Thirty-six of the 39 voyages were dispatched before 1780, the remaining three in 1788–1794. All but one ship returned home to Middelburg after journeying to Africa and thence to America with slaves. Even the one ship that failed to complete its triangular voyage—the Zang Godin, which sailed in 1773—delivered slaves to America before being abandoned as unseaworthy. Fourteen different ships made these 39 voyages, with just over half the voyages (20 out of 39) being made by just four ships—the Willem V, Philadelphia, Johanna Cores, and Nieuwe Hoop. Concentration of management of voyages was much lower, however, for no fewer than 20 different captains were involved in the voyages. Only two made more than two voyages in this capacity. Of the 29 surgeons involved, only one made more than two voyages. Such patterns of management do not appear unusual in the eighteenth-century slave trade.5
Most captains had made earlier voyages in a lower rank or to a different region. In a sub-analysis, muster rolls for all the MCC voyages with complete documents (e.g., 70 out of 118, including the 39 voyages in our study) were studied to estimate the work experience of captain and surgeon. These rolls list the full name, rank, date of entry on board ship, date of death or departure from service, salary, and advance payments for each crew enlisted. In our sample, captains were generally more experienced than surgeons. With median experience the captain would be on his fourth slaving venture (second time as a captain) for the MCC, but the surgeon would have no previous experience at all. We can discount that captains may have acquired earlier experience with other companies. Our MCC findings are, nevertheless, consistent with claims that most slave captains had earlier worked as junior officers in other trades (Behrendt, “Captains”) and returned several times to the same area (Eltis, Rise of African Slavery, p. 135).
Eltis and Richardson, “Productivity.”
In common with other ships logs, those of the MCC provide daily reports on ship location, wind strength and direction, and rainfall from the start until the conclusion of voyages. What distinguishes the MCC records from those of other traders is that logs are often accompanied by trade books that provide daily accounts of slave purchases, deaths, and sales. In almost every case the age and sex of the slaves concerned is noted. Interspersed with these data are accounts of coastal purchases of water, food, wood, and other consumables as well as periodic inventories of slaves on board, purchased and dead. The last provide useful cross-references for our own calculations of the same. For the most part, the causes of the death of slaves are not reported, but there are anecdotal reports of accidental deaths, of suicides, of uprisings, and of epidemics, notably of smallpox, scurvy, and diarrhea. Reports relating to the crew paralleled those relating to slaves.7
One of the authors (SJH) was surprised to read in one of the captain's logs (MCC 844; 17 June 1771) that 13 checks worth 26,626 Dutch guilders had been entrusted to a certain captain Martynus Bruijne Hoogerzeyl of the ship De Meermin, for transport from Paramaribo to Middelburg. The Hogerzeil genealogy revealed that Martynus's father, whaling commander Bruin Okkerse Hoogerzeyl, was the brother of the author's seventh generation grandfather, commander Michiel Okkers Hoogerzeyl (1696–1779). Mixed feelings about this family link were confirmed when another log book (MCC 1239; 24 February 1765) identified Martynus as captain of De Meermin, arriving in Paramaribo with 328 slaves from Angola.
Combined into one dataset, the MCC records permit a day-to-day reconstruction of life and death on 39 slaving voyages to Guinea in the second half of the eighteenth century. The total number of enslaved Africans involved in these voyages was 9,880. To facilitate analysis of their experience, we divided voyages into five phases: (1) the journey from Middelburg to the first place of purchase of slaves; (2) the purchase or trading period in Africa (hereafter the “loading phase”); (3) the sailing time from last place of purchase in Africa to the principal place of slave sale in the Americas (conventionally known as “the middle passage,” but hereafter the “crossing phase”); (4) the time spent in the Americas selling slaves and obtaining a return cargo (or “selling phase”); and (5) the homeward voyage. In this article we concentrate on phases (2) to (4) when slaves were on board ship.
Following Curtin's pioneering census of the slave trade published in 1969, historians have typically divided trading locations in Atlantic Africa into seven regions—Senegambia, Sierra Leone, Windward Coast, Gold Coast, Bight of Benin, Bight of Biafra, and West Central Africa.8
For the original classification see Curtin, Census.
For the reconstruction of patterns of slave mortality on board ship one ideally requires data allowing one to construct “life tables” describing the number of days on board ship from initial purchase to sale or death of each individual slave in the sample. Such information is available for only one voyage in our sample.9
This was the voyage of the Philadelphia which left Middelburg in 1754 (Zeeuws Archief, 903–909) and is listed as voyage 6 in the Appendix.
SLAVE PURCHASING STRATEGY
We begin our analysis by looking at the time spent on board ship by slaves and at the slave purchasing strategies of MCC shipmasters that underlay it. In investigating these issues we use pooled data for 9,880 slaves purchased across the 39 voyages (mean purchase 253 slaves, range 71–390). As a group, these 9,880 slaves were actually on board ship for 61.3 percent (or 13,646) of the 22,238 days taken to complete the voyages. Put another way, the typical MCC slaving voyage to Guinea in 1751–1797 lasted some 570 days (or 19 months) (95 percent confidence interval (hereafter CI) 513–627 days), during which the ship would have some slaves on board for 350 days (95 percent CI 316–383 days), or just under a year. The last figure includes 223 days (95 percent CI 199–247 days) in the loading phase, 71 days (95 percent CI 65–77 days) in the crossing phase, and 56 days (95 percent CI 42–70 days) in the selling phase. The mean length of time spent by MCC ships in the crossing does not appear exceptional in the period 1750–1775, but the company's ships do seem to have spent much longer than those of other carriers acquiring slaves in Africa.10
Evidence in the revised edition of the Atlantic slave trade database, first published in 1999 and soon to be made available on-line, shows that the mean time between first purchase of slaves and departure from last place of purchase for ships trading in West Africa in 1754–1797 was 138.56 days (N = 1,245; StD = 98.79), or some 85 days less than we compute for the 39 MCC voyages in our sample (Eltis, Behrendt, Richardson, et al., On-line Database). On crossing times, data for all carriers suggest that the mean time for crossing was 81 days in 1751–1775 (N = 785 voyages). For ships leaving the Gold Coast, it was 84 days (N = 144) (Eltis, Behrendt, Richardson, et al., Slave Trade Database). The annual total number of slaves purchased by ships in our sample decreased over the period studied, from ± 450 per year in the 1750s to ± 100 in the 1790s. (R2 = 0.235, p = 0.013). Over the same period the mean crowding during the middle passage halved from 2.1 to 0.9 slaves per ton (R2 = 0.43, p < 0.001). This is in line with earlier studies (Haines and Shlomowitz, “Explaining”). The finding of Steckel and Jensen (“New Evidence”) that the loading phase and middle passage became shorter over the years was not confirmed in our study. Yearly slave death rates did not decrease for the loading phase and the crossing, despite less crowding.
Riley, “Long-Distance Voyages,” p. 653.
It is possible to ascertain the African coastal place of purchase of over 99 percent of the slaves acquired by the 39 MCC voyages in our sample. All but one of the ships began their purchase of slaves at Upper Guinea which comprised the subregions of Senegambia, Sierra Leone, and the Windward Coast west of the Gold Coast; the Windward Coast was by far the most common initial trading destination. Upper Guinea was, however, not the only source of slaves for these MCC ships, for while typically starting trade there, most went on to complete their purchase of slaves further south, with the Gold Coast being the preferred destination for the great majority. This pattern is underlined by the data shown in Table 1, which show that of the 9,880 slaves bought by MCC ships, 6,718 (or 68.0 percent) were taken at the Windward Coast and 2,224 (or 22.5 percent) at the Gold Coast. The remaining 938 slaves (or 9.5 percent) were taken at various places north of the Windward Coast or east and south of the Gold Coast. This pattern of trade differentiated that of the MCC ships from that of British, British colonial, and French traders. They sometimes purchased whole complements of slaves at the Windward Coast. In other cases they collected a few slaves, “troque au vol” (or in chance or casual barter), as they sailed along the Sierra Leone and Windward Coast to places further south.12
Examples of such trade can be found in the diaries of the slave trader turned abolitionist, John Newton, who took in slaves at Sierra Leone and the Windward Coast in three voyages he commanded in 1750–1753 (Martin and Spurrell, eds., Journal of John Newton, pp. 27, 50, 75, and 90).

At the Windward Coast, MCC ships spent about 153 days (95 percent CI 132–174 days) acquiring slaves whereas at the Gold Coast purchases took about 49 days (95 percent CI 38–59 days). Slaves were acquired at the Windward Coast at various places, with no single location predominating. Some spreading of purchases across trading venues was also evident at the Gold Coast, but 44 percent of slaves taken there were bought at Elmina and a similar percentage at Anomabu, Apam, and Axim combined. Widening the perspective to the regional level again, the implication of the regionally sequential patterns of purchase was that two-thirds of the slaves in our sample—mostly those purchased at the Windward Coast—spent up to six months longer (or 48–200 days) on board ship than the rest.
As Elmina was a major trading venue for Dutch slave ships from the late seventeenth century onwards, it is unsurprising that MCC ships purchased over 40 percent of their Gold Coast slaves there.13
On Dutch trading patterns before 1750 see Postma, Dutch.
Ibid.
On the broader picture of the shift towards the Windward Coast, see Richardson, “Slave Exports”; and Eltis, “Volume.”
On lengthening loading times between 1725 and 1775 see Eltis and Richardson, “Productivity.”
During their stay in Africa, MCC ships trading at Guinea (defined as rows 1–6 of Table 1) acquired some 1.19 slaves per day on average. This was lower than loading rates achieved by British ships trading to Sierra Leone and the Gold Coast in 1791–1797, but broadly similar to daily loading rates of Liverpool ships trading at the Windward Coast and Gold Coast in 1750–1775 computed by other means.17
For the 1791–1797 estimates, see Drake, “Liverpool-African Voyage,” p. 155; for those for 1750–1775, see Lovejoy and Richardson, “Horrid Hole,” p. 379.
A minority of five ships traded in the Bight of Biafra or Gabon during the final month. Numbers traded increase slightly towards the end (from four to six per week per ship), but show no peak during the final week (r = 0.08, p = 0.38). Interestingly, both groups show an unexpected decrease (p > 0.34) in slave-exposure during the final week that could only be explained for the Gabon group in which one ship lost 21 slaves in a revolt two weeks before departure.

FIGURE 1 MEAN NUMBERS OF SLAVES PURCHASED PER WEEK DURING THE LOADING PHASE
MCC accounts also provide day-to-day information on the age and sex of the slaves purchased. We do not know the age at which MCC shippers distinguished children from adults, but it was likely to have been around 14 years. Of the 9,880 slaves purchased in our sample, some 81 percent were described as adult. Sex ratios were 55 percent male, 45 percent female. These proportions varied little by age or between voyages. Such age and sex distributions of slave purchases were broadly similar to those achieved by other carriers of slaves from the same regions and at the same time.19
The sex ratio for ships leaving Sierra Leone (which included the Windward Coast) in 1751–1775 was 58.3 percent male and 41.7 female (N = 26 voyages). For the Gold Coast the ratio was 62.1 per cent male and 37.9 per cent female (N = 68) (Eltis, Behrendt, Richardson, et al., Slave Trade Database). Interestingly, the percentage of children on voyages from the Gold Coast in the same period was 21.4 percent (N = 42 voyages) and from Sierra Leone was 34.7 percent (N = 25).

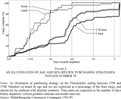
FIGURE 2 AN ILLUSTRATION OF AGE AND SEX-SPECIFIC PURCHASING STRATEGIES: VOYAGE NUMBER 10
These age and sex patterns of slave purchase meant that, ceteris paribus, children would have been expected to spend more time on board ship than adults before MCC ships left the coast. Indeed, the MCC accounts show that on the day before they left Africa girls and boys had typically spent 132 days (95 percent CI 115–150 days) and 124 days (109–139 days), respectively, on board ship whereas women had spent 101 days (86–116) and men just 91 days (70–113). In other words, children were typically exposed to on-board conditions for 41 days longer on average than adults before the crossing started and often much longer. Widening the perspective to include the crossing and selling phases of voyages, it appears that, while children comprised only 19 percent of the slaves purchased by our MCC ships, they accounted for 23 percent of the total exposure time lived by the 9,880 deportees on board ship. In other words, the slave-purchasing strategies of MCC shippers put children at risk for longer periods of time than adults, particularly men.20
Aggregated for all voyages, ships spent more than three times as many days at the Windward Coast than at the Gold Coast (e.g., a ratio 3.34), and bought three times (3.02) as many slaves accordingly. Naturally, given that numbers on board were much larger in later stages of the voyage, this translates to a smaller ratio in terms of slave exposure (1.53). But the fact that adults, and especially men, were purchased later is reflected in a relatively stronger shift for male and female exposure (e.g., to ratios of 1.36 and 1.46 respectively), and somewhat weaker for boys and girls (1.96 and 1.95). This implies that, in terms of exposure to risk, the Windward Coast was relatively less important to adults than children.
Explaining age- and sex-related slave purchasing strategies by MCC shippers is more difficult than documenting them. We have found no evidence in instructions to shipmasters by the MCC bearing on such matters, but evidence from other accounts reveals that masters trading to the Windward Coast were sometimes instructed to be selective in terms of the quality of, and price paid for, slaves early in their transactions.21
In 1768 David Tuohy, bound for the Windward Coast in a Liverpool ship, was told to “Be very carefull in the beginning of your Purchase that the Slaves be Choice, and such as will stand, for you know, they will be considerably longer on Board, and are to stand the whole Purchase, this requires a particular nicity both in regard to the Quality of the Slaves, and in the Price, and not so Necessary to be Observed, at, or near the close of your Purchase when you are then lying at great Expence and Risk” (Liverpool Record Office, 380 TUO 4/3, 9 July 1768, Folliott Powell, Hen[ry] Hardwar, Ja[me]s Clemens and Mat[thew] Stronge to Capt. David Tuohy.
On general price ratios, see Bean, British Slave Trade; and Eltis and Richardson, “Prices.”
The premium of adult males at the coast contrasted sharply with the contemporary premium on females in the interior of West Africa, where demand for female labor women was high; Lovejoy and Richardson, “Competing Markets.”
It would be misleading, however, to attribute slave purchasing strategies by MCC shipmasters purely to coastal relative prices for slaves or to demand-side factors. Such strategies were conceivably shaped, too, by African-centered factors as well as perceptions of the shipboard survival capacity of different categories of slaves. The intensity of MCC activity at the Windward Coast after 1750 almost certainly reflected pressures on slave supply capacity as well as the strength of competition for slaves in other regions of Atlantic Africa at that time.24
On the general lengthening of loading times after 1750, see Eltis and Richardson “Productivity”; and Klein, Engerman, Haines, et al., “Transoceanic Mortality,” p. 111. On coastal price trends see Richardson, “Prices of Slaves.”
Richardson, “Shipboard Revolts.” There is evidence that outside Upper Guinea, which includes the Windward Coast, higher ratios of women were correlated to the incidence of slave ship revolts; Behrendt, Eltis, and Richardson, “Cost of Coercion.”
SHIPBOARD MORTALITY
It is widely recognized that there was a large spread and skewed distribution of slave mortality on board ship from voyage to voyage and that this presents problems for establishing a meaningful measure of mortality levels.26
Klein, Atlantic Slave Trade, p. 136.
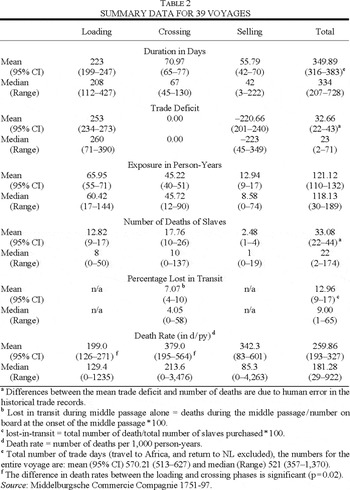
In total, 1,290/9,880 (13 percent) of the slaves purchased on our 39 MCC voyages were lost in transit. This corresponds to a pooled death rate of 273 d/py for a total slave exposure of 4,724 person-years. If we restrict ourselves to the loading phase alone, the pooled death rate of the total sample was 203.66 d/py. However, the range of the rates for each of the 39 voyages varied from 0.00–1,235.49 with a mean of 198.96 (95 percent CL 126.3–271.6) and a median of 129.39. Which of these values to report? The mean is not very reliable here because of the wide confidence interval. The 5 percent trimmed-mean, which disregards high and low extremes, is 167.56. Still more sophisticated estimations of the center (Huber's M-estimator, Tukey's Biweight, Hampel's M-estimator and Andrews' Wave) range from 260.30 to 262.68. Such wide differences in mortality between the voyages make it difficult to express that in one meaningful figure.
Descriptions of trends in average mortality over two week periods for the 39 voyages in our sample yielded unworkable confidence intervals. Very wide short-term variations obscured any longer-term trend in mortality. Methodologically, pooling the daily mortality records per week or per month reduces the effect of extreme values and increases the statistical significance. This can be illustrated by correlating the death rates of the 39 voyages with time from the start of loading in weekly (r = 0.35) or monthly (r = 0.417) periods. By pooling all voyages together, the correlations further increase over daily (r = 0.170), weekly (r = 0.604) or monthly (r = 0.768) periods. The correlations seem stronger but the variance between voyages or details of time patterns disappear. By experimenting with shorter time spans and subsets for each sex and age group, various other (nonsignificant, nonlinear) fluctuations can be visualized. They offer tempting hypotheses pertaining, amongst others, to differences in sex- and age-specific timing of mortality, but these cannot be verified as yet.
On short-term fluctuations, the trend of the rate of loss during voyages, and its interpretation, see Miller, “Statistical Evidence.”
We begin by providing in Table 2 some basic mean and median values of voyage duration as well as slave purchases, exposure, loss in transit, and death rates for the 39 voyages in our sample. To give a very general impression: the typical MCC voyage to Guinea in 1751–1797 purchased 253 slaves (range 71–390), lost 33 slaves (range 2–174) during the course of its voyage, and sold 220 slaves (range 45–349) in the Americas. The loss in transit, defined in this case to include the loading, crossing, and selling phases, averaged 13 percent (range 1–65 percent). Though problems exist in making comparisons, this seems not to have been untypical at this time.30
If mortality is expressed in percentage “lost-in-transit,” it is important to state explicitly which time period is described, and how the denominator is defined. If lost-in-transit is defined as percentage of the total number of slaves purchased, the mean percentage lost-in-transit in our sample was 12.96 percent (95 percent CI 9–17). But this definition becomes ambiguous if applied to a single phase of the voyage. As a percentage of the total number of slaves purchased, the number of deaths during the crossing alone was 6.59 percent. Using the number of survivors on the first day of the crossing as denominator, the percentage increases slightly to 7.07 percent. As previous studies often do not state if they consider the total voyage (from first purchase to last sale) or only the crossing, and whether they use the total number purchased or the number of survivors at the start of the crossing as denominator, it is difficult to compare our MCC phase-specific loss in transit figures with the available literature. Having said that, the mean loss rate of slaves on all ships in 1750–1800 is estimated to have been 11.2 percent (Klein, Engerman, Haines, et al., “Transoceanic Mortality,” p. 114) and for the quarter century from 1751–1775, in which the bulk of the 39 MCC voyages in our sample was concentrated, it was 14.2 percent (N = 809; StD 14.5) in general and 13.7 per cent (N = 184; StD 12.7) if only voyages to the Windward Coast and Gold Coast are included (Eltis, Behrendt, Richardson, et al., Slave Trade Database).
Ibid. The point is further emphasized when one takes account of slave deaths during the enslavement process and forced journey to the African coast. One of the few losses in transit of Europeans that comes close to that of slaves on MCC vessels is that of Dutch passengers traveling to the Cape of Good Hope in the 1730s when losses were estimated at 23.07 per 1,000 per month (Riley, “Long-Distance Voyages,” p. 652) or 276.84 d/py.
To illustrate: a death rate of 259 d/py equates to a loss of 5.4 persons (2.1 percent) in the first month for a shipload of 250 slaves. In our sample, death rates regularly hit > 2,000 d/py over very short periods. At such a rate of loss, a ship with 250 slaves would have lost 42 slaves (17 percent) in the first month; and half its purchase within four months.

Our methodology allows us to go beyond these crude measures of mortality, and to investigate the impact on mortality of risk factors such as length of time on board ship, geographical location of trade, and the age and sex of slaves. Table 2 provides information relating to the first of these. It shows that the loading phase accounted for almost 66 (or 54.5 per cent) of the 121 person-years spent on average by slaves on board ship. It also accounted for 41 percent of slave deaths. This amounts to a much higher proportion of total slave deaths on board ship at the coast than has sometimes been estimated.33
For estimates of deaths at the coast, see Klein and Engerman, “Slave Mortality”; Klein, Engerman, Haines, et al., “Transoceanic Mortality”; and Klein, Atlantic Slave Trade, p. 157. Data for the eighteenth century, most of it relating to British ships in the 1790s, suggest deaths during coasting averaged less than 10 percent of slaves purchased or 18–30 percent of total slave deaths on board ship.
The death rates in the crossing on our MCC voyages were seemingly lower than the mean rate for most slave ships in 1751–1775 and 1776–1800, when annualized rates were 626.4 per 1,000 (N = 450) and 552 per 1,000 (N = 650), respectively (Klein, Engerman, Haines, et al., “Transoceanic Mortality,” p. 113). There is no clear explanation of the lower mortality rates on MCC ships in the crossing, but it may in part have been linked to the geographical distribution of trade in Africa. Few slaves taken by our MCC ships came from Senegambia, the Bight of Benin, and Bight of Biafra but ships from these regions comprised over a third of the ship records in 1751–1800 on which general estimates of middle passage mortality have been calculated. Ships from these regions typically had higher mortality rates in the crossing than those leaving other regions, including the Windward Coast and Gold Coast (Klein, Engerman, Haines, et al., “Transoceanic Mortality,” p. 114).
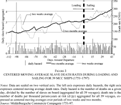
Removal of the four voyages in question lowers the mean death rate for the remaining 35 ships from 259.86 to 204, 95 d/py. The average number of days on board before departure decreased marginally from 99 to 95 days, and mean exposure remained the same. Then, the daily death rates for the 35 ships were aggregated. Centered moving average daily death rates were then computed, with spans of 14 and 56 days and plotted from 16 weeks before departure till six weeks of crossing. For this period of 22 weeks, data were available for all 35 voyages and inform Figure 3.
Steckel and Jensen, “New Evidence.” Our findings are also consistent with those of Klein, Engerman, Haines, et al., “Transoceanic Mortality,” pp. 111–13, which show a sharp rise in mortality between the coasting and crossing phase of voyages in 1751–1800.

FIGURE 3 CENTERED MOVING AVERAGE SLAVE DEATH RATES DURING LOADING AND SAILING FOR 39 MCC SHIPS (1751–1797)
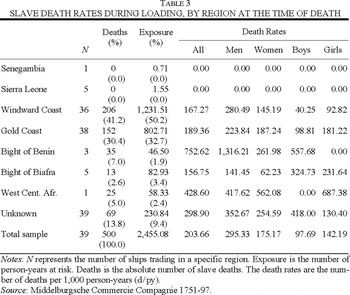
Our data allow us to investigate risk factors for slaves other than time. Table 3 refers to the coasting period (or phase 2) and provides data on the coastal location of ships at the time of slave deaths. These show that while trading on the Windward Coast ships experienced slave mortality rates of 167 d/py. Rates rose to 189 d/py during trading on the Gold Coast. It is likely that this rise in mortality rates between the Windward Coast and Gold Coast was in part a result of time factors, with sick or exhausted slaves bought on the Windward Coast dying while ships completed their slave purchase further south. But one cannot rule out the possibility that it may also have been caused by unhealthy Gold Coast slaves dying soon after purchase.

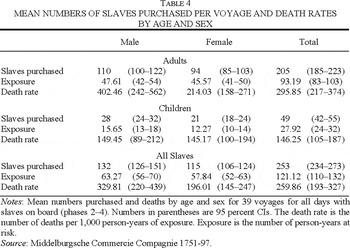
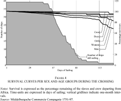
The data offer a rather clearer picture when it comes to looking at age and sex as risk factors for slaves. Table 4 refers to the entire period when slaves were on board (phases 2–4) and offers disaggregated data on slave mortality by age and sex. Some caution in interpreting the data on mortality by age is needed when relying on only two categories—adults and children—and when the boundaries between the two are blurred and the precise age distributions within them are unknown. The data suggest, however, that mortality rates for adults were systematically higher than for children. Moreover, among adults, they were much higher for males than for females. Thus, at 296 d/py, the mortality rate for adults was more than double that of children, while at 402 d/py, the mortality rate of men was some 88 percent higher than the 214 d/py for women. Such findings inform Figure 4, which reveals survival rates for groups of slaves by age and sex during the crossing. It shows a steeper decrease in surviving adult males compared to other groups. On MCC ships at least, it appears that being an adult male slave was a risk in itself.37
This stands in sharp contrast with some recent findings which suggest that in 1776–1800, when the data are most abundant, mean loss rates of slaves did not vary much by age or sex (Klein, Engerman, Haines, et al., “Transoceanic Mortality,” p. 116). These findings are based on a much larger sample of voyages than we use here, but the calculations upon which they are based relate to percentage losses in transit and, unlike our findings, make no allowance for differentials in time spent on board ship by different categories of slaves.


FIGURE 4 SURVIVAL CURVES PER SEX AND AGE GROUPS DURING THE CROSSING
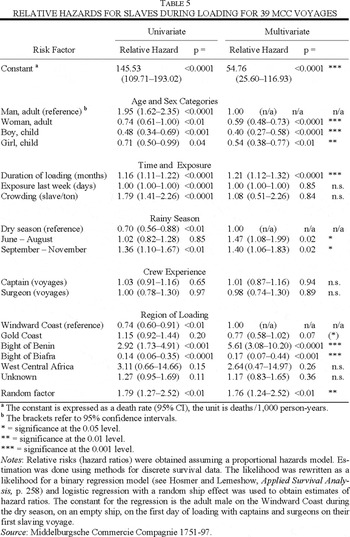
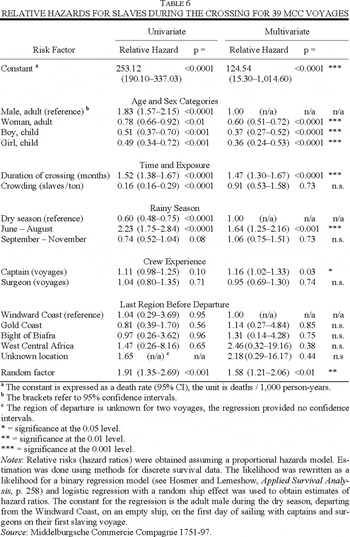
Multivariate analysis allows us to assess the relative contribution of these and other risk factors to shipboard slave mortality. Our analysis uses all daily records for all 39 voyages during the loading, crossing, and selling phases in a nonlinear multivariate model, with separate regressions for loading and crossing phases. The results are expressed as relative risks and refer to odds of dying on any given day.38
Relative risks (hazard ratios) were obtained assuming a proportional hazards model. Estimation was done using methods for discrete survival data. The likelihood was rewritten as relating to a binary regression model (Hosmer and Lemeshow, Applied Survival Analysis, p. 258) and logistic regression with a random ship effect was used to obtain estimates of hazard ratios.


During the loading phase (Table 5), the odds of dying for an adult male on the first day of loading was equivalent to a death rate of 54.76 d/py. For adult women, the odds were 0.59 of those for men (32.30 d/py); for girls 0.54 (29.57 d/py); and for boys 0.40 (21.90 d/py). These baseline odds worsened with every month the ship took to load (× 1.21), during the rainy season from June to August (× 1.47) or during the following trimester to November (× 1.40).39
The rainy season varied between Upper Guinea and the Bight of Biafra. August and September were, however, the months with the lowest levels of slave deliveries at Sierra Leone and the Windward Coast, a pattern linked, it seems, to the harvest cycle as well as rainfall patterns (Behrendt, “Markets,” pp. 184–85).
The sample sizes of deaths for the Bight of Benin and Bight of Biafra are very small.
To give an example: an adult woman during the final weeks of loading on a typical ship in Elmina (based on six months loading, five months on board, 250 slaves at 2.0 slaves per ton, during the rainy season, captain on his second voyage and the surgeon on his first, on the Gold Coast, random effects included, according to Table 5, would have seen her odds of dying multiplied by 4.3 from a death rate of 54.76 to approximately 235.15 d/py since her arrival on board (i.e., 54.76 × 0.59 × (1.21)6 × (1.00)150×28 × (1.08)2 × 1.47 × (1.01)2 × 0.98 × 0.77).
IMPLICATIONS
The principal finding of this longitudinal study is that slave exposure and mortality patterns on board MCC ships trading to Guinea after 1750 were not homogeneous. Depending on the region of embarkation, large proportions of slaves spent much longer on board ship than others. Adult males tended to be purchased later than children. There was a slow but continuous rise in mortality throughout the loading and crossing phases of voyages, with a dramatic rise in mortality at the end of very long crossings. Adult males were at higher risk than other slaves, especially children. The overall slave mortality rates found on MCC ships in 1751–1797 were, at 199.0 d/py and 379.0 d/py, respectively, for the loading and crossing phases, much higher than those found by Steckel and Jensen for British ships in 1792–1796 in the only other study using standardized shipboard slave mortality rates known to us.42
Steckel and Jensen, “New Evidence.”
In some respects MCC voyages to West Africa were atypical of the slave trade in the second half of the eighteenth century. They had an unusual balance of trade between the Windward Coast and the Gold Coast. They typically took over 60 percent longer to purchase slaves at the coast than their contemporary rivals, yet experienced mortality rates among slaves in the crossing from West Africa to the Americas that were relatively low. The juxtaposition of the last two may in part have reflected the concentration of MCC West African trade at the Windward Coast and Gold Coast. Ships leaving these two regions typically experienced lower mortality in the crossing than those leaving Senegambia, the Bight of Benin, and Bight of Biafra and which are included in more general calculations of mortality. The apparently exceptional nature of some features of MCC voyages to West Africa suggests the need for similar micro-studies of slave mortality for other regions of trade in Atlantic Africa.
Even with these caveats, however, our investigation of shipboard experience of slaves on MCC vessels trading to West Africa encourages reflection on conceptualizations of the middle passage; on the impact of age and gender on slave purchase and mortality patterns; and on the relative importance of African and shipboard conditions in determining mortality trends. These are inter-related issues. By way of conclusion we briefly examine each of them.
The image of the Atlantic slave trade as a triangular trade linking three continents—Europe, Africa, and the Americas—has been a powerful factor in shaping the historiography on the middle passage. Conventionally defined as the ocean voyage between Africa and the Americas—and thus the second of the three legs of the triangular trade—the middle passage has become a metaphor for the horrors of transatlantic slavery. Viewed as an ocean crossing, it has also become the principal focus of efforts to measure changes through time and across space of shipboard slave mortality, with the proportions of slaves leaving Africa lost in transit being the key measure of such mortality. Reconstruction of voyages by MCC ships reveals, however, that the Atlantic crossing occupied little more than one-fifth of the time that ships had “human cargo” on board. This may have been a lower proportion than in most instances, simply because MCC ships typically spent longer acquiring slaves at the coast than other ships. Nevertheless, it remains the case that the Atlantic crossing typically took only a fraction of the time that most ships spent trading in Africa. This was especially true of the period 1751–1775 in which the MCC voyages included in this study were concentrated.43
Coasting or loading times of all ships in 1751–1775 were evidently longer than normal (Eltis and Richardson, “Productivity”; Klein, Engerman, Haines, et al., “Transoceanic Mortality,” p. 111).
Redefining the middle passage places the slave purchasing strategies of shippers at the heart of discussions of shipboard slave mortality. The reconstruction of MCC voyages reveals a bias towards purchasing children and females at the start of loading and towards men in the final weeks. In the case of MCC ships, this had regional implications as ships tended to begin trade at the Windward Coast and conclude it on the Gold Coast. In terms of mortality, an important finding is that, against a background of rising mortality throughout the loading and crossing phases for all slaves, death rates of children and women remained lower than those of men. This fact may have been appreciated by some MCC shipmasters, at least half of who made multiple slaving voyages. It may thus have reinforced other factors such as the higher price of adult males and fear of shipboard rebellion, to which we alluded earlier, in shaping the slave purchasing strategy of such masters in Africa.
The age- and sex-related differentials in mortality on MCC ships contrast sharply with the findings of other studies of mortality using loss in transit data, which, if anything, show higher losses of children than adults.44
Evidence for loss in transit for 199 voyages in 1651–1825 shows a child loss of 7.9 percent compared to 6.7 percent for adults (Klein, Engerman, Haines, et al., “Transoceanic Mortality,” p. 116). The densest data are for 1776–1800 (151 voyages), when losses were 4.8 percent and 4.6 percent respectively.
Eltis and Engerman, “Fluctuations.”
Finally, patterns of mortality on MCC ships help to inform the on-going debate over the relative importance of shipboard and African conditions in influencing mortality rates of slaves in transit. Differential rates of loss of slaves by African region of embarkation—notably between the Bight of Biafra and other regions—and allegedly high incidences of mortality in the early stages of the Atlantic crossing have tended to be seen as indicative of African influences on slave mortality. The MCC records used here offer very little new direct evidence on either of these arguments. Only a tiny share of the slaves included in this study came from the Bight of Biafra. Extraordinary variations in mortality over short intervals also make it unwise to do more than track macroscopic time-related trends in voyage mortality. Nevertheless, differentials in mortality rates of slaves by age and sex raise questions about the effectiveness of developments in shipboard sanitation and hygiene in lowering shipboard mortality rates equally for all slaves, and point, instead, to the condition of slaves at the time of embarkation as critically important in determining their survival rates.46
Haines and Shlomowitz, “Explaining.” Haines and Shlomowitz relate their argument specifically to British trading activity but there are claim that innovations developed by one group of traders were commonly adopted by others (Klein, Atlantic Slave Trade, p. 159).
Appendix

We thank Pieter Emmer, Jan P. Vandenbroucke, Saskia le Cessie, Jelmer Vos, Harm Beukers, Hans V. Hogerzeil and the anonymous referees of this JOURNAL for assistance in writing this article. We acknowledge the generosity of Zeeuws Archief (Middelburg), Leiden City Archive and Leiden University Library in facilitating access to the primary sources upon which it is based. The article derives from a project on medicine and the Atlantic slave trade led by David Richardson and funded by the Wellcome Trust. The financial support of the Trust is gratefully acknowledged. The prepartion of the article was assisted by the generosity of Yale's Gilder-Lehrman Center for the Study of Slavery, Resistance and Abolition, in awarding a visiting fellowship to Richardson in Spring, 2004, and for which he takes this opportunity to express his gratitude. The usual disclaimer applies.