


I. Introduction
This study investigates the relation between inflation and corporate credit risk across firms and countries, and how this relationship varies with debt rigidity, operating cash flow rigidity, and the monetary and institutional environments in which firms operate. Understanding this relationship has become especially important in the wake of the global inflation surge following the COVID-19 recovery and subsequent macroeconomic disruptions.Footnote 1 While recent studies examine the relation between inflation and credit risk in single-country settings (e.g., Bhamra, Dorian, Jeanneret, and Weber (Reference Bhamra, Dorion, Jeanneret and Weber2023), Bonelli, Palazzo, and Yamarthy (Reference Bonelli, Palazzo and Yamarthy2025)), much less is known about how this relation differs across countries facing very different inflation regimes, monetary-policy responses, debt structures, and institutional environments.
This international variation is central to our analysis. The relation between inflation and corporate credit risk need not be uniform across countries or firms. Inflation may ease the real burden of nominal debt for some firms, while tightening financing conditions and compressing operating margins for others. Which force dominates should depend on firms’ exposure to refinancing risk, their ability to pass rising input costs through to customers, and the country-level conditions under which they operate. By exploiting firm-level data from 50 countries, we use the global setting as a natural laboratory to examine when inflation is associated with higher corporate credit risk and when this relation is attenuated. We further examine how the balance varies between two opposing mechanisms: a debt-rigidity channel, under which inflation reduces the real burden of nominal debt when debt obligations are insulated from contemporaneous repricing, and an operating-rigidity channel, under which inflation raises credit risk when firms cannot adjust prices and operating cash flows sufficiently to offset rising input costs. This comparative cross-country structure is our study’s key advantage: it allows us to examine how inflation–credit risk sensitivities differ systematically across settings in ways that single-country studies cannot easily capture.
Figure 1 presents a heat map of global inflation, illustrating the average inflation rate of each country from 2001 to 2022. Average inflation rates vary widely, ranging from near-zero levels in Japan (0.23%) and Switzerland (0.4%) to persistently high levels in Russia (8.74%) and Turkey (8.8%), compared with 2.19% in the United States. This substantial cross-country dispersion is not merely descriptive background. It provides a valuable setting for examining how inflation-related credit-risk exposure differs across countries with distinct inflation levels, monetary-policy regimes, financial structures, and institutional environments. By exploiting this international heterogeneity, our study goes beyond asking whether inflation is associated with corporate credit risk on average and instead asks how and why this relation varies across firms and countries.
Figure 1 presents a heat map of global inflation. Inflation levels represent the average inflation rate of each country from 2001 to 2022, with deeper colors indicating higher levels of inflation.

FIGURE 1 Long description
A legend in the Southwest corner titled Inflation % uses five shades of red and a white box for No data. The color scale ranges from light peach for 0 to 2 percent to deep burgundy for 8 to 10 percent.
* North America: The United States and Canada are light peach, indicating low inflation. Mexico is a darker shade of orange.
* Central and South America: High inflation concentrations are visible in Brazil and several Central American nations, shown in vibrant red.
* Europe: Most of Western Europe is light peach, while Eastern Europe and Russia are shaded in deep burgundy, indicating the highest inflation bracket.
* Africa: A mix of moderate orange to dark red shades, with high concentrations in the North and Southeast.
* Asia: India and Southeast Asian countries like Vietnam and Indonesia show high inflation in dark red, while China is a lighter peach.
* Oceania: Australia and New Zealand are shaded in light orange, indicating moderate inflation levels.
On the one hand, inflation can reduce the real burden of nominal liabilities, thereby easing financial pressure and lowering credit risk (e.g., Bhamra, Fisher, and Kuehn (Reference Bhamra, Fisher and Kuehn2011), Kang and Pflueger (Reference Kang and Pflueger2015), Gomes, Jermann, and Schmid (Reference Gomes, Jermann and Schmid2016), Bhamra et al. (Reference Bhamra, Dorion, Jeanneret and Weber2023), and Schnorpfeil, Weber, and Hackethal (Reference Schnorpfeil, Weber and Hackethal2023)). This debt-rigidity channel should be especially relevant for firms whose debt obligations are relatively insulated from contemporaneous inflation and interest-rate adjustments, such as firms with more fixed-rate or longer-maturity debt. On the other hand, inflation raises the costs of key production inputs such as raw materials, energy, and labor. When firms cannot pass these higher costs through to customers, operating margins and cash flows deteriorate, increasing default risk (Gorodnichenko and Weber (Reference Gorodnichenko and Weber2016), Augustin, Cong, Corhay, and Weber (Reference Augustin, Cong, Corhay and Weber2026)). This operating-rigidity channel should be especially relevant for firms with rigid prices and sticky cash flows.
The relative strength of these two mechanisms should also depend on country-level conditions. In particular, two country-level features are especially relevant. First, in countries where monetary policy responds more aggressively to inflation, higher inflation is more likely to trigger policy-rate increases, tighter borrowing conditions, and greater refinancing pressure for firms. Second, in countries with weaker institutional environments, firms often have less stable access to external finance, weaker shock-absorption capacity, and more volatile operating cash flows, making inflation-driven refinancing costs and input-cost pressures more likely to translate into higher default risk. More generally, cross-country differences in debt structure, refinancing exposure, price flexibility, and institutional support can shift the relative importance of the debt-rigidity and operating-rigidity channels.
Using a comprehensive firm-level data set of more than 1,100 firms with traded credit default swap (CDS) contracts across 50 countries from 2001 to 2022, we document three main findings. First, inflation is positively associated with corporate credit risk on average. Second, this average effect masks a pronounced nonlinear pattern. The relationship between inflation and credit risk is convex: it is negative or weak at low inflation levels, but becomes much more positive in high-inflation environments. Third, and most importantly, the positive relation between inflation and credit risk is highly heterogeneous. It is stronger for firms with higher leverage and greater short-term refinancing needs, and in countries with more inflation-responsive monetary regimes. In contrast, it is weaker for firms operating in industries with greater price flexibility and for those whose operating cash flows better keep pace with rising input costs. The positive relation is also more pronounced in countries with weaker institutional environments. These findings highlight that the value of the global setting lies not merely in broader external validity, but in identifying how the inflation–credit risk relation depends on both firm-level and country-level conditions.
To investigate the inflation–credit risk relationship, we employ CDS spreads as our primary proxy for corporate credit risk, which are widely regarded as a forward-looking and market-based measure of corporate credit risk.Footnote 2 Our baseline analysis reveals that a 1-standard-deviation increase in inflation is, on average, associated with a 21-basis-point rise in the following year’s CDS spreads, equivalent to a 13% increase relative to the sample mean, after controlling for firm and industry-year fixed effects. To assess sensitivity to omitted variables, we implement the Oster (Reference Oster2019) coefficient-stability test, which suggests that the estimated inflation effect is not particularly fragile to omitted-variable bias of the conventional sort. We also complement the baseline analysis with an instrumental-variables approach using WTI crude oil prices and the Baltic Dry Index as instruments for inflation, as both capture exogenous global input-cost shocks that feed into inflation.Footnote 3 To strengthen identification, we interact these global price measures with country-specific oil and shipping betas, thereby generating instruments that vary across both time and countries according to national exposure to input-cost shocks. Further, excluding countries with unusually high GDP-growth sensitivity to oil price fluctuations yields qualitatively similar IV results. Taken together, these analyses provide supportive evidence that the positive relation between inflation and corporate credit risk is not simply driven by omitted macroeconomic conditions.
Next, we test for nonlinear effects and find strong support for a convex relationship between inflation and corporate credit risk. First, including both inflation and its squared term in the regression reveals a significantly negative linear term and a significantly positive squared term, supporting a convex relationship. Second, a spline regression by inflation terciles shows that the relation is significantly positive only in the high-inflation regime, whereas it is negative, albeit insignificant, in the low-inflation regime.
Moreover, the balance between the opposing forces (i.e., the debt-easing benefit of sticky leverage and the risk-enhancing effect of rising input costs) varies across firms and countries, motivating our analysis of how such heterogeneity moderates the inflation–credit risk relationship. A key factor is firms’ refinancing vulnerability, which reflects the extent to which debt obligations are insulated from contemporaneous inflation and interest-rate adjustments. When debt is fully indexed to inflation, the debt-easing benefit vanishes because inflation directly raises nominal repayment obligations. More generally, firms with greater leverage and more short-term debt are more exposed to inflation-induced refinancing pressure, especially when higher inflation is met by tighter monetary policy. Consistent with this reasoning, we find that the positive relation between inflation and credit risk is stronger for highly leveraged firms, for firms with greater short-term refinancing needs, and for firms operating in countries where monetary policy responds more aggressively to inflation. These effects are particularly pronounced in high-inflation environments.
Another key source of heterogeneity is cash flow stickiness, defined as the extent to which a firm’s operating cash flows fail to keep pace with rising input costs. Firms with greater pricing flexibility are better able to pass cost increases through to customers and thereby protect margins during inflationary periods. By contrast, firms facing more rigid pricing conditions are less able to absorb inflation-driven cost shocks, leading to weaker cash flows and higher credit risk. To capture this mechanism, we rely primarily on an industry-level measure of price flexibility based on Cavallo’s (Reference Cavallo2018) micro-price data, specifically the frequency of price changes, as well as a firm-level measure of the sensitivity of operating cash flows to inflation. Our results show that the positive relation between inflation and credit risk is weaker for firms operating in industries with greater price flexibility and for firms whose operating cash flows respond more favorably to inflation. These moderating effects are again concentrated in high-inflation environments.
Lastly, we examine country-level heterogeneity in institutional quality.Footnote 4 We conjecture that the positive relation between inflation and credit risk is stronger for firms facing greater underlying uncertainty. This implication is especially relevant in emerging markets and in countries with weaker governance, lower transparency, and less developed financial systems. In such environments, firms typically have weaker shock-absorption capacity, less stable access to external finance, and a more limited ability to withstand inflation-driven increases in refinancing costs and input-cost pressures. As a result, inflation is more likely to translate into tighter financial conditions, weaker operating cash flows, and higher perceived default risk. Consistent with this view, we find that the positive relation between inflation and credit risk is significantly stronger in these settings. By contrast, firms in commodity-exporting countries, such as Australia, Canada, and New Zealand, benefit from inflation through higher international commodity prices, which can partially offset the adverse effects of inflation on credit risk.
While our main analysis focuses on 5-year CDS contracts, which are the benchmark in the CDS market, we also examine the relation between inflation and credit risk across CDS contract maturities ranging from 6 months to 30 years. We expect a stronger effect at shorter maturities because nominal rigidities limit firms’ ability to pass rising input costs through to customers in the short run, while inflation also heightens expectations of near-term operational adjustments and tighter monetary policy. Empirically, we find that inflation is positively associated with CDS spreads across the term structure, with the relation peaking at the 2-year maturity and remaining statistically significant up to 7 years. These results suggest that the inflation-credit risk relation is strongest over the short to medium term.
We conduct a broad set of robustness checks to validate our findings. We show that the main results are not driven solely by realized inflation: when expected inflation, inflation surprises, and inflation volatility are examined jointly, realized inflation remains the most robust predictor of future CDS spreads. In subsample analyses, the inflation–credit risk relation is insignificant for U.S. firms on average, but remains convex, with significantly negative effects in the low- and medium-inflation regimes, consistent with Bhamra et al. (Reference Bhamra, Dorion, Jeanneret and Weber2023). Similar convex patterns also appear in the Japan subsample, which is consistent with Japan’s persistently low inflation environment. Our findings are also robust to alternative measures of CDS spreads and inflation, including median CDS spreads, year-end CDS spreads, log CDS spreads, and quarterly inflation, as well as to first-differenced regressions. In addition, the positive and convex inflation–credit risk relation continues to hold under alternative clustering methods, including two-way clustering, after adding controls for real short-term interest rates, banking crises, sovereign rating downgrades, and policy-rate changes, after restricting the sample to countries with at least 10 firms, and after controlling for currency-by-year fixed effects and exchange-rate movements.
Finally, we use 5-year forward-looking default probabilities from the National University of Singapore’s Credit Research Initiative (NUS-CRI) as an alternative credit risk measure. A 1-standard-deviation inflation increase on average corresponds to a 7% rise in the firm’s 5-year default probability. Importantly, this relationship is concentrated in the medium- and high-inflation regimes, reinforcing the non-linear inflation–credit risk link found in our CDS analysis.
Our study makes three key contributions to the literature on inflation and credit risk.Footnote 5 First, we provide new international evidence on the relation between inflation and corporate credit risk using CDS spreads. More importantly, the global setting allows us to show that the inflation–credit risk relation varies systematically across monetary regimes, institutional environments, and firm financing and operating characteristics in ways that are difficult to identify in single-country or narrower-sample settings. In this sense, our article complements prior work on inflation and credit risk in more limited settings, such as Kang and Pflueger (Reference Kang and Pflueger2015) and Bhamra et al. (Reference Bhamra, Dorion, Jeanneret and Weber2023), and builds on related evidence that nominal rigidities matter for asset pricing and firm-level outcomes (Weber (Reference Weber2015), Gorodnichenko and Weber (Reference Gorodnichenko and Weber2016)).
Second, we document a convex relationship between inflation and corporate credit risk, with the relation being negative or weak at low inflation levels but becoming much more positive in high-inflation environments. This nonlinear pattern helps reconcile why prior studies conducted in different inflation settings may reach different conclusions and complements Bhamra et al. (Reference Bhamra, Dorion, Jeanneret and Weber2023) by showing how the net effect of inflation on credit risk varies across inflation regimes in a broad international setting.
Third, we show that the inflation–credit risk relation depends jointly on financing-side and operating-side rigidities. In this respect, our evidence complements prior studies on debt structure, price rigidity, and inflation transmission, including Weber (Reference Weber2015), Gorodnichenko and Weber (Reference Gorodnichenko and Weber2016), D’Acunto et al. (Reference D’Acunto, Liu, Pflueger and Weber2018), and Augustin et al. (Reference Augustin, Cong, Corhay and Weber2026), by linking these mechanisms directly to firm-level credit risk in a global setting. More broadly, our study advances the credit-risk pricing literature by incorporating inflation into firm-level credit-risk analysis using forward-looking, market-based CDS spreads and a broad set of robustness and supplementary identification tests.Footnote 6
II. Conceptual Framework and Hypotheses Development
We develop a stylized model as a conceptual framework to organize our hypothesis development and discipline the empirical predictions. The model is not intended to be a full structural model of endogenous capital structure, debt indexation, or pricing choice. In practice, firms’ leverage, debt maturity, and pricing decisions are themselves endogenous responses to inflation risk. Our framework abstracts from these endogenous choices for tractability and adopts a reduced-form structure to derive qualitative restrictions on how debt rigidity (related to leverage and debt maturity) and operating rigidity (related to price and operating cash flow stickiness) shape the inflation-credit risk relation. Supplementary Material Appendix A presents the basic model setup. The model illustrates how these two channels can jointly generate a convex inflation–credit risk relation and how the strength of this relation can vary across firms with different levels of debt rigidity and operating rigidity and across countries with different institutional environments.Footnote 7
To make the conceptual framework more transparent, we summarize subsequently the core setup and motivating equations from Supplementary Material Appendix A to clarify the mechanism that links inflation, debt rigidity, operating rigidity, and firm default risk. In the model, firm value depends on inflation-sensitive operating cash flows and nominal debt obligations. Let firm cash flows be given by

where
$\mu >0$
 is the firm’s baseline cash flow component,
$\pi$
 is the inflation rate,
$\delta \in \left[0,1\right]$
 is the pass‑through parameter capturing the revenue-side elasticity of nominal cash flows with respect to inflation,
$\psi >0$
 captures nonlinear input‑cost pressures,Footnote
8 and
$\varepsilon \sim N\left(0,{\sigma}^2\right)$
 is an idiosyncratic cash flow shock.
Debt obligation (i.e., coupon payment obligation) is given by

When
$\lambda =0$
 , the coupon payment is fully fixed at
$c$
 ; when
$\lambda =1$
 , it is fully indexed to inflation. Hence,
$\lambda$
 captures the extent of debt-easing from nominal rigidity. Default risk increases when cash flows fall relative to debt obligations. Thus, inflation is associated with credit risk through two opposing channels: the debt-rigidity channel, which reduces the real burden of debt when nominal obligations are sticky, and the operating-rigidity channel, which compresses margins when firms cannot pass rising input costs through to customers.
Combining the two channels implies that the effect of inflation on credit risk can be written as a nonlinear function of inflation,

where PD is the firm’s probability of default, and the sign of the derivative depends on the relative strength of the debt-rigidity and operating-rigidity channels. At low inflation levels, the debt-rigidity channel may dominate; at sufficiently high inflation levels, the operating-rigidity channel becomes stronger. It can be shown that the turning point of inflation level
${\pi}^{\ast }$
 satisfies

At low inflation levels such that
$\pi <{\pi}^{\ast }$
 ,
$\frac{d PD}{d\pi}<0$
 and debt-easing dominates. At sufficiently high inflation levels such that
$\pi >{\pi}^{\ast }$
 ,
$\frac{d PD}{d\pi}>0$
 and the operating-rigidity channel dominates. Supplementary Material Appendix A formalizes these channels in a stylized reduced-form framework, while the main text focuses on the qualitative comparative statics that motivate the empirical analysis. Specifically, the model yields predictions about the sign, curvature, and heterogeneity of the inflation–credit risk relation, which guide the empirical analyses that follow.Footnote
9
A. Debt Rigidity Versus Operating Rigidity
As illustrated in Supplementary Material Appendix A.1, inflation affects firm credit risk through two competing mechanisms. The first is the debt-rigidity channel. When debt obligations are fixed in nominal terms, higher inflation reduces the real value of promised repayments and can thus lower default risk. This is important when leverage is high and debt is long-term, fixed-rate, and only weakly indexed to inflation. This channel has been theoretically and empirically supported in prior work (e.g., Bhamra et al. (Reference Bhamra, Fisher and Kuehn2011), (Reference Bhamra, Dorion, Jeanneret and Weber2023), Kang and Pflueger (Reference Kang and Pflueger2015), Gomes et al. (Reference Gomes, Jermann and Schmid2016), and Schnorpfeil et al. (Reference Schnorpfeil, Weber and Hackethal2023)).
The strength of the debt-rigidity channel depends critically on a firm’s debt structure, particularly the share of fixed- versus floating-rate debt and the maturity profile of its liabilities. Firms with a higher share of fixed-rate, long-term debt benefit more from inflation, as the real cost of servicing debt declines. Conversely, for firms reliant on floating-rate debt or with significant short-term refinancing needs, inflation can raise borrowing costs. According to the Fisher Effect (Fisher (Reference Fisher1930)), nominal interest rates adjust with expected inflation. Central banks typically counter inflation by raising policy rates (Mishkin (Reference Mishkin1981)), which tighten credit conditions (Bernanke and Blinder (Reference Bernanke and Blinder1992)). Ippolito, Ozdagli, and Perez-Orive (Reference Ippolito, Ozdagli and Perez-Orive2018) describe this as the “floating-rate channel,” where monetary policy directly increases financing costs for firms with floating-rate loans. Kirti (Reference Kirti2020) further notes that banks favor floating-rate contracts, as they enable lenders to pass on rate hikes to borrowers. This, however, amplifies firms’ debt service burdens.Footnote 10
This dynamic is particularly relevant in global markets. According to the IMF (2023), in 45 countries, floating-rate debt accounts for more than half of total corporate borrowing, exposing firms to heightened sensitivity to rising interest rates. Furthermore, the IMF (2024) highlights a growing gap between existing coupon rates and prevailing refinancing yields. These developments call into question the generalizability of the sticky leverage channel across global markets, where floating-rate debt and refinancing pressures may dominate.
The second mechanism is operating rigidity (Gorodnichenko and Weber (Reference Gorodnichenko and Weber2016), Augustin et al. (Reference Augustin, Cong, Corhay and Weber2026)). While some firms can pass rising input costs, such as those for raw materials, energy, and labor, on to consumers and maintain their operating margins, others cannot. For these firms, escalating costs compress profit margins, weaken cash flows, and increase default risk. The effectiveness of cost pass-through is constrained by cash flow stickiness, which reflects nominal rigidities, a central concept in New Keynesian macroeconomics.
Nominal rigidity refers to the slow adjustment of prices in response to shocks, particularly in the short run, due to staggered price-setting, menu costs, informational frictions, contractual constraints, and behavioral inertia. Prior research (e.g., Nakamura and Steinsson (Reference Nakamura and Steinsson2008), Gorodnichenko and Weber (Reference Gorodnichenko and Weber2016)) provides robust evidence that firms struggle to adjust prices and revenues promptly in response to inflation, reinforcing the notion of sticky cash flows. When output prices are less flexible than input prices, inflation compresses margins by raising costs more than revenues, thereby reducing profitability and increasing default risk. Empirical studies also show that price rigidity varies substantially across firms, sectors, and countries (e.g., Galí, Gertler, and Lopez-Salido (Reference Galí, Gertler and Lopez-Salido2001), Pasten, Schoenle, and Weber (Reference Pasten, Schoenle and Weber2020), and Cho, Kim, and Kim (Reference Cho, Kim and Kim2023)).Footnote 11
Due to heterogeneity in factors such as leverage structure, debt maturity profiles, and pricing rigidity (IMF (2023, 2024), ECB (2024)), the dominance of one channel over the other varies across countries. As a result, the global relationship between inflation and firm credit risk remains an open empirical question determined by the interplay between debt-easing benefits and inflation-induced cost pressures. If the debt-rigidity channel dominates on average, we expect:
Hypothesis 1a. The global relationship between inflation and firm credit risk is on average negative.
Conversely, if inflation-induced cost pressures outweigh debt relief, then:
Hypothesis 1b. The global relationship between inflation and firm credit risk is on average positive.
B. The Convex Relationship between Inflation and Firm Credit Risk
In our framework, debt-rigidity and operating-rigidity channels jointly determine a convex U-shaped relationship between inflation and firm credit risk. Intuitively, at low to moderate inflation levels, the debt-rigidity channel dominates: inflation reduces the real value of nominal liabilities, alleviates financial constraints, and lowers the probability of default. Firms can incrementally adjust output prices without materially affecting demand.Footnote 12 In addition, nominal rigidities, such as fixed input contracts and sticky wages, can reduce real input costs, improving margins. However, as inflation rises, this dynamic reverses. The input-cost channel begins to dominate, driven by compounding frictions, such as disrupted supply chains, rising commodity prices, and wage pressures as workers seek to maintain real incomes.Footnote 13
Section A.1 of the Supplementary Material Appendix A formally shows that the interaction between debt rigidity and nonlinear operating-cost pressure can generate a turning point beyond which the inflation–credit risk relation becomes positive. The shift occurs via a convex cost function, where input costs rise at an increasing rate as inflation intensifies. Persistent inflation also erodes households’ real purchasing power, weakens demand, and compresses firms’ pricing power. As Mishkin (Reference Mishkin1981) emphasizes, high inflation undermines price stability and increases macroeconomic uncertainty, distorting investment and consumption.
Therefore, our framework motivates a convex inflation–credit risk relationship: the marginal effect of inflation may be weak or even negative at low inflation levels, but increasingly positive once inflation becomes sufficiently elevated. We do not treat this convexity as mechanically implied in all settings. Rather, it is a prediction that depends on the relative strength of the two channels and is therefore examined directly in the data. This framework also motivates our later heterogeneity tests, which assess whether the nonlinear pattern is more pronounced when firms face greater refinancing vulnerability, stronger pass-through constraints, or more fragile country-level institutional environments:
Hypothesis 2. At low levels of inflation, the relation tends to be negative, whereas at high inflation levels it becomes positive.
C. Leverage Stickiness, Cash Flow Stickiness, and Country-Level Characteristics
Our theoretical framework also highlights how firm- and country-level heterogeneity shapes the convex relationship between inflation and credit risk. Sections A.2 and A.3 of Supplementary Material Appendix A present the comparative statics showing that the inflation–credit risk relation becomes more positive when firms face greater refinancing vulnerability, stickier cash flows, and greater underlying cash flow uncertainty.
The framework shows that a central source of heterogeneity is debt stickiness, which determines the extent to which firms benefit from the debt-easing effects of inflation. In the baseline case with fixed nominal debt (i.e., sticky debt), moderate inflation reduces the real value of future debt obligations, improving creditworthiness, especially for highly leveraged firms. This benefit, however, depends critically on the extent to which debt payments are insulated from inflation and interest-rate adjustments. When coupon payments are fully indexed to inflation, the debt-rigidity channel vanishes because inflation raises nominal repayment obligations directly, producing a more monotonic increase in credit risk. With partial indexation, credit risk becomes more sensitive to inflation as the share of indexed debt rises. More generally, firms with less insulated debt structures are more exposed to the adverse financing consequences of inflation.
Empirically, firm-level data on inflation-indexed or floating-rate debt are often unavailable. We thus use the debt maturity structure as a proxy for inflation exposure, focusing on the share of short-term debt. Firms with more short-term debt face more frequent refinancing needs and are more exposed to increases in borrowing costs during inflationary periods. As inflation accelerates, these firms are more likely to experience tighter financial conditions and elevated credit risk.
The inflation–credit risk relation should also depend on the monetary regime in which firms operate. When monetary policy responds more aggressively to inflation, inflationary shocks are more likely to translate into higher policy rates, tighter borrowing conditions, and greater debt-servicing burdens. As a result, the relation between inflation and credit risk is expected to be more positive in countries where inflation feeds more strongly into policy-rate increases. This cross-country variation in monetary-policy responsiveness is one of the key comparative advantages of our global setting.
Hypothesis 3a. The positive relation between inflation and credit risk is stronger for firms with higher leverage and more short-term debt, and for firms operating in countries with more inflation-responsive monetary regimes.
The second key factor shaping the inflation–credit risk relationship is cash flow stickiness, that is, the extent to which a firm’s operating cash flows fail to keep pace with rising input costs. In our model, this arises when inflation-driven input cost increases outpace a firm’s ability to adjust output prices, often due to limited pricing power, rigid contracts, or highly elastic demand. A firm’s ability to pass through costs depends critically on market structure, product differentiation, and demand conditions. Firms with strong pricing power (e.g., due to brand strength, technological advantage, or customer loyalty) can better preserve margins during inflationary periods. In contrast, firms in highly competitive industries face rigid pricing constraints (Weber (Reference Weber2015)), limiting their ability to offset rising input costs.Footnote 14 This leads to margin compression, weakened cash flows, and increased credit risk. As a result, firms with greater cash flow stickiness exhibit a stronger sensitivity of credit risk to inflation.
To capture this idea empirically, we rely primarily on proxies for price flexibility. Specifically, we use a measure of industry-level price-change frequency constructed from Cavallo’s (Reference Cavallo2018) micro-price data. We complement this industry-level proxy with a firm-level measure of the responsiveness of cash flows to inflation. Together, these measures allow us to assess whether firms with more flexible pricing and less sticky cash flows are less exposed to inflation-induced credit risk.
Hypothesis 3b. The positive relation between inflation and credit risk is stronger for firms operating in industries with lower price flexibility and for firms whose operating cash flows do not keep pace with rising input costs.
Finally, we extend our analysis to country-level heterogeneity by incorporating macro-institutional heterogeneity.Footnote 15 Sections A.2 and A.3 of the Supplementary Material Appendix A show that greater underlying cash flow uncertainty amplifies the positive relation between inflation and credit risk. In the model, this appears as higher volatility of firm cash flows. Such higher volatility can arise in countries with weaker governance, lower transparency, and weaker contract enforcement, all of which increase cash flow volatility and reduce firms’ ability to absorb inflation-induced shocks, thereby increasing their default risk.Footnote 16 Thus, we expect:
Hypothesis 3c. The positive relation between inflation and credit risk is stronger in countries with weaker institutional environments.
Taken together, our theoretical framework predicts that the inflation–credit risk relation should become more positive when firms face greater refinancing vulnerability, more sticky operating cash flows, and greater underlying cash flow uncertainty. It also predicts that these forces should become more salient in high-inflation environments. Our empirical tests in Sections IV.B and IV.C are organized around these restrictions implied by theory. Notably, we interpret the corresponding heterogeneity variables as observed equilibrium outcomes that summarize firms’ financing and operating flexibility, rather than as exogenous primitives. We acknowledge that our model yields a set of qualitative empirical restrictions rather than a full structural mapping.
III. Data, Sample, and Summary Statistics
A. Data and Sample
We obtain CDS pricing data from Markit and focus on 5-year maturity contracts, which represent the most liquid segment of the CDS market. All selected contracts are written on senior debt. CDS spreads are converted from daily to annual frequency using the average value.Footnote 17 Inflation data and other country-level indicators are sourced from the World Bank, while firm-level data are obtained from Compustat and Compustat Global. Our final sample consists of 13,237 firm-year observations from 1,127 firms across 50 countries, covering the period from 2001 to 2022. This data set allows for a comprehensive analysis of the relation between inflation and corporate credit risk across diverse economic and institutional environments.Footnote 18
Table 1 presents the distribution of our sample firms by country. The sample is geographically diverse, and the distribution of firms varies widely across countries, with the largest representations from the United States (39.86%), Japan (19.84%), the United Kingdom (5.85%), Germany (3.81%), France (3.28%), and India (3.1%).

TABLE 1 Long description
The table contains five columns: Country, Number of Firms, percentage of firms, Number of Firm-Year, and percentage of firm-year.
Key data points include:
* United States: 450 firms (39.86 percent) and 5,225 firm-years (39.47 percent).
* Japan: 224 firms (19.84 percent) and 3,219 firm-years (24.32 percent).
* United Kingdom: 66 firms (5.85 percent) and 791 firm-years (5.98 percent).
* Germany: 43 firms (3.81 percent) and 569 firm-years (4.3 percent).
* France: 37 firms (3.28 percent) and 418 firm-years (3.16 percent).
* India: 35 firms (3.1 percent) and 312 firm-years (2.36 percent).
* Canada: 32 firms (2.83 percent) and 196 firm-years (1.48 percent).
* Australia: 27 firms (2.39 percent) and 231 firm-years (1.75 percent).
Other countries with significant representation include Korea (18 firms), Switzerland (16 firms), Hong Kong S A R China (16 firms), Brazil (13 firms), China (12 firms), and the Russian Federation (11 firms). Many countries, such as Bangladesh, Cote d’Ivoire, and Greece, are represented by a single firm.
The total sample consists of 1,127 firms and 13,237 firm-years, both totaling 100 percent.
Table 2 reports the level of inflation (i.e., Consumer Price Index headline inflation) by country and year within our sample. We find that different countries face significantly different inflation rates. The countries with the highest average inflation rates are Turkey (8.8%), Russia (8.74%), and Pakistan (7.59%), whereas the countries with the lowest inflation levels are Japan (0.23%), Switzerland (0.4%), and United Arab Emirates (0.66%). Regarding inflation trends by year, the highest levels were observed in 2022 (6.96%) and 2008 (5.3%). These spikes correspond to global financial crisis and the post-pandemic periods. Conversely, the lowest inflation levels were recorded in 2015 (1.44%) and 2020 (1.63%).

TABLE 2 Long description
The table is divided into two sections.
Panel A, Inflation by Country (%), contains 8 columns: Country, Mean, Std. Dev., P 5, P 25, P 50, P 75, and P 95. It lists 50 countries alphabetically. Notable data points include:
* Australia: Mean 2.67, Std. Dev. 1.26.
* Brazil: Mean 6.16, Std. Dev. 2.15.
* Japan: Mean 0.23, Std. Dev. 1.00.
* Pakistan: Mean 7.59, Std. Dev. 2.63.
* Russia: Mean 8.74, Std. Dev. 1.64.
* Turkey: Mean 8.80, Std. Dev. 1.37.
* United States: Mean 2.19, Std. Dev. 1.18.
Negative inflation values (deflation) are recorded in the P 5 column for countries like China (-0.73), Cote d’Ivoire (-1.11), and Greece (-1.31).
Panel B, Inflation by Year (%), contains 8 columns: Year, Mean, Std. Dev., P 5, P 25, P 50, P 75, and P 95. It covers the years 2001 through 2022. Key trends include:
* 2001: Mean 2.60.
* 2008: Mean 5.30, reflecting a peak during the global financial crisis.
* 2015: Mean 1.44, the lowest mean in the dataset.
* 2022: Mean 6.96, the highest mean in the dataset, with a P 95 value of 10.00.
Standard deviation remains relatively stable between 1.80 and 3.19 across all years.
Figure 2 presents a scatter plot which illustrates a positive relationship on average between average CDS spreads and inflation at the country-year level.
Figure 2 presents a scatter plot illustrating the relationship between average CDS spreads and inflation at the country-year level. The plot includes country-years with at least 10 firms.

FIGURE 2 Long description
The x-axis is labeled Inflation (percent) with a scale from 0 to 10. The y-axis is labeled C D S Spread (percent) with a scale from 0 to 10. The data points are represented by dark blue circles.
* The highest density of data points is concentrated in the lower-left quadrant, specifically where inflation is between 0 and 3 percent and C D S spreads are between 0.5 and 2.5 percent.
* There is a general upward trend moving from left to right, indicating that as inflation increases, the C D S spread tends to increase and become more volatile.
* Significant outliers appear at higher inflation levels. For example, at approximately 8 percent inflation, a data point reaches nearly 10 percent C D S spread.
* At the far right of the graph, near 10 percent inflation, the C D S spreads are widely dispersed, ranging from approximately 2 percent to 8 percent.
B. Summary Statistics
We control for a range of firm and country characteristics when examining the relation between inflation and corporate CDS spreads. At the firm-year level, our controls include firm size, leverage, return on assets, investment-grade credit rating status, and stock return volatility. At the country level, we control for GDP, GDP growth, private credit-to-GDP ratio, and the unemployment rate.Footnote 19 These characteristics have been identified as significant determinants of CDS pricing in previous studies (e.g., Ericsson et al. (Reference Ericsson, Jacobs and Oviedo2009), Lee et al. (Reference Lee, Naranjo and Sirmans2016), and Hasan et al. (Reference Hasan, Marra, To, Wu and Zhang2023)). Supplementary Material Appendix B provides detailed definitions of all variables.
Table 3 presents the descriptive statistics for our sample. The average firm in our sample has a CDS spread of 1.63% (163 basis points), log total assets of 9.27 (equivalent to total assets of $10,615 million), a leverage ratio of 29%, a ROA of 12% and stock return volatility of 2%. Additionally, 53% of firms carry investment-grade credit rating. The countries in our sample have an average inflation rate of 1.88%, GDP growth of 1.84%, credit-to-GDP ratio of 154%, and unemployment rate of 5.64%.

TABLE 3 Long description
The table is organized into three sections with columns for Mean, Std. Dev., P 5, P 25, P 50, P 75, and P 95.
Firm-level variables:
* C D S Spread sub t plus 1 (%): Mean 1.63, Std. Dev. 2.52, P 50 0.79.
* ln(Assets): Mean 9.27, Std. Dev. 1.39, P 50 9.23.
* Leverage: Mean 0.29, Std. Dev. 0.16, P 50 0.27.
* R O A: Mean 0.12, Std. Dev. 0.07, P 50 0.11.
* Investment grade: Mean 0.53, Std. Dev. 0.50, P 50 1.00.
* Stock volatility: Mean 0.02, Std. Dev. 0.01, P 50 0.02.
* Short-term debt/long-term debt: Mean 0.52, Std. Dev. 1.23, P 50 0.20.
* Beta (cash flow flexibility): Mean minus 0.03, Std. Dev. 3.25, P 50 0.00.
* R O A volatility: Mean 0.03, Std. Dev. 0.03, P 50 0.02.
* Delta C D S spread: Mean 0.06, Std. Dev. 1.15, P 50 minus 0.01.
* N U S-C R I probability of default (%): Mean 2.41, Std. Dev. 4.26, P 50 1.28.
Industry-level variables:
* Price change frequency: Mean 0.06, Std. Dev. 0.02, P 50 0.07.
* Lerner index: Mean 0.12, Std. Dev. 0.08, P 50 0.10.
Country-level variables:
* Inflation (%): Mean 1.88, Std. Dev. 1.90, P 50 1.64.
* ln(G D P): Mean 29.16, Std. Dev. 1.29, P 50 29.10.
* G D P growth (%): Mean 1.84, Std. Dev. 2.48, P 50 2.01.
* Credit to G D P (%): Mean 153.78, Std. Dev. 43.54, P 50 167.35.
* Unemployment rate (%): Mean 5.64, Std. Dev. 2.30, P 50 5.08.
* Beta (Monetary Regime): Mean 0.37, Std. Dev. 0.28, P 50 0.52.
* Rule of Law: Mean 1.38, Std. Dev. 0.49, P 50 1.53.
* Regulatory Quality: Mean 1.30, Std. Dev. 0.48, P 50 1.42.
* Government Effectiveness: Mean 1.42, Std. Dev. 0.46, P 50 1.52.
* Political Stability: Mean 0.54, Std. Dev. 0.55, P 50 0.58.
* Control of Corruption: Mean 1.34, Std. Dev. 0.58, P 50 1.40.
* Voice and Accountability: Mean 1.05, Std. Dev. 0.43, P 50 1.10.
* Emerging Markets: Mean 0.06, Std. Dev. 0.24, P 50 0.00.
IV. Empirical Results
This section presents our empirical results. Section IV.A reports the baseline findings for the global sample, including instrumental variable estimates. Section IV.B tests the convexity of the inflation–credit risk relationship. In Section IV.C, we examine how this relationship varies with firm-level debt and cash flow stickiness, as well as country-level financial and institutional environments. Section IV.D analyzes the relation between inflation and credit risk across the CDS term structure. Section IV.E presents results for the U.S. sample and various robustness checks. Finally, Section IV.F validates our findings using forward-looking default probabilities.
A. Baseline Findings
1. Baseline Regression Results
To examine the relation between inflation and corporate CDS spreads, we estimate the following model:

where c denotes country, j denotes industry, i denotes firm, and t denotes year. The dependent variable,
$CDS\_{Spread}_{i,t+1}$
 , represents the average CDS spread of Firm i in Year t + 1. The key independent variable,
${Inflation}_{c,t}$
 , measures the annual inflation rate in Year t in the headquarter country of Firm i.
${Z}_{i,c,t}$
 includes firm and country characteristics that may influence a firm’s CDS spreads. We control for industry-by-year fixed effects
${Industry}_j{Year}_t$
 to account for time-varying differences across industry groups over time, and firm fixed effects
${Firm}_i$
 to control for time-invariant firm-specific factors. Standard errors are clustered at the country level to account for potential correlations in the error terms across firms within the same country.
We begin with an unconditional regression without control variables and fixed effects. Column 1 of Table 4 presents the results. We find a positive and significant relationship between inflation and firm CDS spreads in the subsequent year at the 1% level, suggesting that the operating-rigidity channel on average dominates the sticky leverage channel in our global sample.

TABLE 4 Long description
A data table with 5 columns labeled 1 through 5, all predicting C D S Spread at time t plus 1.
Independent Variables:
* Inflation: Coefficients range from 0.112 to 0.342, all significant at the 1 percent or 5 percent level. T-statistics are in parentheses below each coefficient.
* ln Assets: Coefficients range from minus 0.077 to minus 0.221, significant at the 5 percent or 10 percent level in models 3 through 5.
* Leverage: Positive coefficients from 2.206 to 3.320, all significant at the 1 percent level.
* R O A: Negative coefficients from minus 4.374 to minus 5.278, all significant at the 1 percent level.
* Investment grade: Negative coefficients from minus 0.491 to minus 1.087, significant at the 1 percent or 10 percent level.
* Stock volatility: Positive coefficients from 17.458 to 43.896, significant at the 1 percent or 5 percent level.
* ln G D P: Significant only in model 4 at minus 1.278.
* G D P growth: Significant only in model 3 at 0.080.
* Credit to G D P: Coefficients are small (0.002 to 0.004) and not statistically significant.
* Unemployment rate: Significant only in model 3 at 0.087.
Fixed Effects (F E):
* Country F E: Yes in model 4 only.
* Firm F E: Yes in model 5 only.
* Industry-Year F E: Yes in models 2 through 5.
Summary Statistics:
* N: 13,237 for all models.
* Adjusted R-squared: Increases from 0.054 in model 1 to 0.709 in model 5.
Next, in column 2, we introduce industry-by-year fixed effects to control for industry-specific economic shocks. The positive relationship between inflation and CDS spreads remains significant at the 1% level. In column 3, we add firm-level and country-level controls, and the positive relation persists, still significant at the 1% level. In column 4, we incorporate country fixed effects to focus on within-country variation, finding that inflation continues to exhibit a significant positive relation with CDS spreads at the 5% level. Importantly, in column 5, we include firm fixed effects to examine within-firm variation, where inflation’s positive relationship with CDS spreads is again significant at the 1% level. The coefficient estimates on the control variables generally exhibit the expected signs. In particular, higher CDS spreads are associated with firms that are smaller in size, more highly leveraged, less profitable, rated below investment grade, and exhibit greater stock return volatility.
In economic terms, after controlling for firm fixed effects and industry-year fixed effects, column 5 suggests that a 1-standard-deviation increase in inflation (i.e., 1.9%) in a firm’s headquarter country is, on average, associated with a 21-basis-point increase in CDS spreads in the following year (i.e., 0.112 × 1.9%). This corresponds to a 13% increase relative to the sample mean of 163 basis points and amounts to about 8% of the overall sample standard deviation of CDS spreads (252 basis points).
In addition, we compare the 21-basis-point estimate with three relevant benchmarks. First, it amounts to roughly 20% of the average within-firm time-series standard deviation of CDS spreads, which is 104 basis points. Second, relative to the cross-country standard deviation of average CDS spreads (210 basis points), it represents about 10% of the variation across countries. Third, compared with typical movements in monetary policy, measured as an average absolute annual change in policy rates of 65 basis points, it is approximately one-third as large. Taken together, these comparisons suggest that the relation between inflation and CDS spreads is economically meaningful.
2. Identification
A potential endogeneity concern in our baseline analysis is omitted variable bias. Although we control for a comprehensive set of firm- and country-level characteristics, as well as firm fixed effects and industry-by-year fixed effects, unobserved time-varying shocks, such as macroeconomic policy shifts or firm-specific hedging strategies, may still be correlated with both inflation and corporate CDS spreads, potentially biasing our estimates.
To address this concern, we follow Oster (Reference Oster2019) to assess sensitivity to omitted variable bias under proportional selection (e.g., see Bachmann, Born, Goldfayn-Frank, Kocharkov, Luetticke, and Weber (Reference Bachmann, Born, Goldfayn-Frank, Kocharkov, Luetticke and Weber2021)). Because our preferred specification includes firm and industry-by-year fixed effects, we implement the test using a baseline model that retains these same fixed effects but excludes observable controls. We then compare this baseline to the fully specified model, so that the only difference between the two specifications is the inclusion of observable controls. As reported in Supplementary Material Appendix C.1, the implied Oster coefficient δ required to explain away the estimated δ is negative (i.e., −0.72). This arises because the estimated coefficient on inflation remains essentially unchanged, and even increases slightly, when controls are added (0.112 compared to 0.107). This finding helps alleviate the concern that omitted variables would attenuate the estimated effect.
To further address the endogeneity concern, we employ an instrumental variable (IV) strategy, using two global cost-shock proxies as instruments for inflation: WTI crude oil prices and the Baltic Dry Index (BDI). Both instruments transmit inflationary pressures primarily through their effects on input costs—with crude oil serving as a critical input for production and transportation, and the BDI reflecting global shipping and logistics expenses.Footnote 20 These cost components directly contribute to inflation, thereby satisfying the relevance condition for valid instruments. Conditional on firm characteristics, macroeconomic controls, and firm fixed effects, fluctuations in oil prices or shipping costs are less likely to affect a firm’s CDS spread through channels other than inflation, although we do not view the exclusion restriction as airtight. Global cost shocks may also affect corporate credit risk through broader macroeconomic channels, such as investor sentiment, consumption, aggregate demand, or wider disruptions in global economic conditions. Accordingly, we interpret the IV results cautiously and view them as supplementary evidence supporting our baseline findings rather than as a definitive source of causal identification.
Table 5 reports the results from the two-stage least squares (2SLS) regression analysis. The first-stage results of Panel A in columns 1 and 2 confirm that both instruments are strongly and significantly associated with inflation.Footnote 21 In the second stage, the coefficient estimate on instrumented inflation remains statistically significant at the 1% level, consistent with our baseline finding of a positive relation between inflation and corporate credit risk.

TABLE 5 Long description
Panel A presents 2 S L S regressions using W T I Crude Oil Price and Baltic Dry Index as instruments. In the first stage (Column 1), W T I Crude Oil Price has a coefficient of 0.023 and Baltic Dry Index has 0.098. In the second stage (Column 2), Inflation has a coefficient of 0.552 on C D S Spread sub t plus 1. Columns 3 and 4 use refined instruments (Beta 1 times W T I and Beta 2 times Baltic Dry Index), showing an Inflation coefficient of 0.547 in the second stage. Panel B excludes countries with large oil exposure (top decile in Columns 1 to 4 and top quintile in Columns 5 to 8). In the top decile exclusion, the second stage Inflation coefficient is 0.519 (Column 2) and 0.399 (Column 4). In the top quintile exclusion, the second stage Inflation coefficient is 0.521 (Column 6) and 0.365 (Column 8). All panels include control variables and firm fixed effects (F E), with industry-year F E included in the refined instrument columns. Cragg-Donald Wald F statistics are high across all first stages, indicating strong instruments.
To further strengthen our identification strategy, we incorporate country-specific exposure to oil prices and shipping costs. Countries vary considerably in their dependence on oil imports and global shipping, leading to heterogeneity in how global cost shocks pass through to domestic inflation. We exploit this cross-country variation to construct instruments that vary across both time and space. Specifically, we compute two country-level inflation betas by regressing national inflation on WTI crude oil prices and the Baltic Dry Index, respectively, capturing each country’s sensitivity to oil price shocks changes in global shipping costs.
We interact each beta with its respective global shock to create two refined instruments: oil beta × WTI oil price and shipping beta × BDI. To account for sector-specific inflation sensitivity, we also include industry-by-year fixed effects in our 2SLS regressions. The second-stage results of the 2SLS regressions in columns 3 and 4 of Panel A remain statistically significant at the 1% level, consistent with a positive relation between the exogenous component of inflation and future CDS spreads.
In Panel B of Table 5, we exclude countries with unusually high macroeconomic exposure to oil price fluctuations. In such economies, oil prices may affect CDS spreads through broader macroeconomic channels beyond inflation, thereby weakening the exclusion restriction. To identify these countries, we estimate country-level regressions of GDP growth on oil prices and use the resulting oil-price sensitivity (beta) as a measure of macroeconomic oil exposure. We then exclude countries whose absolute beta lies in the top decile of the distribution and, alternatively, in the top quintile.Footnote 22 We reestimate the IV specification on these restricted samples. The results, reported in Panel B, remain qualitatively similar to our baseline IV findings, providing a partial check that the findings are not solely driven by countries with unusually high macroeconomic sensitivity to oil-price shocks, although they do not fully resolve exclusion-restriction concerns.
In summary, our 2SLS findings provide supplementary evidence consistent with a positive relation between inflation and corporate credit risk, but we interpret these results cautiously and place greater weight on the broader set of baseline and robustness analyses.
B. The Convexity of the Inflation–Credit Risk Relationship
To test Hypothesis 2 (i.e., the convex relationship between inflation and corporate credit risk), we employ two empirical strategies, with results presented in Table 6. First, we include both the linear and squared terms of inflation in our regression model. Columns 1 and 2 show that the coefficient on the linear term is negative and marginally significant at the 10% level, while the coefficient on the squared term is positive and highly significant at the 1% level, supporting Hypothesis 2. The empirical results indicate a convex relationship: when inflation is below the inflection point of 1.29% (calculated as 1.29 = 0.067/(2 × 0.026)), the relationship between inflation and credit risk is negative. However, once inflation surpasses this threshold, the relation turns positive and becomes increasingly more positive as inflation rises.

TABLE 6 Long description
A regression table with four columns labeled 1 through 4, all predicting C D S Spread at time t plus 1.
* Inflation: Model 1 shows minus 0.063 (t-stat minus 1.723); Model 2 shows minus 0.067 (t-stat minus 1.829). Both are significant at the 10 percent level.
* Inflation-squared: Model 1 shows 0.025 (t-stat 5.556); Model 2 shows 0.026 (t-stat 4.623). Both are significant at the 1 percent level.
* High Inflation: Model 3 shows 0.110 (t-stat 3.099); Model 4 shows 0.117 (t-stat 2.995). Both are significant at the 1 percent level.
* Medium Inflation: Model 3 shows 0.058 (t-stat 1.062); Model 4 shows 0.073 (t-stat 1.170).
* Low Inflation: Model 3 shows minus 0.011 (t-stat minus 0.201); Model 4 shows minus 0.016 (t-stat minus 0.292).
* Control Variables (Models 2 and 4): ln(Assets) is negative and significant; Leverage is positive and significant (2.164 and 2.193); R O A is negative and significant (minus 4.367 and minus 4.387); Investment grade is negative and significant; Stock volatility is positive and significant (17.732 and 17.523). G D P controls (ln(G D P), G D P growth, Credit to G D P, and Unemployment rate) are generally not significant.
* Fixed Effects: All models include Firm F E and Industry-Year F E.
* Statistics: N equals 13,237 for all models. Adjusted R-squared ranges from 0.693 to 0.711.
Second, we estimate a spline regression by dividing inflation into terciles: Low Inflation, Median Inflation, and High Inflation. Each spline variable equals the inflation value if inflation falls within the corresponding tercile, and 0 otherwise. As shown in columns 3 and 4, the coefficient on Low Inflation is negative but statistically insignificant, while Median Inflation is positive but also insignificant. Importantly, only High Inflation exhibits a statistically significant and positive relation with CDS spreads at the 1% level. These results further support the nonlinear, convex relationship between inflation and corporate credit risk. At low inflation levels, firms may benefit from moderate price increases through a “sticky leverage” mechanism, as rising inflation reduces the real burden of nominal debt. However, at high inflation levels, surging input costs and financial tightening outweigh these benefits, leading to higher credit risk.
Visually, Figure 3 presents a plot of CDS spreads with a smooth convex curve (estimated using kernel-weighted local polynomial regression) across deciles based on the level of inflation in the firm’s headquarter country, where decile 1 contains the observations with the lowest inflation and decile 10 contains the observations with the highest inflation. Consistent with our regression results, the figure reveals a clear convex relationship between inflation and CDS spreads: the relation is negative at low inflation levels (deciles 1–3), remains relatively flat at intermediate inflation levels (deciles 4–7), and becomes markedly more positive at higher levels (deciles 8–10).
Figure 3 presents a scatter plot of CDS spreads with a smooth convex curve across deciles based on the level of inflation in the firm’s headquarter country, where decile 1 contains the observations with the lowest inflation and decile 10 contains the observations with the highest inflation.

FIGURE 3 Long description
The horizontal X-axis is labeled Inflation Deciles (Low to High) with tick marks from 1 to 10. The vertical Y-axis is labeled C D S Spread (%) with values ranging from 1 to 3 in increments of 0.5.
Ten teal circular data points are plotted across the deciles. A dark red smoothed curve is overlaid, divided into three segments.
* Deciles 1 to 3: The curve shows a slight initial dip, with data points starting at approximately 1.25% at decile 1 and dropping to just below 1% at decile 3.
* Deciles 4 to 7: The curve rises in a convex arc. Data points increase from 1.3% at decile 4 to approximately 1.7% at decile 7.
* Deciles 8 to 10: The curve shows a sharp upward acceleration. The data point at decile 8 is at 1.9%, decile 9 is at 2.05%, and decile 10 reaches the peak at 3.0%.
A legend at the bottom identifies the teal circles as Data Points and the dark red line as the Smoothed Curve.
C. Heterogeneity in Leverage Stickiness, Cash Flow Stickiness, and Institutional Factors
1. Leverage, Short-term Debt, and Monetary Regimes
Next, we test Hypothesis 3a. We anticipate that the inflation effect on credit risk is more pronounced for firms with higher leverage and a higher proportion of short-term debt relative to long-term debt, as these firms face greater refinancing needs.Footnote 23 We interpret leverage and debt maturity here as observed equilibrium features of firms’ financing structures that summarize their refinancing vulnerability, rather than as exogenous choices. In this sense, the tests are designed to assess whether the observed cross-sectional variation in financing rigidity affects the inflation–credit risk relation in the direction implied by the conceptual framework.
We first interact firm leverage with inflation to assess the relation between inflation and CDS spreads, conditional on a firm’s leverage level. The results, presented in column 1 of Panel A of Table 7, show that the relation between inflation and CDS spreads is more substantial for highly leveraged firms. The economic magnitude is large. A 1-standard-deviation increase in inflation is, on average, associated with an incremental increase of 15 basis points in 1-year-ahead CDS spreads (i.e., 1.9 × 0.368 × (0.39–0.18)) when a firm’s leverage increases from the 25th percentile to the 75th percentile.

TABLE 7 Long description
The table is divided into two sections, Panel A and Panel B, both using C D S Spread sub t plus 1 as the dependent variable across three numbered columns.
Panel A: Inflation Levels and C D S Spreads Conditional on Debt Stickiness.
* Column 1 shows a positive interaction for Inflation times Leverage at 0.368 with a t-statistic of 3.800.
* Column 2 shows a positive interaction for Inflation times Short-Term Debt / Long-Term Debt at 0.019 with a t-statistic of 2.265.
* Column 3 shows a positive interaction for Inflation times Beta (Monetary Regime) at 0.161 with a t-statistic of 2.150.
* Control variables across all columns include Leverage (positive and significant), l n (Assets) (negative and significant), R O A (negative and significant), and Stock Volatility (positive and significant).
* Model statistics: N ranges from 13,018 to 13,237; Adjusted R-squared is approximately 0.71.
Panel B: Inflation Terciles and C D S Spreads Conditional on Debt Stickiness.
* Column 1: High Inflation times Leverage is 0.400 (t-stat 4.200), while Medium and Low Inflation interactions are not significant.
* Column 2: High Inflation times Short-Term Debt / Long-Term Debt is 0.021 (t-stat 2.446).
* Column 3: High Inflation times Beta (Monetary Regime) is 0.131 (t-stat 1.747).
* Control variables show similar trends to Panel A, with R O A and Investment Grade status showing negative correlations with C D S spreads.
* Both panels include Firm and Industry-Year Fixed Effects (F E).
Next, we examine how debt maturity affects the relationship between inflation and credit risk by interacting the ratio of short-term debt to long-term debt (i.e., Short-Term Debt/Long-Term Debt) with inflation. The results in column 2 indicate that firms with a higher ratio of short-term to long-term debt exhibit a stronger positive relation between inflation and CDS spreads, supporting the idea that greater refinancing needs are associated with greater vulnerability to inflation-related financing pressures.Footnote 24
We further hypothesize that the positive relation between inflation and credit risk is more pronounced in countries operating under inflation-targeting monetary regimes. The underlying mechanism is that central banks in such regimes are more likely to respond to increases in inflation by raising policy rates, thereby increasing firms’ cost of funding and, in turn, credit risk. To proxy for the extent of inflation targeting, we estimate country-level regressions of domestic policy rates (sourced from the IMF) on inflation and obtain the corresponding sensitivity, Beta (Monetary Regime). Countries with higher Beta (Monetary Regime) are interpreted as exhibiting stronger inflation-targeting behavior, as their monetary policy responds more aggressively to inflation fluctuations. We then interact this beta with inflation in our baseline specification. The results, reported in column 3 of Panel A, indicate that the relation between inflation and CDS spreads is significantly stronger in countries with more inflation-responsive monetary regimes, consistent with our hypothesis.
In Panel B of Table 7, we further interact inflation terciles (i.e., Low Inflation, Median Inflation, and High Inflation) with Leverage, Beta (Monetary Regime), and Short-Term Debt/Long-Term Debt in columns 1–3, respectively. The interaction terms are statistically significant only in the high-inflation tercile. These findings support our prediction that firms with higher leverage and greater refinancing needs, and firms operating in countries with more inflation-responsive monetary regimes, are more vulnerable to inflation-induced credit risk, particularly in high-inflation environments.
2. Cash Flow Stickiness
When assessing the relation between inflation and corporate credit risk via the operating-rigidity channel, it is important to recognize that firms with sticky cash flows are particularly vulnerable. Sticky cash flows occur when a firm’s cash flows fail to rise, or even fall, in response to inflation, due to weak pricing power and inflexible cost structures. As articulated in Hypothesis 3b, we expect the relation between inflation and credit risk to be more positive for firms with greater cash flow stickiness.
To test this mechanism, we first construct a direct measure of industry-level price flexibility using the online micro-price data of Cavallo (Reference Cavallo2018). This data set contains daily product-level prices from four large U.S. retailers (i.e., a supermarket, a department store, a drugstore, and an electronics retailer) over the period 2008 to 2010. For each product, we compute the frequency of price changes, defined as the number of days with a price change divided by the total number of observed days for that product. Each product is classified using COICOP codes. Following official UN correspondence tables, we map COICOP codes to ISIC classifications and then to NAICS industries. We then assign each 3-digit NAICS industry a dominant COICOP category based on the modal mapping, thereby constructing industry-level measures of price flexibility.
Although this measure is derived from U.S. micro-price data over a relatively short period, we use it only as an industry-level proxy for relative price flexibility. The rationale is that repricing flexibility partly reflects product-market characteristics that are often shared across broad industries, even though the absolute degree of price rigidity may vary across countries and over time. We therefore apply this industry-level measure across our full sample, implicitly assuming that relative differences in price flexibility across industries are reasonably stable across countries and over time. Industries with above-median price-change frequency are classified as having lower price stickiness, that is, greater price flexibility.
We interact this indicator with inflation and report the results in column 1 of Panel A in Table 8. The negative interaction implies that the positive relation between inflation and CDS spreads is weaker in industries with greater repricing flexibility. Economically, this suggests that firms operating in such industries are better able to pass rising input costs through to customers and thereby protect operating margins during inflationary periods.

TABLE 8 Long description
The image consists of two panels, Panel A and Panel B, each containing a regression table with two columns labeled 1 and 2. The dependent variable for all columns is C D S Spread sub t plus 1.
Panel A: Inflation Levels and C D S Spreads Conditional on Cash Flow Stickiness.
* Inflation times High Frequency of Price Change: Column 1 has a coefficient of minus 0.099 with a t-statistic of minus 1.968.
* Inflation times Beta (Cash Flow Flexibility): Column 2 has a coefficient of minus 0.022 with a t-statistic of minus 2.781.
* Inflation: Column 1 is 0.133 (t-stat 2.303); Column 2 is 0.113 (t-stat 2.906).
* Control variables include ln(Assets), Leverage, R O A, Investment grade, Stock volatility, ln(G D P), G D P growth, Credit to G D P, and Unemployment rate. Significant coefficients are noted for Leverage (positive) and R O A (negative).
* Fixed Effects: Both columns use Firm F E. Column 1 uses N A I C S 3-Year F E, while Column 2 uses S I C 2-Year F E.
* Observations (N): Column 1 has 7,032; Column 2 has 13,237. Adjusted R-squared is approximately 0.71.
Panel B: Inflation Terciles and C D S Spreads Conditional on Cash Flow Stickiness.
* High Inflation times High Frequency of Price Change: Column 1 is minus 0.117 (t-stat minus 2.505).
* High Inflation times Beta (Cash Flow Flexibility): Column 2 is minus 0.020 (t-stat minus 2.121).
* High Inflation: Column 1 is 0.138 (t-stat 2.356); Column 2 is 0.118 (t-stat 3.022).
* Medium and Low Inflation interactions are generally not statistically significant.
* Control variables and Fixed Effects remain consistent with Panel A.
* Observations (N): Column 1 has 7,032; Column 2 has 13,237. Adjusted R-squared is approximately 0.71.
Next, we construct a firm-level measure of cash flow stickiness by estimating firm-specific sensitivities of cash flows to inflation. Firms with higher sensitivity (beta) exhibit greater cash flow responsiveness to inflation, indicating lower cash flow stickiness and higher cash-flow flexibility. We interact this beta with inflation and present the results in column 2. The negative interaction indicates that the positive inflation–credit risk relation is attenuated for firms whose operating cash flows respond more favorably to inflation. This pattern is consistent with the idea that more flexible cash flows help firms absorb inflation-driven cost shocks.
Panel B of Table 8 further explores heterogeneity by interacting inflation terciles with the cash flow stickiness measures. The results show that the interactions between High Inflation and the two cash flow stickiness measures are both negative and significant. This finding reinforces the notion that firms with greater pricing power are better able to withstand the adverse credit effects of inflation, particularly in high-inflation environments.Footnote 25
To summarize, our findings show that inflation-induced credit risk is more pronounced for firms operating in industries with lower price flexibility and for firms whose operating cash flows do not keep pace with rising input costs. This moderating effect is particularly strong in high-inflation environments. The measures we employ capture, to some extent, equilibrium differences in firms’ pricing and operating flexibility. Although we do not explicitly model endogenous firm choices, the results suggest that the observed equilibrium heterogeneity in cash flow responsiveness affects the inflation–credit risk relationship in the predicted direction.
3. Interaction between Leverage Stickiness and Cash Flow Stickiness
We next examine the joint effects of debt rigidity and cash flow stickiness to assess whether these two mechanisms reinforce or offset each other in shaping the relation between inflation and corporate credit risk. The preceding analyses consider these channels separately. Here, we bring them together to test whether the positive inflation–credit risk relation is strongest when firms are simultaneously more exposed to refinancing pressure and less able to absorb rising input costs through price adjustment.
To do so, we sort firms into four groups based on debt stickiness and cash flow stickiness: i) low debt stickiness and high cash flow stickiness, where both channels predict a stronger inflation-induced increase in CDS spreads; ii) high debt stickiness and high cash flow stickiness; iii) low debt stickiness and low cash flow stickiness; and iv) high debt stickiness and low cash flow stickiness, where both channels predict a weaker effect. If the two mechanisms reinforce one another, we expect the first group to exhibit the strongest sensitivity of CDS spreads to inflation, while the fourth group should exhibit the weakest sensitivity.
We classify firms as having low debt stickiness when they have high leverage and a high ratio of short-term debt to long-term debt (both above the sample median), as these firms face greater refinancing vulnerability when inflation translates into tighter borrowing conditions. We classify firms as having high cash flow stickiness when they exhibit low price-change frequency based on the Cavallo (Reference Cavallo2018) price-flexibility measure, indicating a more limited ability to pass rising input costs through to output prices.
Panel A of Table 9 reports the baseline interaction results. We find that the coefficient estimate on inflation is positive and statistically significant at the 5% level for the group with low debt stickiness and high cash flow stickiness, and this group also exhibits the largest coefficient estimate (0.143). By contrast, the coefficient estimate (0.019) is smallest in magnitude and statistically insignificant for the group with high debt stickiness and low cash flow stickiness. The two intermediate groups lie between these extremes. These findings are consistent with the view that the refinancing-vulnerability channel and the cash flow stickiness channel reinforce one another in shaping firms’ inflation exposure.

TABLE 9 Long description
The table is divided into Panel A and Panel B, both analyzing C D S Spread sub t plus 1 across four firm categories: 1. Low Debt Stickiness and High Cash Flow Stickiness; 2. High Debt Stickiness and High Cash Flow Stickiness; 3. Low Debt Stickiness and Low Cash Flow Stickiness; 4. High Debt Stickiness and Low Cash Flow Stickiness.
Panel A: Joint Effects using Continuous Inflation.
* Inflation: Column 1 shows 0.143** (2.454); Column 2 shows 0.120* (1.943); Column 3 shows 0.037 (0.464); Column 4 shows 0.019 (0.713).
* Control variables include ln(Assets), Leverage, R O A, Investment grade, Stock volatility, ln(G D P), G D P growth, Credit to G D P, and Unemployment rate.
* Fixed Effects: Firm F E and Industry-Year F E are applied (Y) across all columns.
* Observations (N): 1028, 3409, 428, and 1650 respectively.
* Adjusted R-squared: Ranges from 0.710 to 0.841.
Panel B: Joint Effects using Inflation Terciles.
* High Inflation: Column 1 shows 0.169*** (3.116); Column 2 shows 0.120* (1.975); Column 3 shows 0.065 (0.861); Column 4 shows 0.009 (0.329).
* Medium Inflation: Column 1 shows -0.174 (-1.256); Column 2 shows 0.184* (2.012); Column 3 shows 0.233* (1.820); Column 4 shows -0.080** (-2.651).
* Low Inflation: Column 1 shows -0.405 (-1.681); Column 2 shows 0.049 (0.473); Column 3 shows -0.280 (-1.078); Column 4 shows 0.081* (1.959).
* Control variables and Fixed Effects remain consistent with Panel A.
* Adjusted R-squared: Ranges from 0.711 to 0.841.
In Panel B of Table 9, we further estimate spline regressions for each group to assess whether this interaction is more pronounced in different inflation regimes. The results show that the coefficient estimate on High Inflation is positive and statistically significant at the 1% level for the group with low debt stickiness and high cash flow stickiness, whereas the corresponding coefficient estimates are weaker and generally insignificant for the other groups. This pattern suggests that the interaction between the two channels becomes more salient when inflation is high, which is consistent with the convex relationship documented earlier. In other words, when inflation reaches elevated levels, firms that are simultaneously more exposed to refinancing pressure and less able to pass through rising input costs experience the strongest increase in credit risk.
Overall, we document supportive evidence that debt rigidity and operating cash flow stickiness jointly shape the relation between inflation and corporate credit risk. The inflation effect is strongest when both mechanisms point toward greater vulnerability and weakest when both point toward greater insulation. These results complement the separate analyses in the previous sections and are consistent with our interpretation that the relation between inflation and credit risk is jointly shaped by debt and operating rigidities.
4. Country-Level Institutional Environments
Our theoretical framework predicts that the positive relation between inflation and credit risk is stronger in countries with weaker institutional environments (Hypothesis 3c). To measure institutional quality, we draw on several indicators from the World Bank Governance Indicators, originally developed by Kaufmann, Kraay, and Mastruzzi (Reference Kaufmann, Kraay and Mastruzzi2009), including Rule of Law, Regulatory Quality, Government Effectiveness, Political Stability, Control of Corruption, and Voice and Accountability.
-
• The Rule of Law index reflects perceptions of the quality of contract enforcement, police, courts, and the prevalence of crime and violence.
-
• The Regulatory Quality index measures perceptions of the government’s ability to formulate and implement sound policies and regulations that enable private sector development.
-
• The Government Effectiveness index assesses the quality of public services and the formulation and implementation of policy.
-
• The Political Stability index captures perceptions of a country’s political stability.
-
• The Control of Corruption index measures perceptions of the extent to which public power is exercised for private gain.
-
• The Voice and Accountability index reflects the degree to which citizens can participate in selecting their government, and the extent of freedom of expression, association, and media.
We interact inflation with each institutional quality indicator to examine how these factors moderate the relationship between inflation and credit risk. Table 10 shows that interaction terms are all negative and statistically significant, suggesting that the positive relation between inflation and credit risk is stronger in countries with weaker institutional environments. For example, a 1-standard-deviation increase in inflation is, on average, associated with an incremental increase of 5 basis points in 1-year-ahead CDS spreads (i.e., 1.9 × 0.1 × (1.61–1.34)) when the rule of law index shifts from the 75th percentile to the 25th percentile.

TABLE 10 Long description
A regression table with 6 columns labeled 1 through 6, all predicting C D S Spread sub t plus 1.
Interaction Terms (Rows 1-12):
- Inflation times Rule of Law: -0.100 (t-stat -3.624) in Model 1.
- Inflation times Regulatory Quality: -0.115 (t-stat -3.393) in Model 2.
- Inflation times Government Effectiveness: -0.108 (t-stat -2.811) in Model 3.
- Inflation times Political Stability: -0.069 (t-stat -2.606) in Model 4.
- Inflation times Control of Corruption: -0.099 (t-stat -3.951) in Model 5.
- Inflation times Voice and Accountability: -0.071 (t-stat -3.518) in Model 6.
Main Institutional Effects (Rows 13-24):
- Rule of Law: -0.237 (Model 1).
- Regulatory Quality: 0.142 (Model 2).
- Government Effectiveness: 0.226 (Model 3).
- Political Stability: 0.291 (Model 4).
- Control of Corruption: 0.237 (Model 5).
- Voice and Accountability: 0.288 (Model 6).
Key Variables and Controls:
- Inflation: Positive coefficients ranging from 0.123 to 0.215, all significant at the 1% level across all models.
- ln Assets: Negative coefficients around -0.23, significant at the 10% level.
- Leverage: Positive coefficients around 2.2, significant at the 1% level.
- R O A: Negative coefficients around -4.4, significant at the 1% level.
- Stock volatility: Positive coefficients around 17.5, significant at the 5% level.
- Macroeconomic controls (ln G D P, G D P growth, Credit to G D P, Unemployment rate) are generally not statistically significant.
Model Statistics:
- Firm F E and Industry-Year F E are included (Y) in all models.
- N = 13,237 for all models.
- Adjusted R super 2 is approximately 0.710 for all models.
In summary, our findings indicate that the positive relation between inflation and credit risk is stronger for firms in countries with weaker institutional environments. This evidence is consistent with the model’s prediction that greater underlying uncertainty and weaker shock-absorption capacity make the inflation–credit risk relation more pronounced.Footnote 26
D. CDS Term Structure
In our previous analyses, we focus on 5-year maturity CDS contracts, which are widely regarded as the benchmark in the CDS market. In this section, we broaden our analysis to assess the relation between inflation and CDS spreads across a range of maturities, from 6 months to 30 years. We anticipate a more pronounced relation at shorter maturities, reflecting stronger nominal price rigidity in the goods market in the short run, which limits firms’ ability to pass input-cost pressures onto consumers. Moreover, inflationary shocks are more likely to trigger immediate market expectations of operational disruptions and tighter monetary policy (such as interest rate hikes) that are associated with higher near-term borrowing costs.
Table 11 presents the results. We observe that the relationship between inflation and CDS spreads remains positive across the CDS term structure. The relation peaks at the 2-year maturity and gradually declines for longer maturities, though it remains statistically significant up to 7 years. These results suggest that the inflation–credit risk relation is strongest at short to medium maturities, while remaining statistically significant across a broader portion of the CDS term structure.

TABLE 11 Long description
The table presents regression results for C D S spreads at 11 different maturities: 6-month, 1-year, 2-year, 3-year, 4-year, 5-year, 7-year, 10-year, 15-year, 20-year, and 30-year.
Key variables and their coefficients include:
* Inflation: Shows a positive and statistically significant relationship with shorter-term C D S spreads. Coefficients range from 0.074 at 6 months to 0.085 at 2 years, both significant at the 1 percent level. Significance decreases at longer maturities, becoming non-significant from 10 years onward.
* Leverage: Consistently positive and highly significant at the 1 percent level across all maturities, with coefficients increasing from 1.756 at 6 months to over 3.000 for maturities of 4 years and longer.
* R O A: Consistently negative and highly significant at the 1 percent level across all maturities, with coefficients ranging from -2.618 to -4.146.
* Stock volatility: Positive and significant across all maturities, with the highest coefficient of 12.633 at the 4-year maturity.
* Other controls: ln Assets, Investment grade status, ln G D P, G D P growth, Credit to G D P, and Unemployment rate generally show statistically insignificant relationships across the term structure.
Fixed Effects for Firm and Industry-Year are included for all models. The number of observations is constant at 6715. Adjusted R-squared values increase with maturity, starting at 0.531 for 6-month spreads and reaching 0.723 for 30-year spreads.
E. Robustness Tests
1. Inflation Expectations, Inflation Surprises, and Inflation Volatility
We perform a battery of robustness checks on the relation between inflation and CDS spreads. First, we examine whether our results are driven by realized inflation, inflation forecasts, inflation surprises, or inflation volatility. To do so, we construct 4 year-t inflation-related measures that are used to predict CDS spreads in year t + 1. Inflation is the realized (actual) inflation rate in year t. Inflation forecast is the expected inflation rate for year t + 1, as forecast at time t. Inflation surprise is defined as realized inflation in year t minus the forecast of inflation for year t formed at time t − 1. Inflation volatility is measured as the standard deviation of monthly inflation in year t. This timing aligns the forecast variables with our baseline specification, which relates inflation in year t to CDS spreads in year t + 1.
The results are reported in Panel A of Table 12. In columns 1–4, realized inflation, next-year inflation forecasts, inflation surprises, and inflation volatility are each positively associated with CDS spreads when considered separately. In column 5, where all four measures are included jointly, realized inflation remains positive and statistically significant, whereas the coefficients on inflation forecasts, inflation surprises, and inflation volatility are no longer statistically significant. Thus, realized inflation contains the strongest incremental predictive content for future CDS spreads in our sample.

TABLE 12 Long description
The table is divided into five panels (A through E) evaluating the robustness of inflation’s impact on C D S spreads.
Panel A: Inflation Forecast, Surprise, Volatility, and C D S Spreads. It shows that Inflation (0.112), Inflation forecast (0.102), Inflation surprise (0.070), and Inflation volatility (0.240) all have positive, statistically significant coefficients on C D S Spread sub t plus 1 in individual regressions. When combined in column 5, only Inflation remains significant (0.083).
Panel B: Inflation Terciles and C D S Spreads. High Inflation (0.117) and High Inflation forecast (0.104) show strong positive correlations with future C D S spreads compared to medium or low categories.
Panel C: U.S. Sample. This panel focuses on a sample size of 5,225. Inflation and High Inflation show positive but non-significant coefficients (0.051 and 0.026 respectively), while Low Inflation is significantly negative (-0.191).
Panel D: Alternative Measures. Columns 1-3 use Yearly Median, End-of-Year, and log C D S spreads. Inflation remains significant across these (0.103, 0.088, and 0.029). Column 4 uses Quarterly Inflation (0.110), and Column 5 uses first differences (0.109).
Panel E: Inflation Terciles with Alternative Measures. High Inflation consistently shows positive significance across Yearly Median (0.106), End-of-Year (0.098), and log C D S spreads (0.034).
Across all panels, control variables like Leverage and Stock volatility consistently show positive significant coefficients, while R O A (Return on Assets) shows a strong negative significant relationship with C D S spreads. Firm and Industry-Year Fixed Effects (F E) are applied throughout.
We interpret this result cautiously. Our framework does not imply that realized inflation is the only theoretically relevant object for credit risk. In forward-looking credit markets, expected inflation is naturally important. At the same time, realized inflation may retain incremental predictive content because it captures contemporaneous inflationary pressure that directly affects firms’ input costs, current financing conditions, and the updating of beliefs about future inflation and monetary policy. Moreover, forecast-based measures of expected inflation are likely measured with greater noise than realized inflation in our setting. Accordingly, we view these horse-race regressions as showing which observable dimension of inflation risk contains the strongest empirical information for subsequent CDS spreads in our data, rather than as identifying the deeper theoretical object priced by credit markets.
In Panel B, we estimate tercile specifications for each inflation-related measure. Consistent with the baseline results, the positive association between inflation-related measures and CDS spreads is concentrated primarily in the high-inflation regime.
2. U.S. Sample
Second, to better reconcile our findings with Bhamra et al. (Reference Bhamra, Dorion, Jeanneret and Weber2023), we separately examine the relation between inflation and corporate CDS spreads for U.S. firms. Panel C of Table 12 reveals that this relationship is statistically insignificant for the U.S. subsample (columns 1 and 2).
The weaker inflation–credit risk relationship for U.S. firms, compared to the global sample, likely stems from three main factors. First, we find that the relationship is convex, initially negative at low inflation levels but turning positive at higher levels. Given that the average U.S. inflation rate is relatively low (2.19%), the relation with CDS spreads is muted. When we divide inflation into terciles, the relationship is significantly negative in the low and medium inflation groups (column 3), consistent with Bhamra et al. (Reference Bhamra, Dorion, Jeanneret and Weber2023).
Second, as discussed earlier, U.S. firms have a lower average short-term to long-term debt ratio than non-U.S. firms, indicating lower refinancing needs and reduced sensitivity to inflation-driven financing costs. Third, the positive link between inflation and credit risk is more pronounced in emerging markets, where weaker financial and institutional environments amplify firms’ vulnerability to inflationary shocks. In contrast, U.S. firms benefit from a stronger environment that helps buffer such shocks.
Additionally, given that Japan has the lowest average inflation rate in our sample and accounts for 19.84% of the observations, we also investigate the relation between inflation and CDS spreads for Japanese firms. As reported in Supplementary Material Appendix C.4, we find that the inflation–credit risk relationship is statistically insignificant for the Japan subsample. Moreover, the relationship remains convex—insignificantly positive in the high inflation tercile, insignificantly negative in the medium tercile, and significantly negative in the low inflation tercile.
Overall, the subsample analyses in this section reinforce the convex nature of the inflation–credit risk relationship and highlight how prevailing inflation levels and institutional environments jointly shape its magnitude and direction.
3. Other Robustness Checks
We further conduct several other robustness checks on our findings.
First, we explore alternative measures for both CDS spreads and inflation. Results are presented in Panel D of Table 12. We use the median CDS spread over a year, end-of-year CDS spread, and the log of CDS spread as alternative CDS spread measures in columns 1–3. We use quarterly inflation data from the OECD in column 4. We find that the relation between inflation and CDS spreads is qualitatively similar across all alternative measures.
In column 5 of Panel D, we conduct regressions using first differences, where changes in CDS spreads within firms are regressed on changes in inflation and other independent variables. The results confirm that changes in inflation are positively related to changes in firm CDS spreads, consistent with our baseline findings. In terms of economic magnitude, a 1-standard-deviation increases in the change in inflation (i.e., 1.49 as reported in Table 3) is, on average, associated with an increase in CDS spread change by 16 basis points (i.e., 1.49 × 0.109).
We also estimate spline regressions by dividing inflation into terciles (low, medium, high) and report robustness results using alternative measures of both CDS spreads and inflation in Panel E of Table 12. The results indicate that the relation between inflation and credit risk is significantly positive only in the high-inflation tercile. The medium-inflation tercile also exhibits a positive, though less precisely estimated, relation. By contrast, the low-inflation tercile is associated with a negative, though statistically insignificant, coefficient. Taken together, these findings provide further support for a convex relationship between inflation and credit risk.
Second, given the importance of global factors for inflation and the potential for cross-sectional correlation in residuals within a given year, it is important to examine whether our inference is sensitive to the clustering structure. We reestimate our baseline regressions using alternative standard error clustering methods: clustering by year, by firm, and two-way clustering by country and year, as well as by firm and year. As reported in Supplementary Material Appendix C.5, the relation between inflation and CDS spreads remains statistically significant at the 1% level across all clustering methods, and the convex relationship between inflation and firm credit risk continues to hold.
Third, we examine whether the observed inflation effect persists after controlling for additional variables. First, following Collin-Dufresne et al. (Reference Collin-Dufresne, Goldstein and Martin2001), we account for the fact that nominal interest rates reflect both real interest rates and inflation by controlling for the real short-term interest rate, calculated using the Fisher equation from each country’s nominal short-term interest rate and inflation rate. Second, to address the concern that our results may be driven by broader macroeconomic conditions rather than inflation, we include controls for banking crises, sovereign rating downgrades, and changes in cash rates. The results, reported in Supplementary Material Appendix C.6, remain qualitatively similar to those in our main analysis.
Fourth, we address concerns about limited firm representation in some countries by restricting the sample to those with at least 10 firms. As shown in Supplementary Material Appendix C.7, our main results remain robust: column 1 confirms the positive relationship in the global sample, while column 2 supports the convex inflation effect using terciles. Since CDS spreads may be denominated in different currencies, we also control for currency-by-year fixed effects and exchange rate effects, and our findings continue to hold (Supplementary Material Appendix C.8).
Finally, we further examine the inflation-CDS relationship conditional on debt stickiness (Supplementary Material Appendix C.9) and cash flow stickiness (Supplementary Material Appendix C.10). To isolate within-country variation, we include country-by-year fixed effects, which absorb the main effect of inflation. We find that the coefficient estimates on Inflation × Leverage and Inflation × Short-Term Debt to Long-Term Debt remain positive, with the former statistically significant at the 1% level, suggesting that firms with higher leverage are more vulnerable to inflation-induced credit risk. Similarly, the coefficient estimates on Inflation × High Price Change Frequency and Beta (Cash flow stickiness) are negative, with the latter significant at the 10% level. These results suggest that firms with greater pricing flexibility (i.e., less sticky cash flows) are better able to absorb inflation shocks, thereby weakening the relation between inflation and credit risk. Taken together, these findings reinforce the theoretical mechanism that both debt and cash flow stickiness play a central role in shaping firms’ inflation-induced credit risk.
F. Inflation and Forward-Looking Probability of Default
Furthermore, we provide additional evidence using the forward-looking probability of default from the NUS-CRI database as an alternative measure of credit risk. The NUS-CRI probability of default (PD) is similar to the expected default frequencies (EDF) computed by Moody’s KMV but is publicly available data. They provide default signals for firms globally, derived from multiple data sources. These PD measures have been used in several studies of default risk (e.g., Berndt (Reference Berndt2015), Hasan et al. (Reference Hasan, Marra, Wu and Zhang2025)).Footnote 27 The results, shown in Supplementary Material Appendix C.11, are consistent with our primary findings using CDS spreads as a measure of credit risk.
Specifically, we find that inflation is positively associated with the firm-level 5-year forward-looking probability of corporate default, and the association is statistically significant at the 1% level (columns 1–5). In terms of economic magnitude, column 5 suggests that a 1-standard-deviation increase in inflation (i.e., 1.9%) in a firm’s headquarter country is, on average, associated with a 0.17 percentage point increase in the firm’s 5-year forward-looking probability of default (i.e., 0.092 × 1.9%). This is equivalent to a 7% increase in the firm’s 5-year forward-looking probability of default relative to the sample mean (the average 5-year forward-looking probability of default in our sample is 2.41%). Moreover, column 6 shows that both medium- and high-inflation terciles are associated with significantly higher default probabilities in the following year, while the low-inflation tercile is not.
To summarize, the evidence based on forward-looking probability of default as an alternative measure of firm credit risk aligns with our CDS-based findings and further reinforces the conclusion that inflation influences firm-level credit risk in a nonlinear manner.
V. Conclusion
This study provides international evidence on the relation between inflation and corporate credit risk. Using firm-level data from 50 countries, we show that inflation is positively associated with CDS spreads on average and that this relation is convex.Footnote 28 It is negative or weak at low inflation levels, consistent with debt-easing effects that reduce the real burden of nominal liabilities. However, at high inflation levels, input-cost pressures, tighter monetary conditions, and refinancing burdens become more salient, leading to a markedly stronger positive association between inflation and credit risk. This nonlinear relationship helps reconcile why related studies conducted under different inflation environments emphasize different aspects of the inflation–credit risk relation.
We also show that this relation is stronger for firms with greater refinancing vulnerability, weaker for firms with more flexible prices and more responsive cash flows, and stronger in countries with more inflation-responsive monetary regimes and weaker institutional environments. Taken together, these findings are consistent with the view that the inflation–credit risk relation is jointly shaped by debt rigidity and operating rigidity, and that the global setting helps clarify when each channel becomes more important.
Our evidence should be interpreted in light of the sample. Because traded CDS contracts are concentrated among large, publicly listed, internationally active firms, our findings apply primarily to the market-based credit risk of these firms. Inflation may affect smaller, private, or more bank-dependent firms differently, particularly because they often face tighter financing constraints, rely more on bank credit, and have less ability to pass through rising input costs. Because our data do not directly cover these firms, we do not overstate the external validity of our findings beyond the CDS sample.
Our findings have implications for academics, policymakers, and credit-market participants. For academics, we provide new international evidence on how the relation between inflation and corporate credit risk operates through both financing and operating channels. For policymakers, the results show that the inflation–credit risk relationship is nonlinear and depends on monetary regimes, financial structures, and institutional environments. For investors and risk managers, the findings highlight that inflation should be incorporated explicitly into credit assessment, especially for firms with high refinancing needs, rigid cash flows, or exposure to weaker institutional and financial environments.
Supplementary Material
To view supplementary material for this article, please visit http://doi.org/10.1017/S0022109026103305.
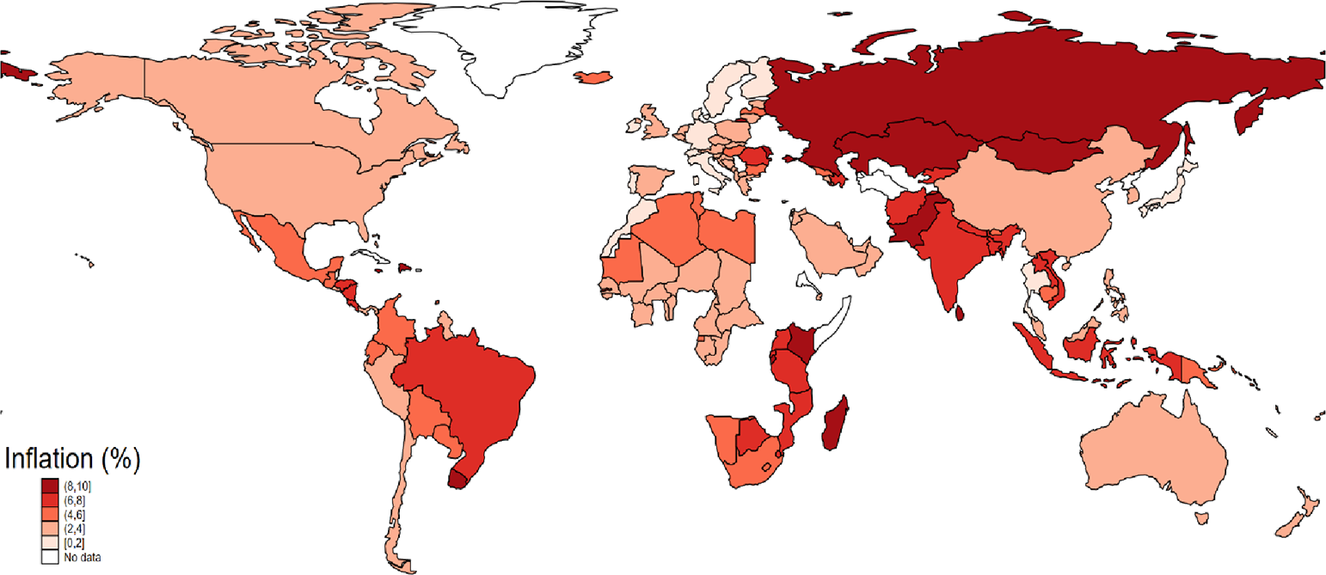
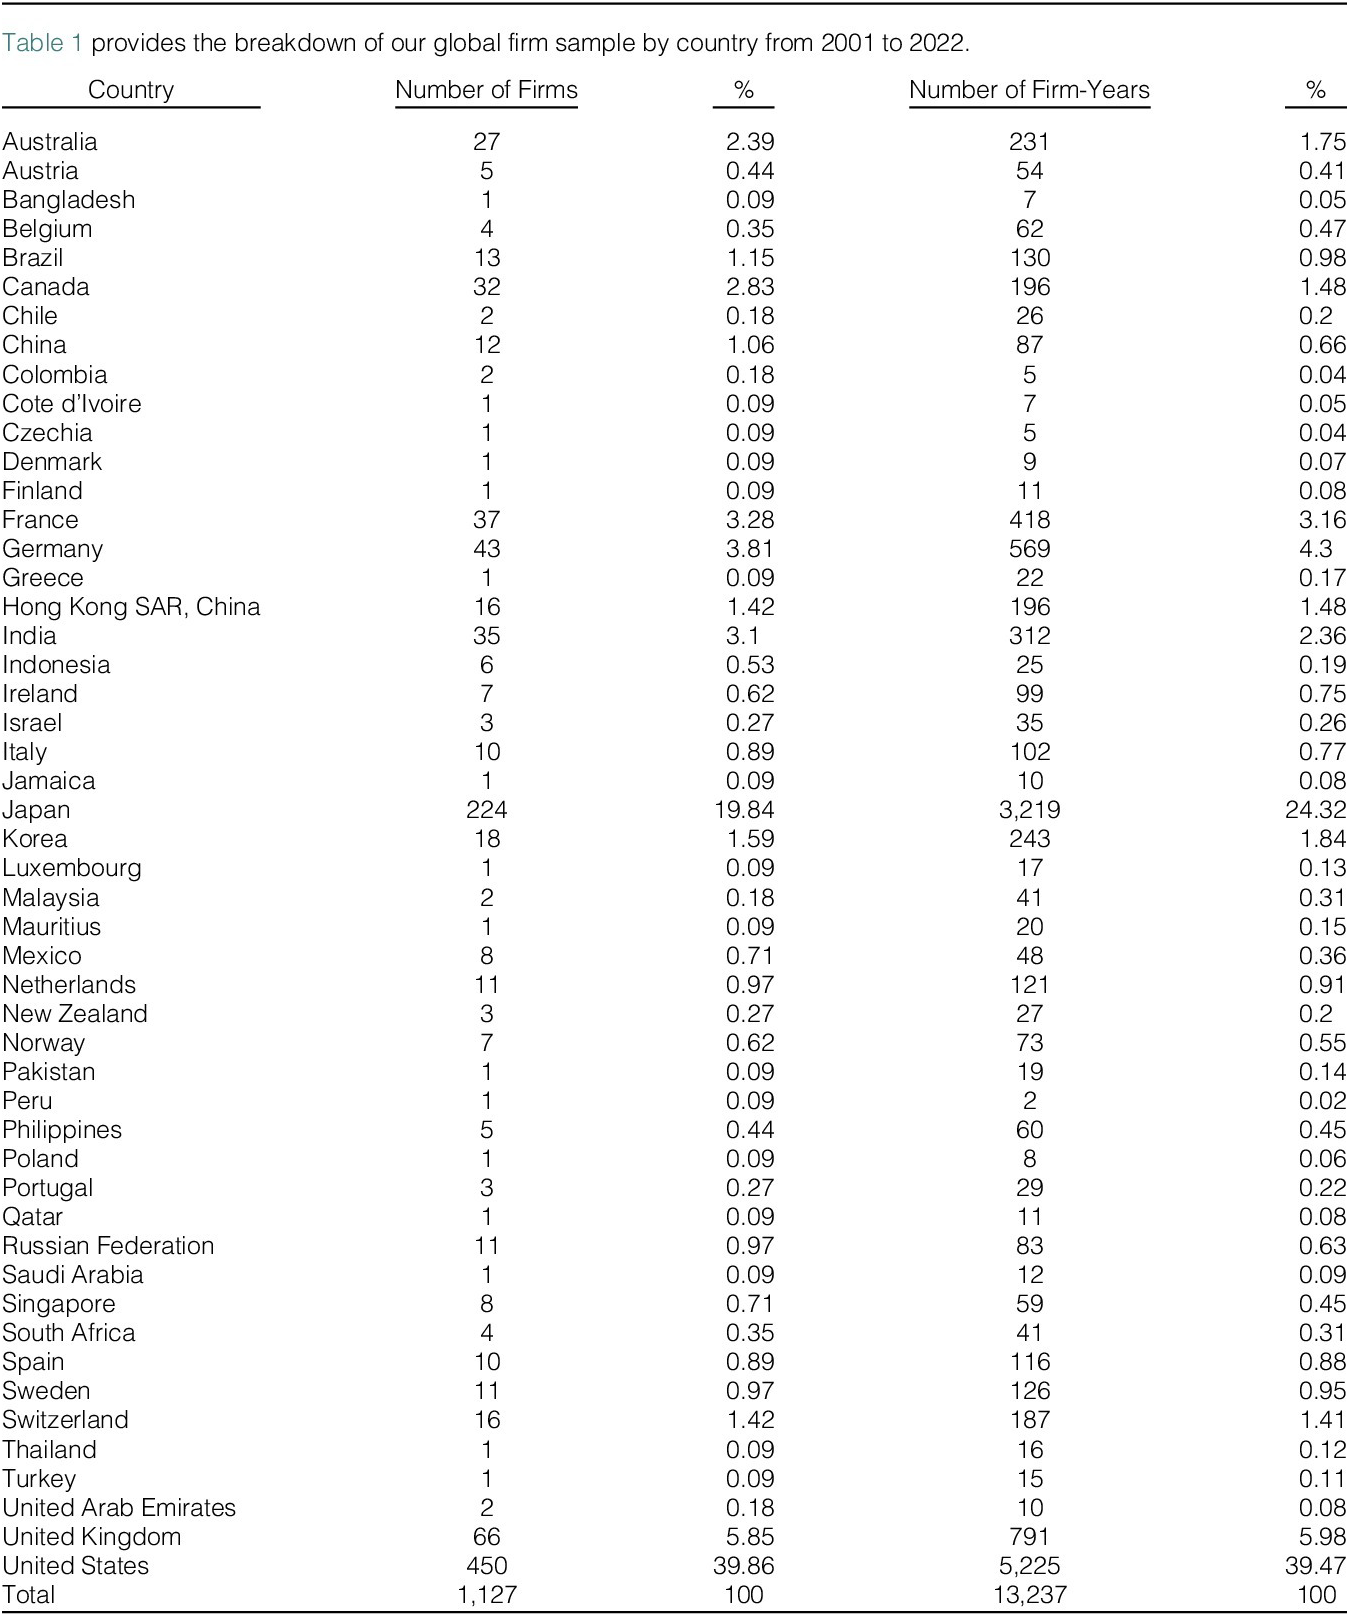
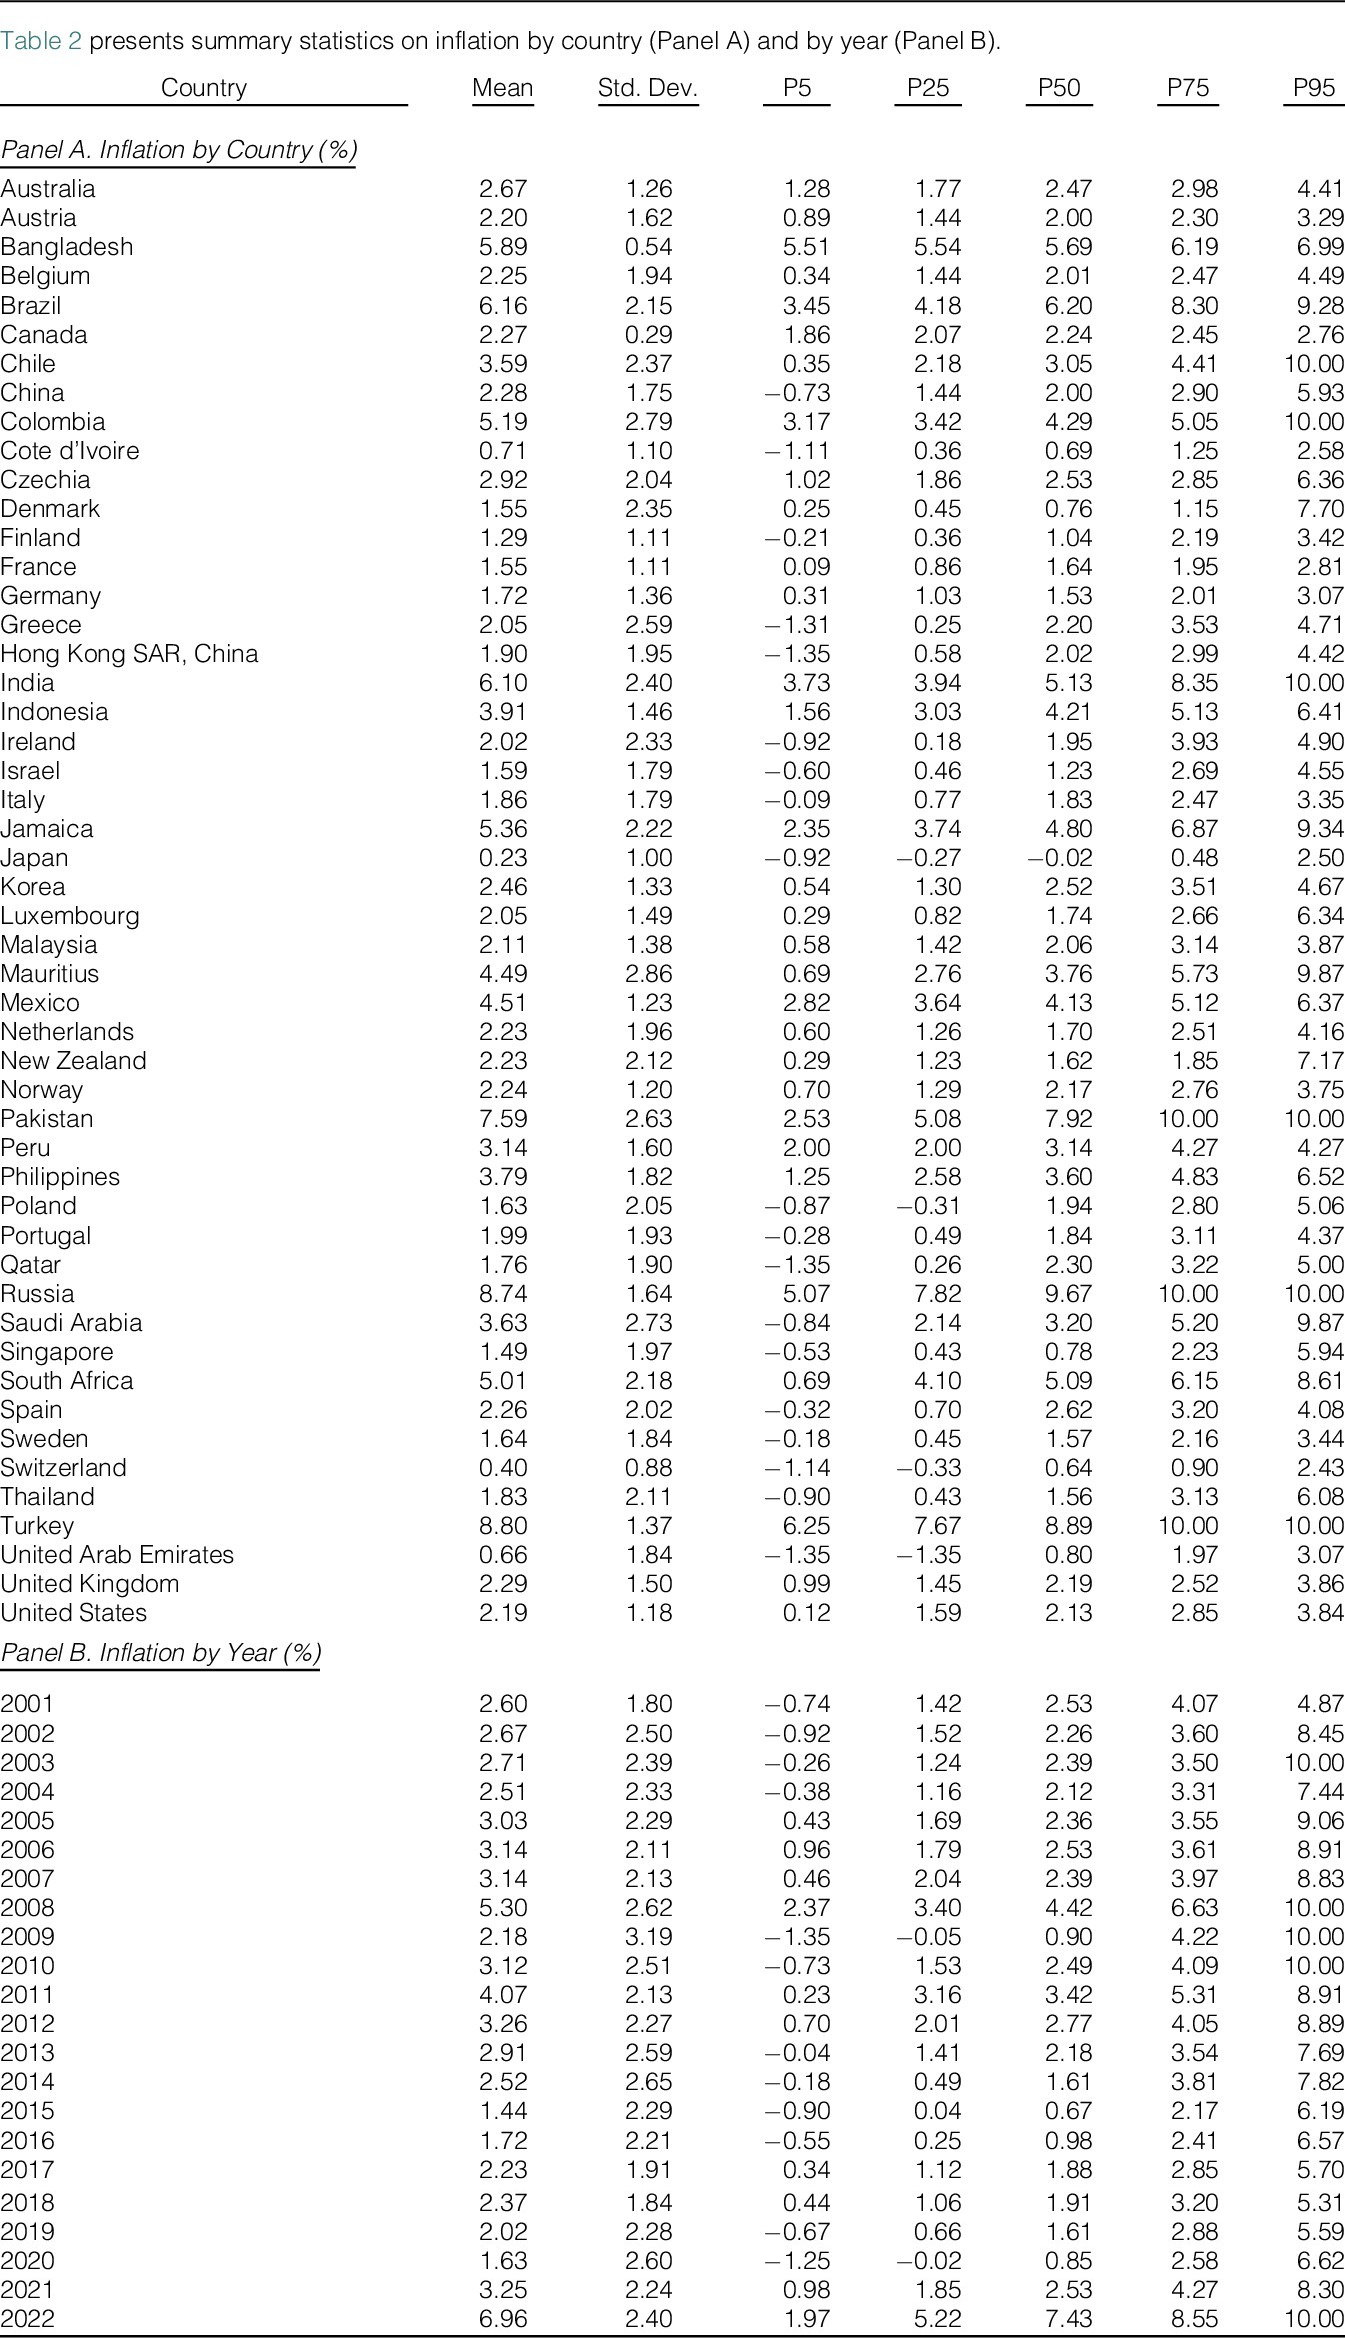
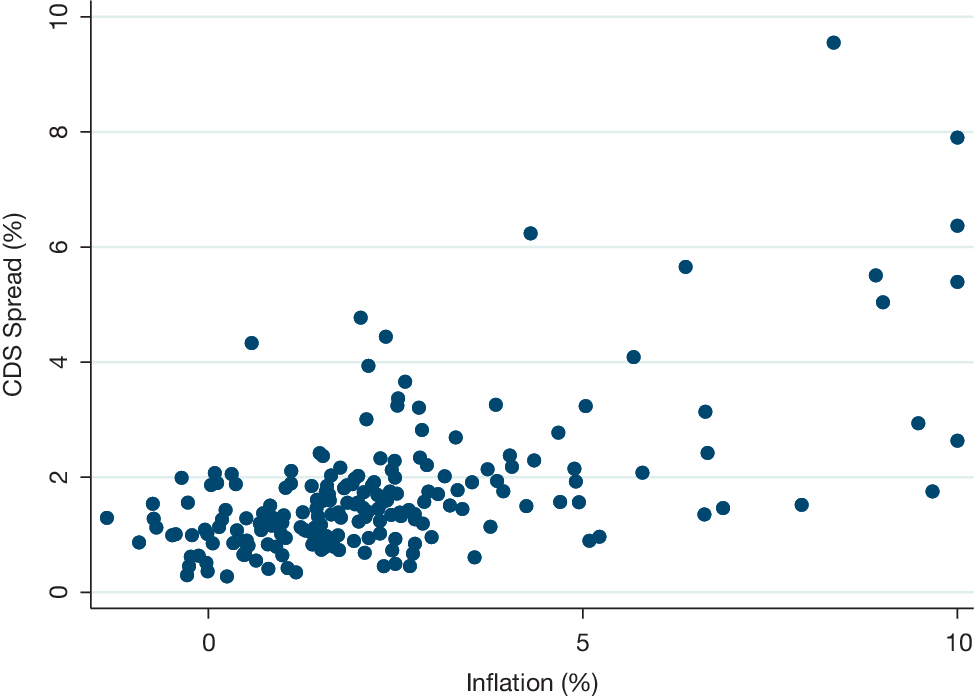
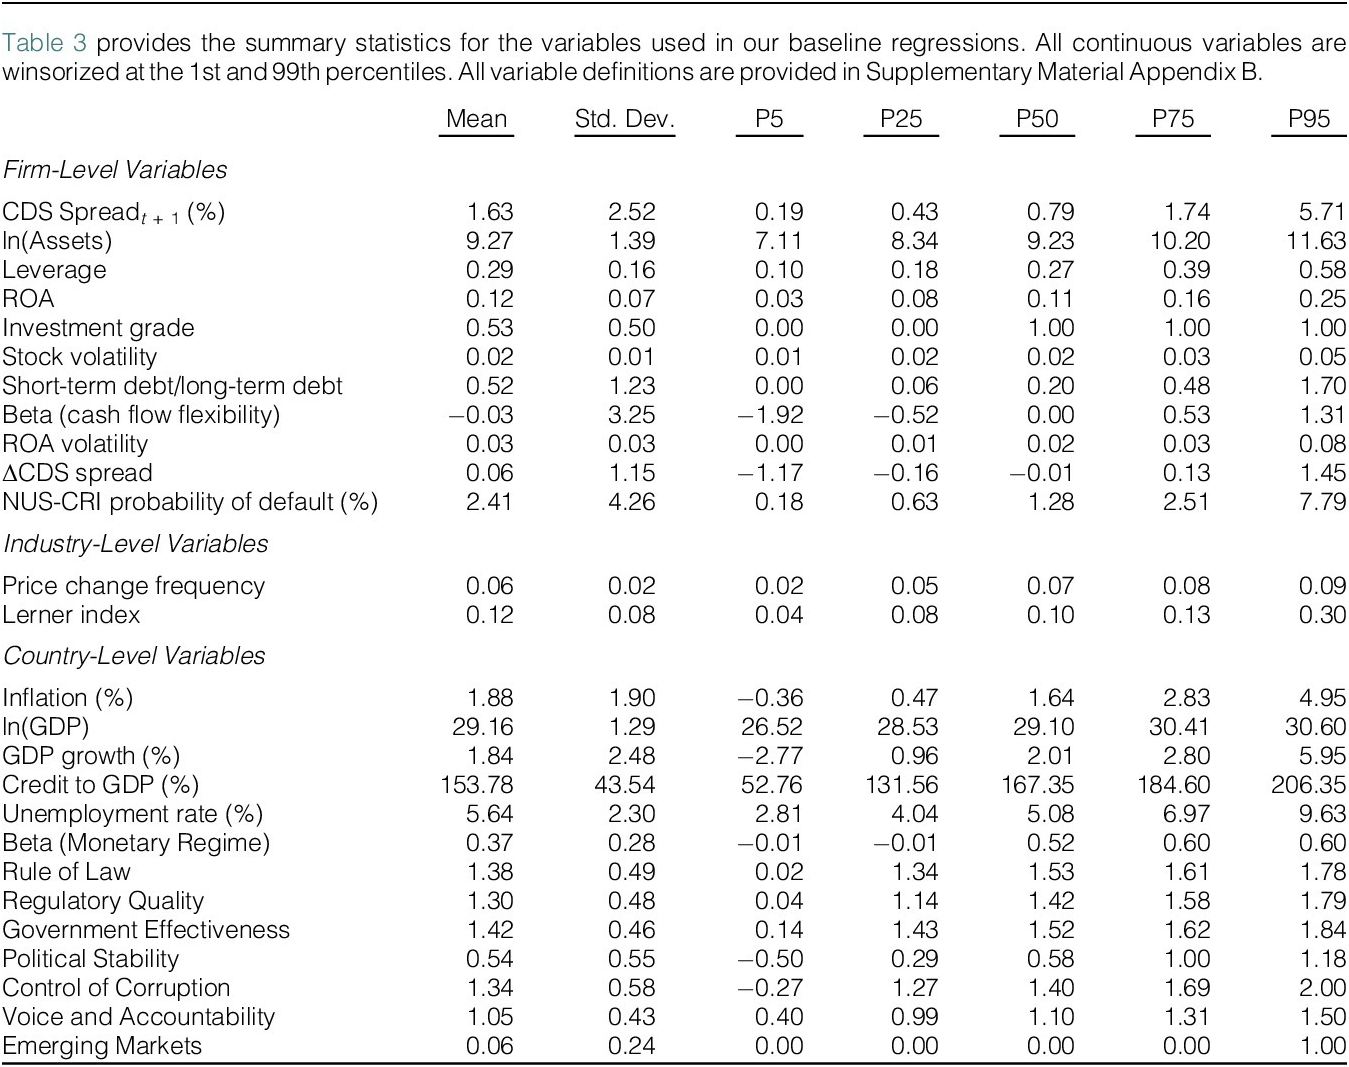
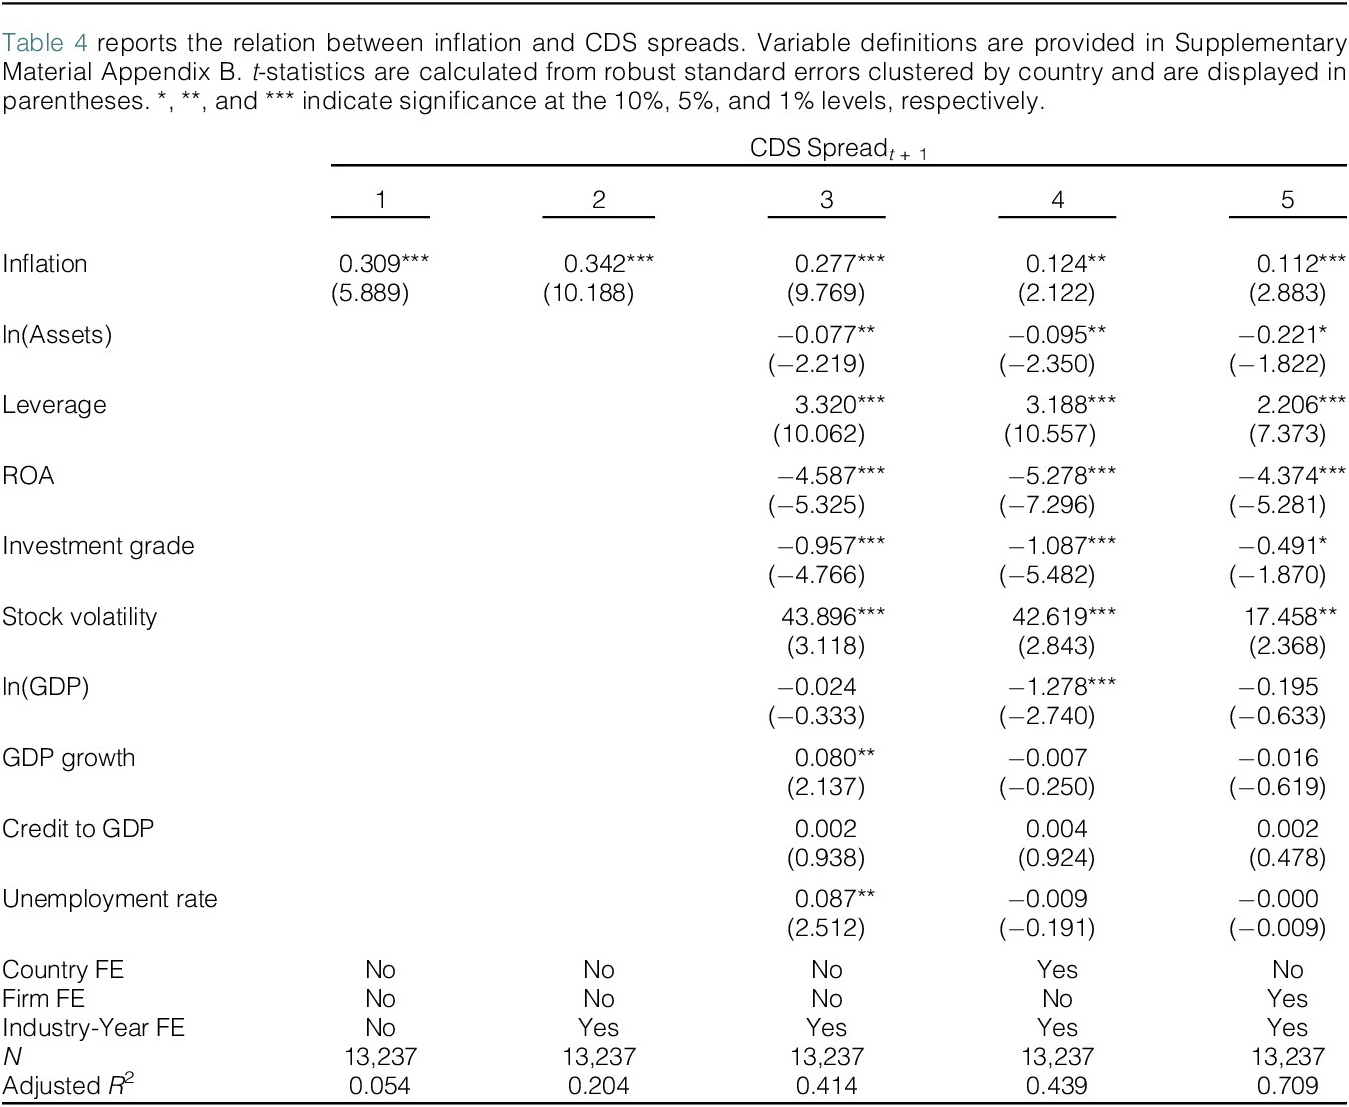
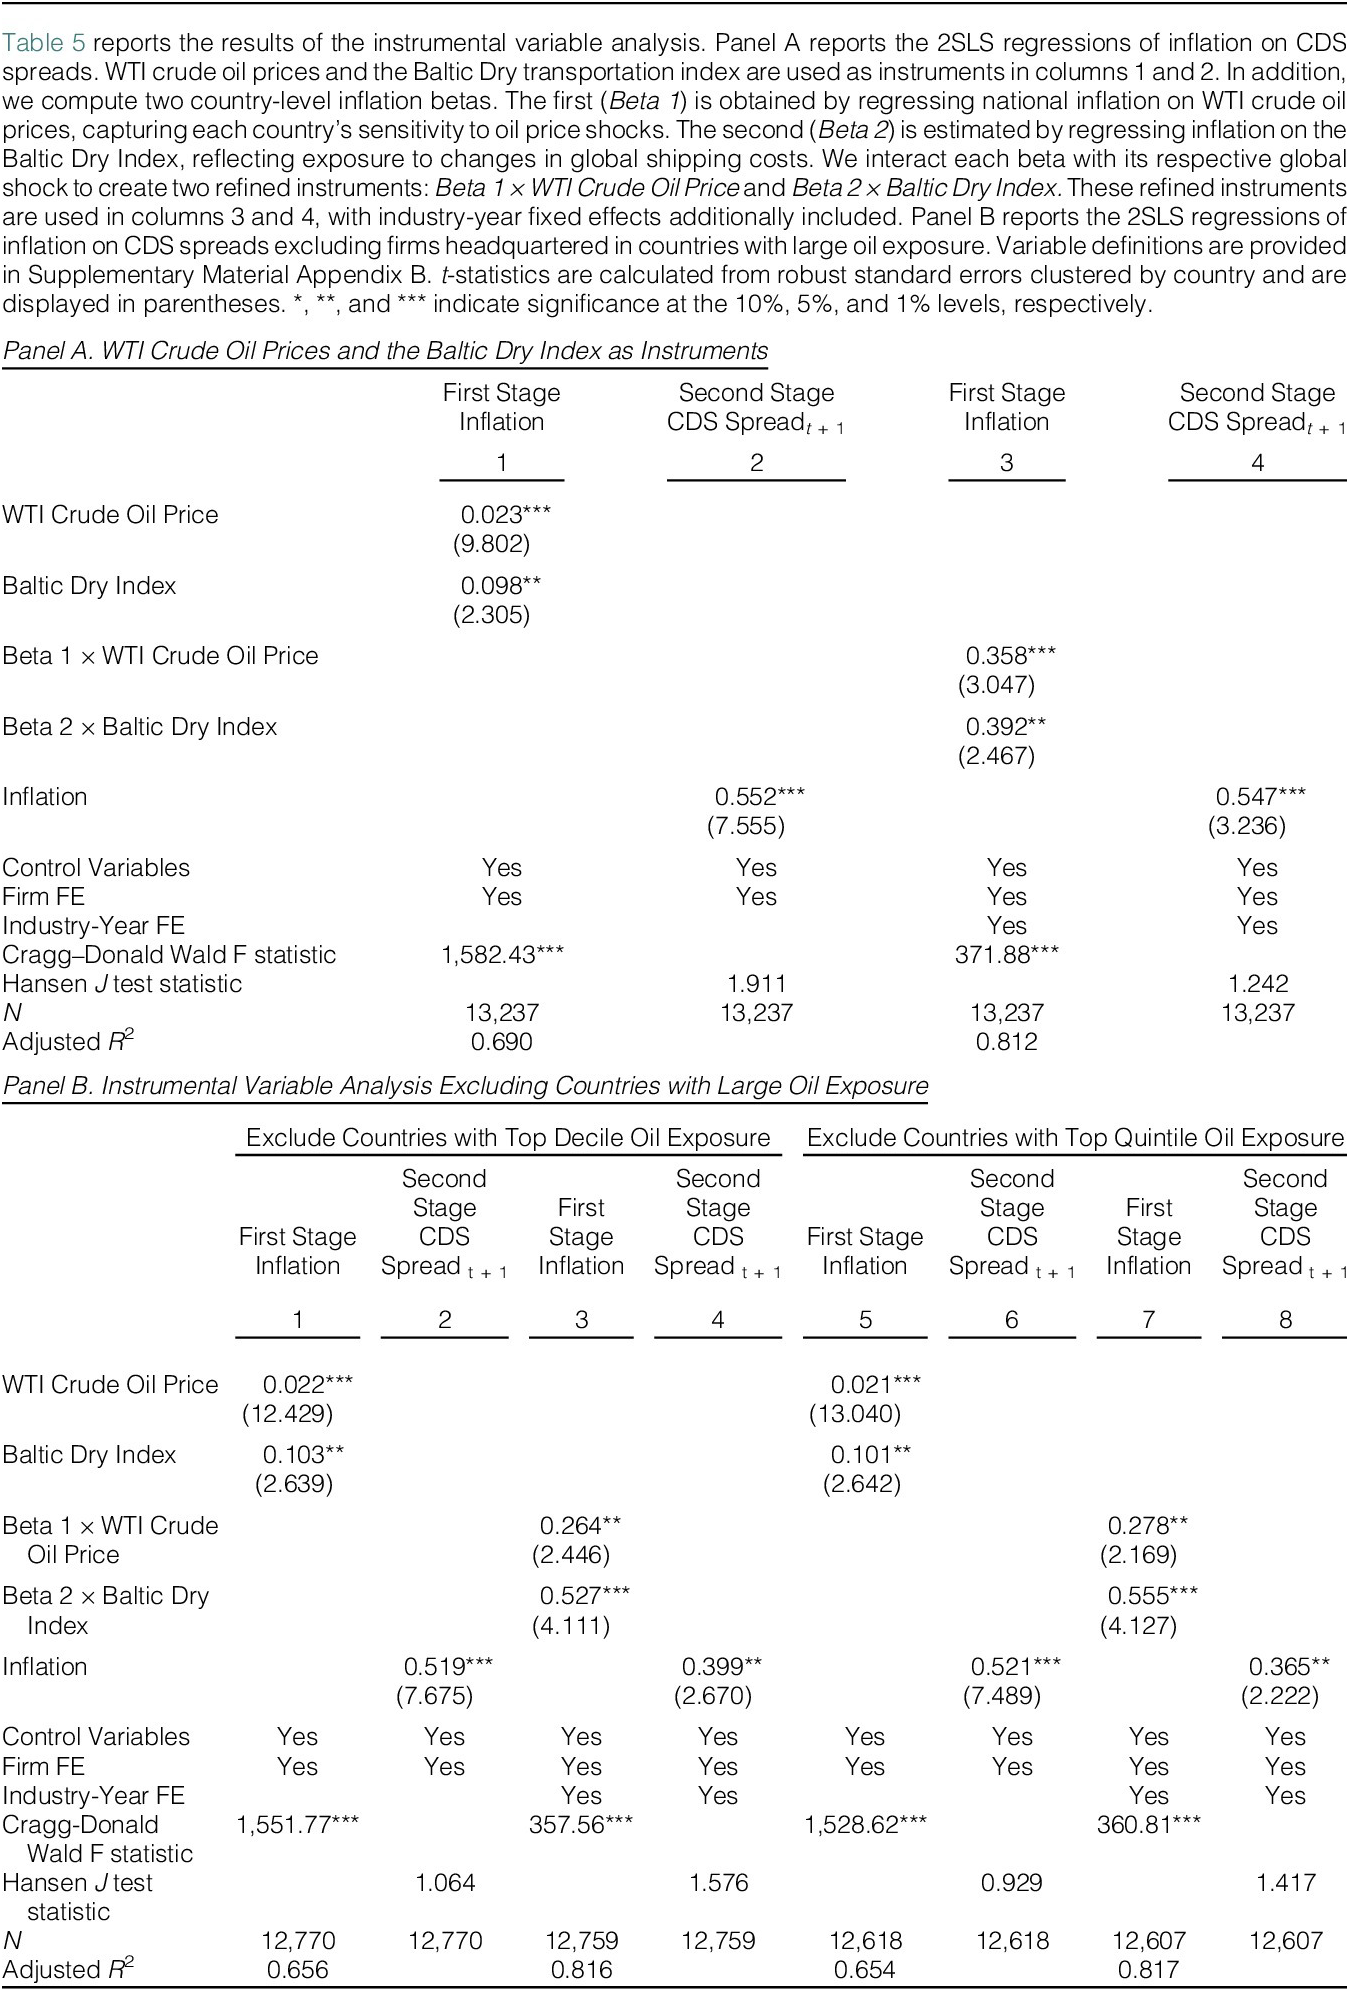
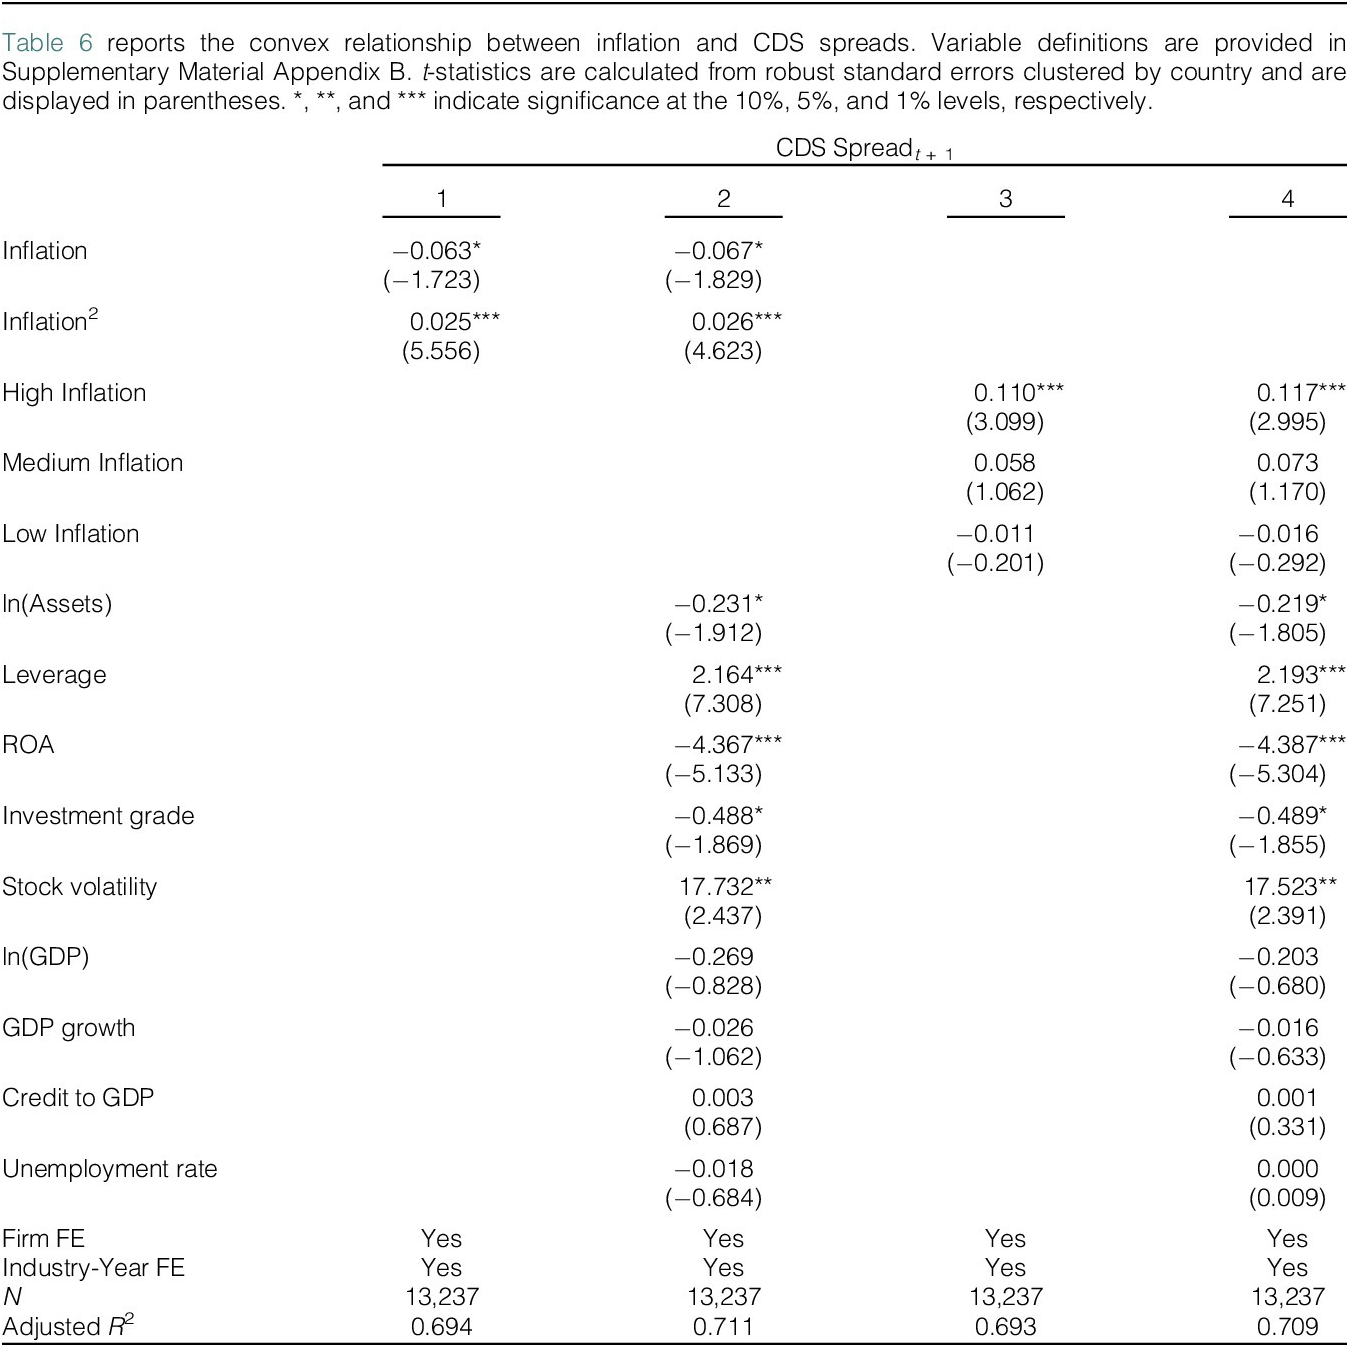
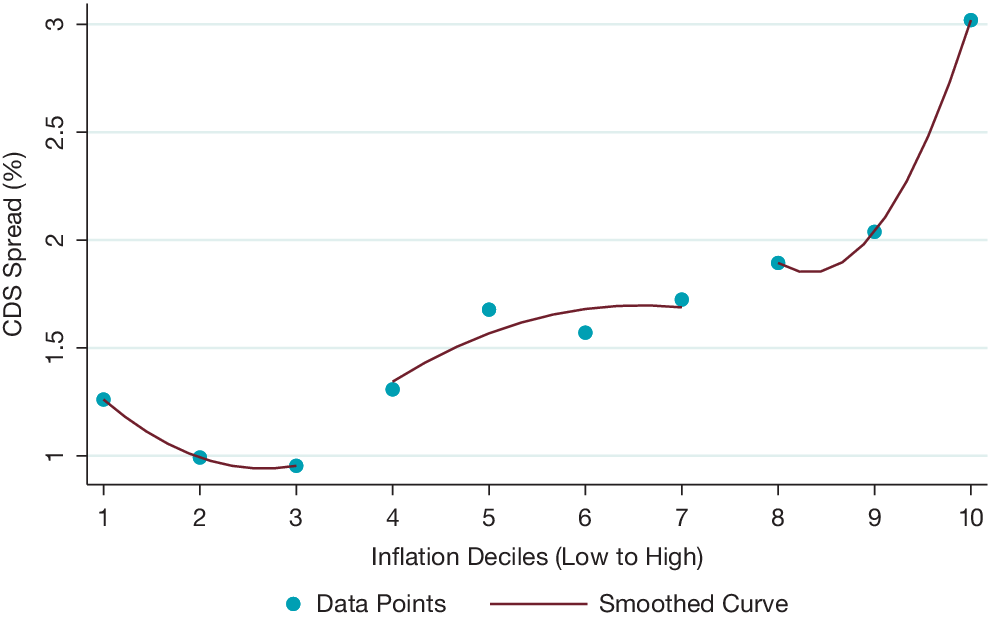
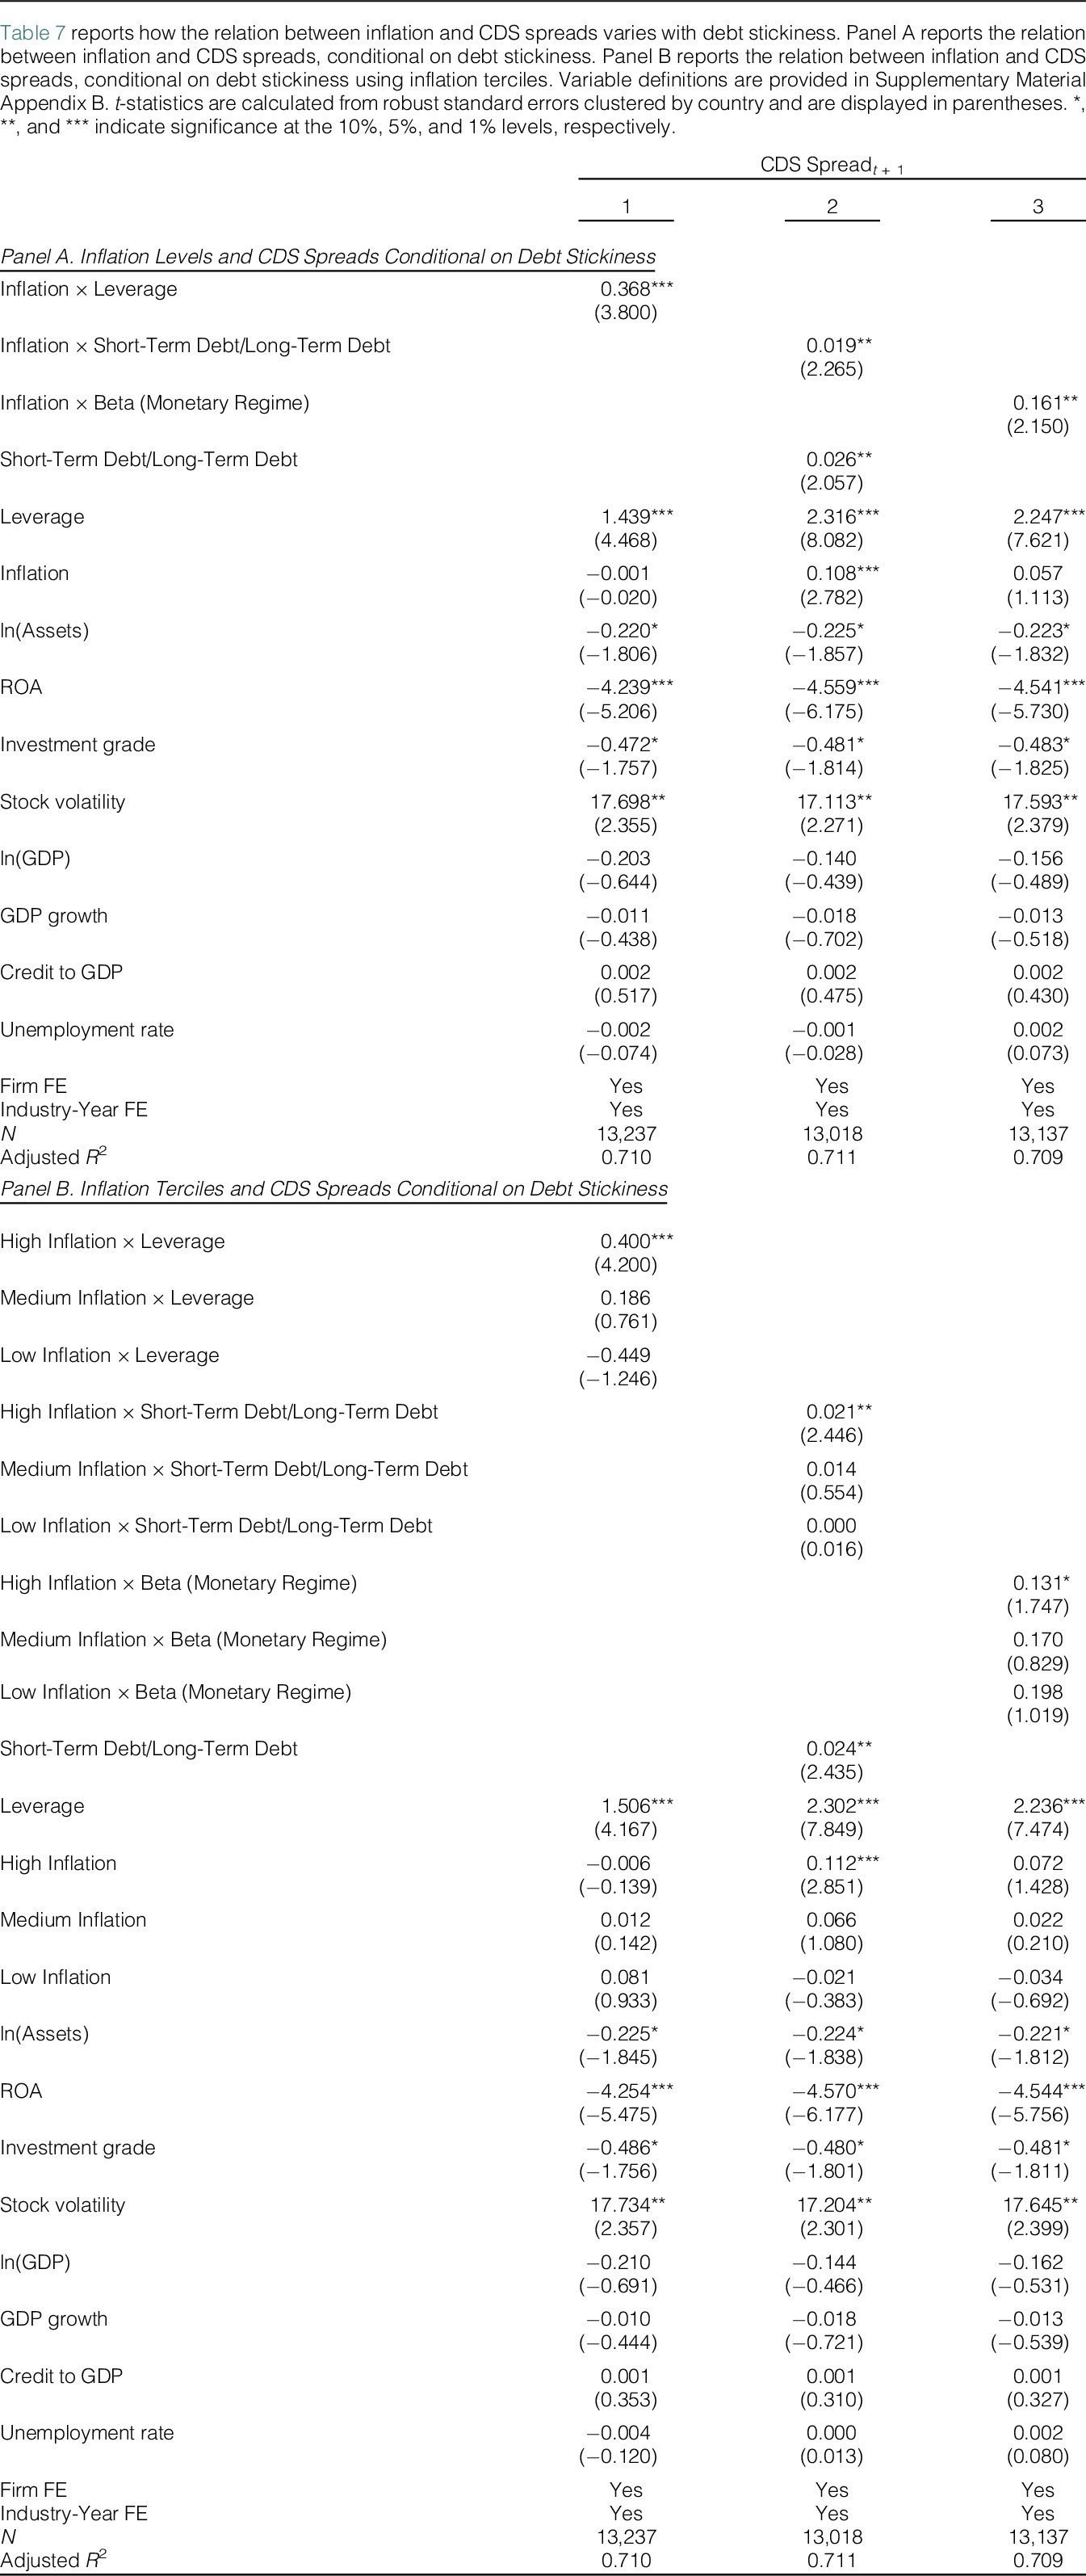
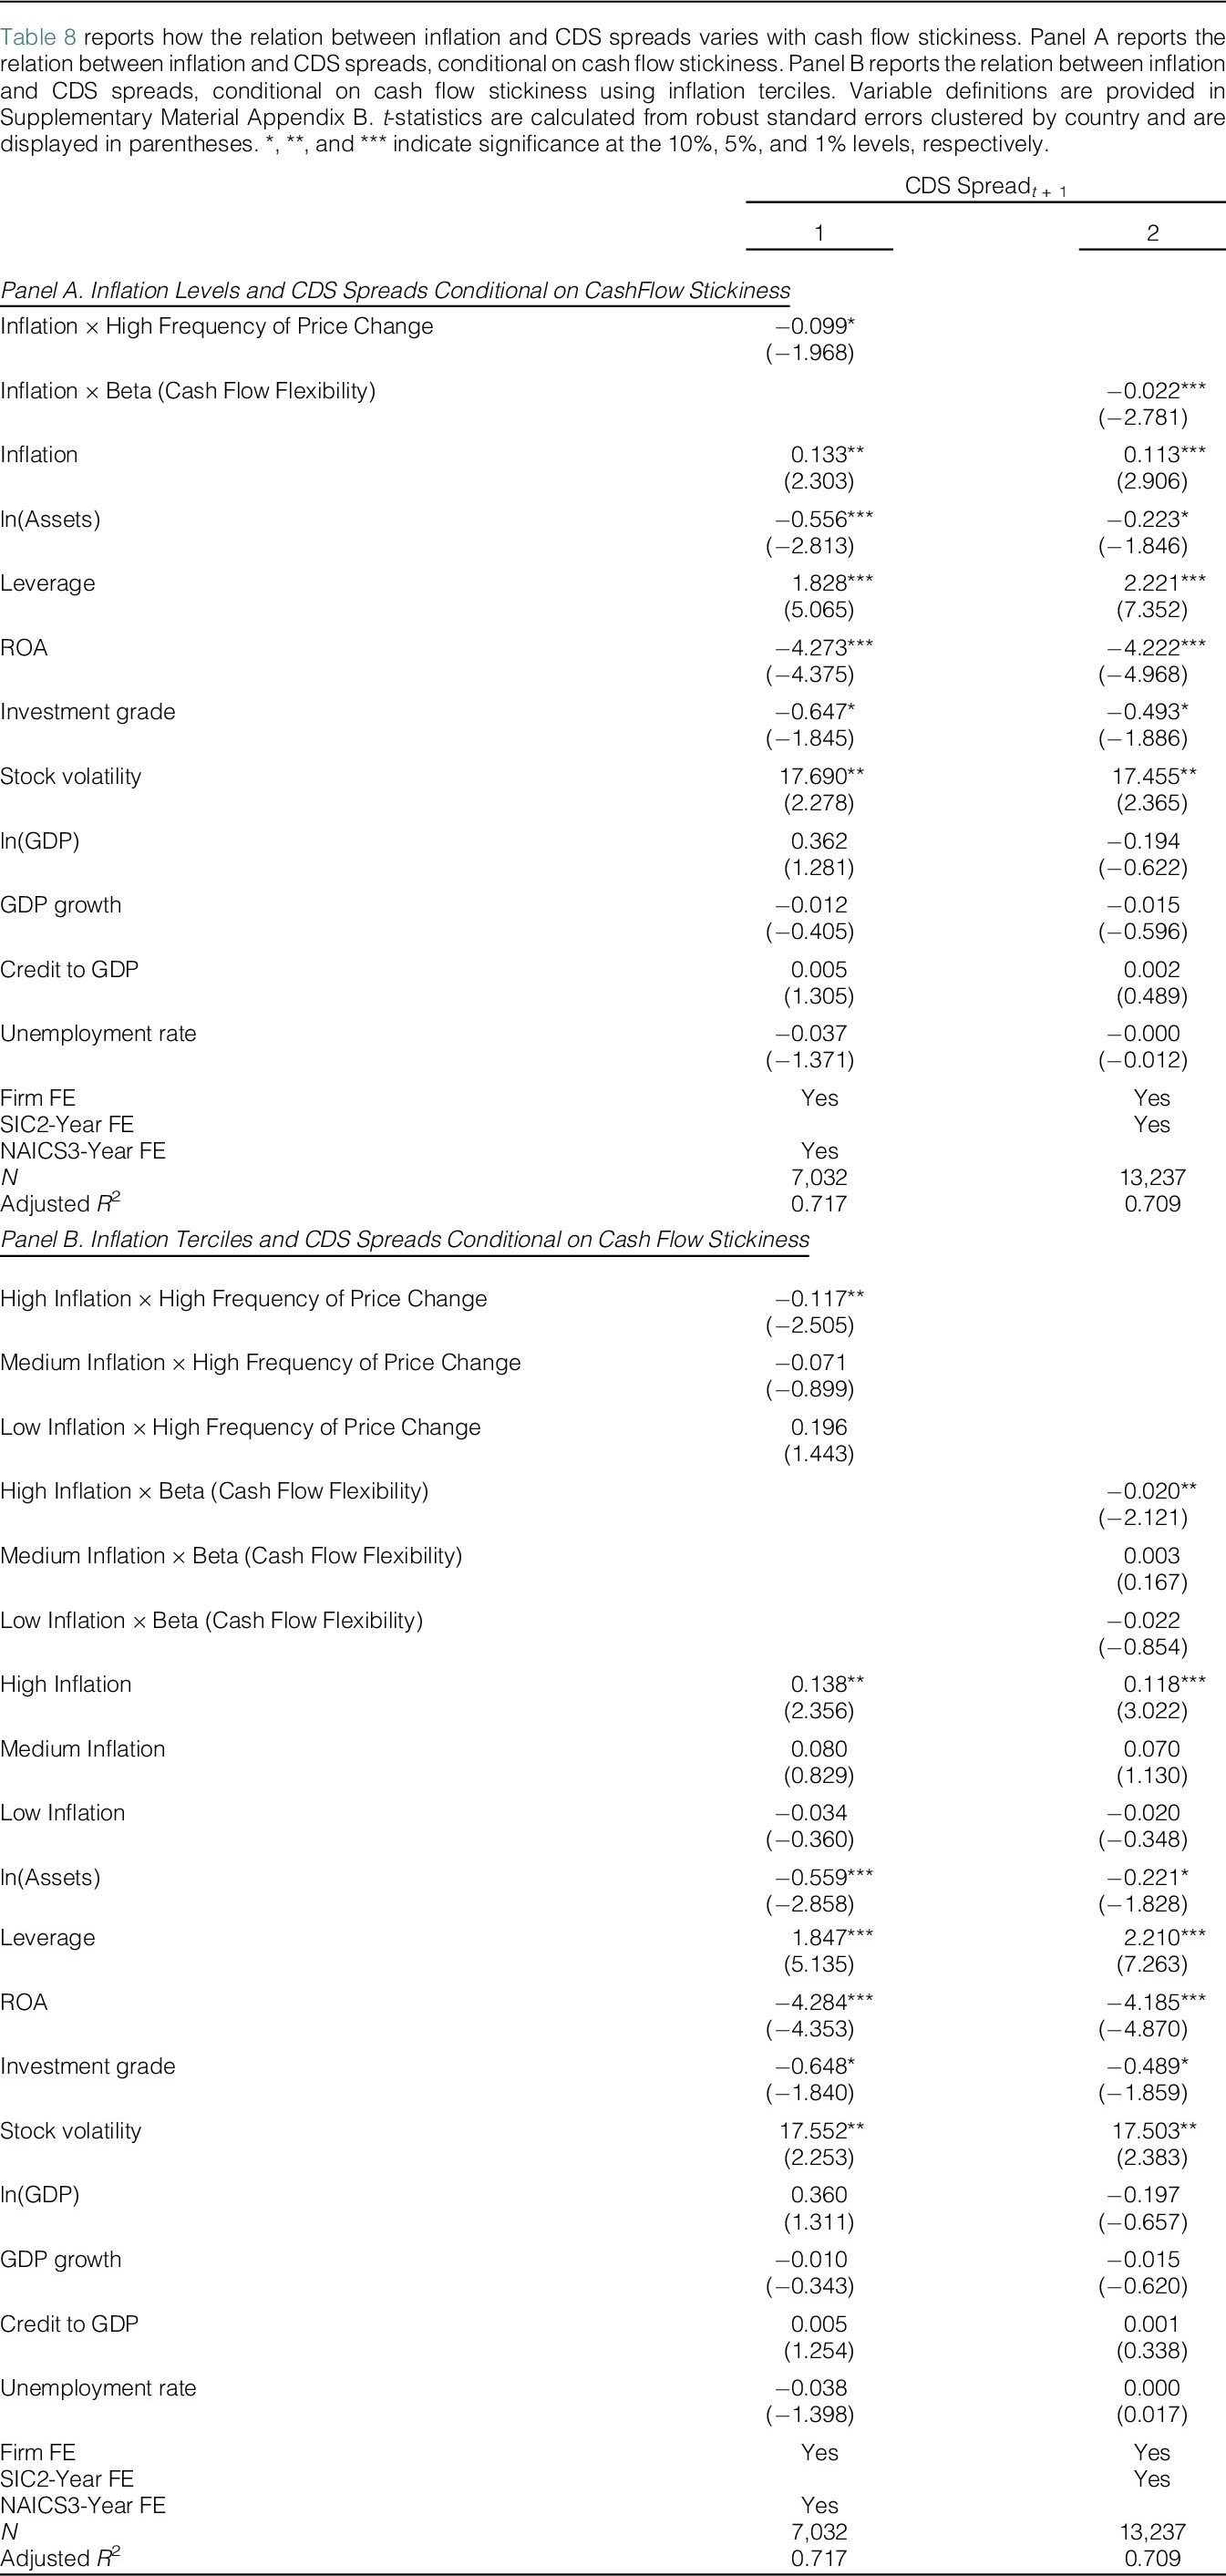
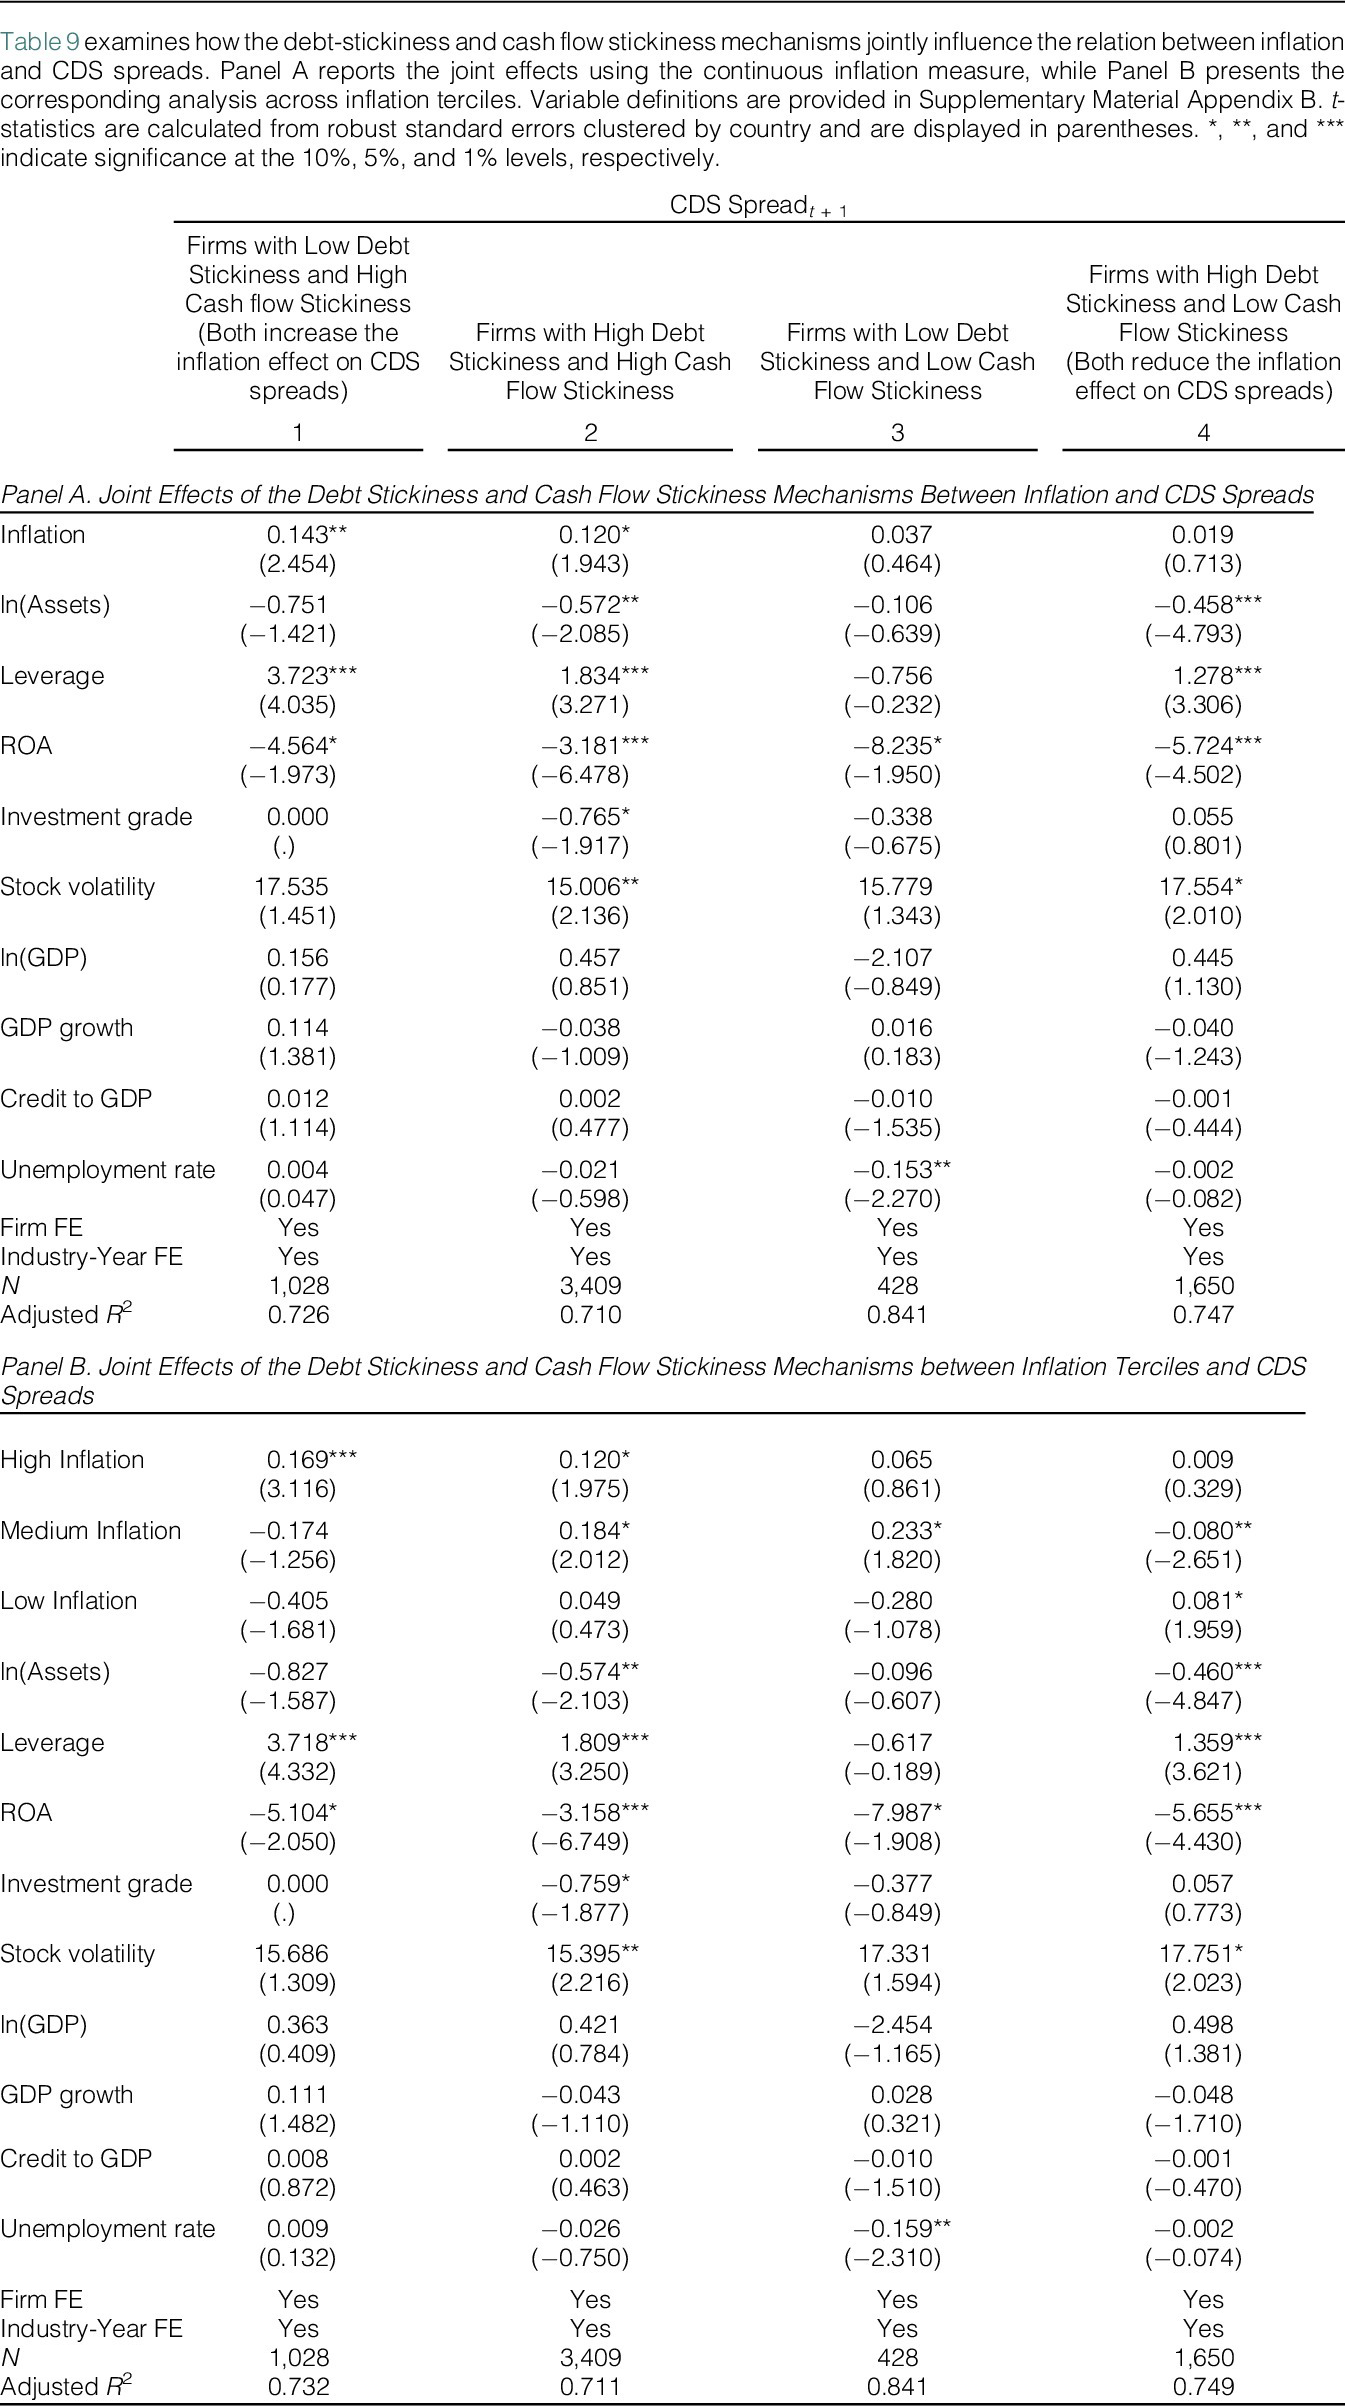
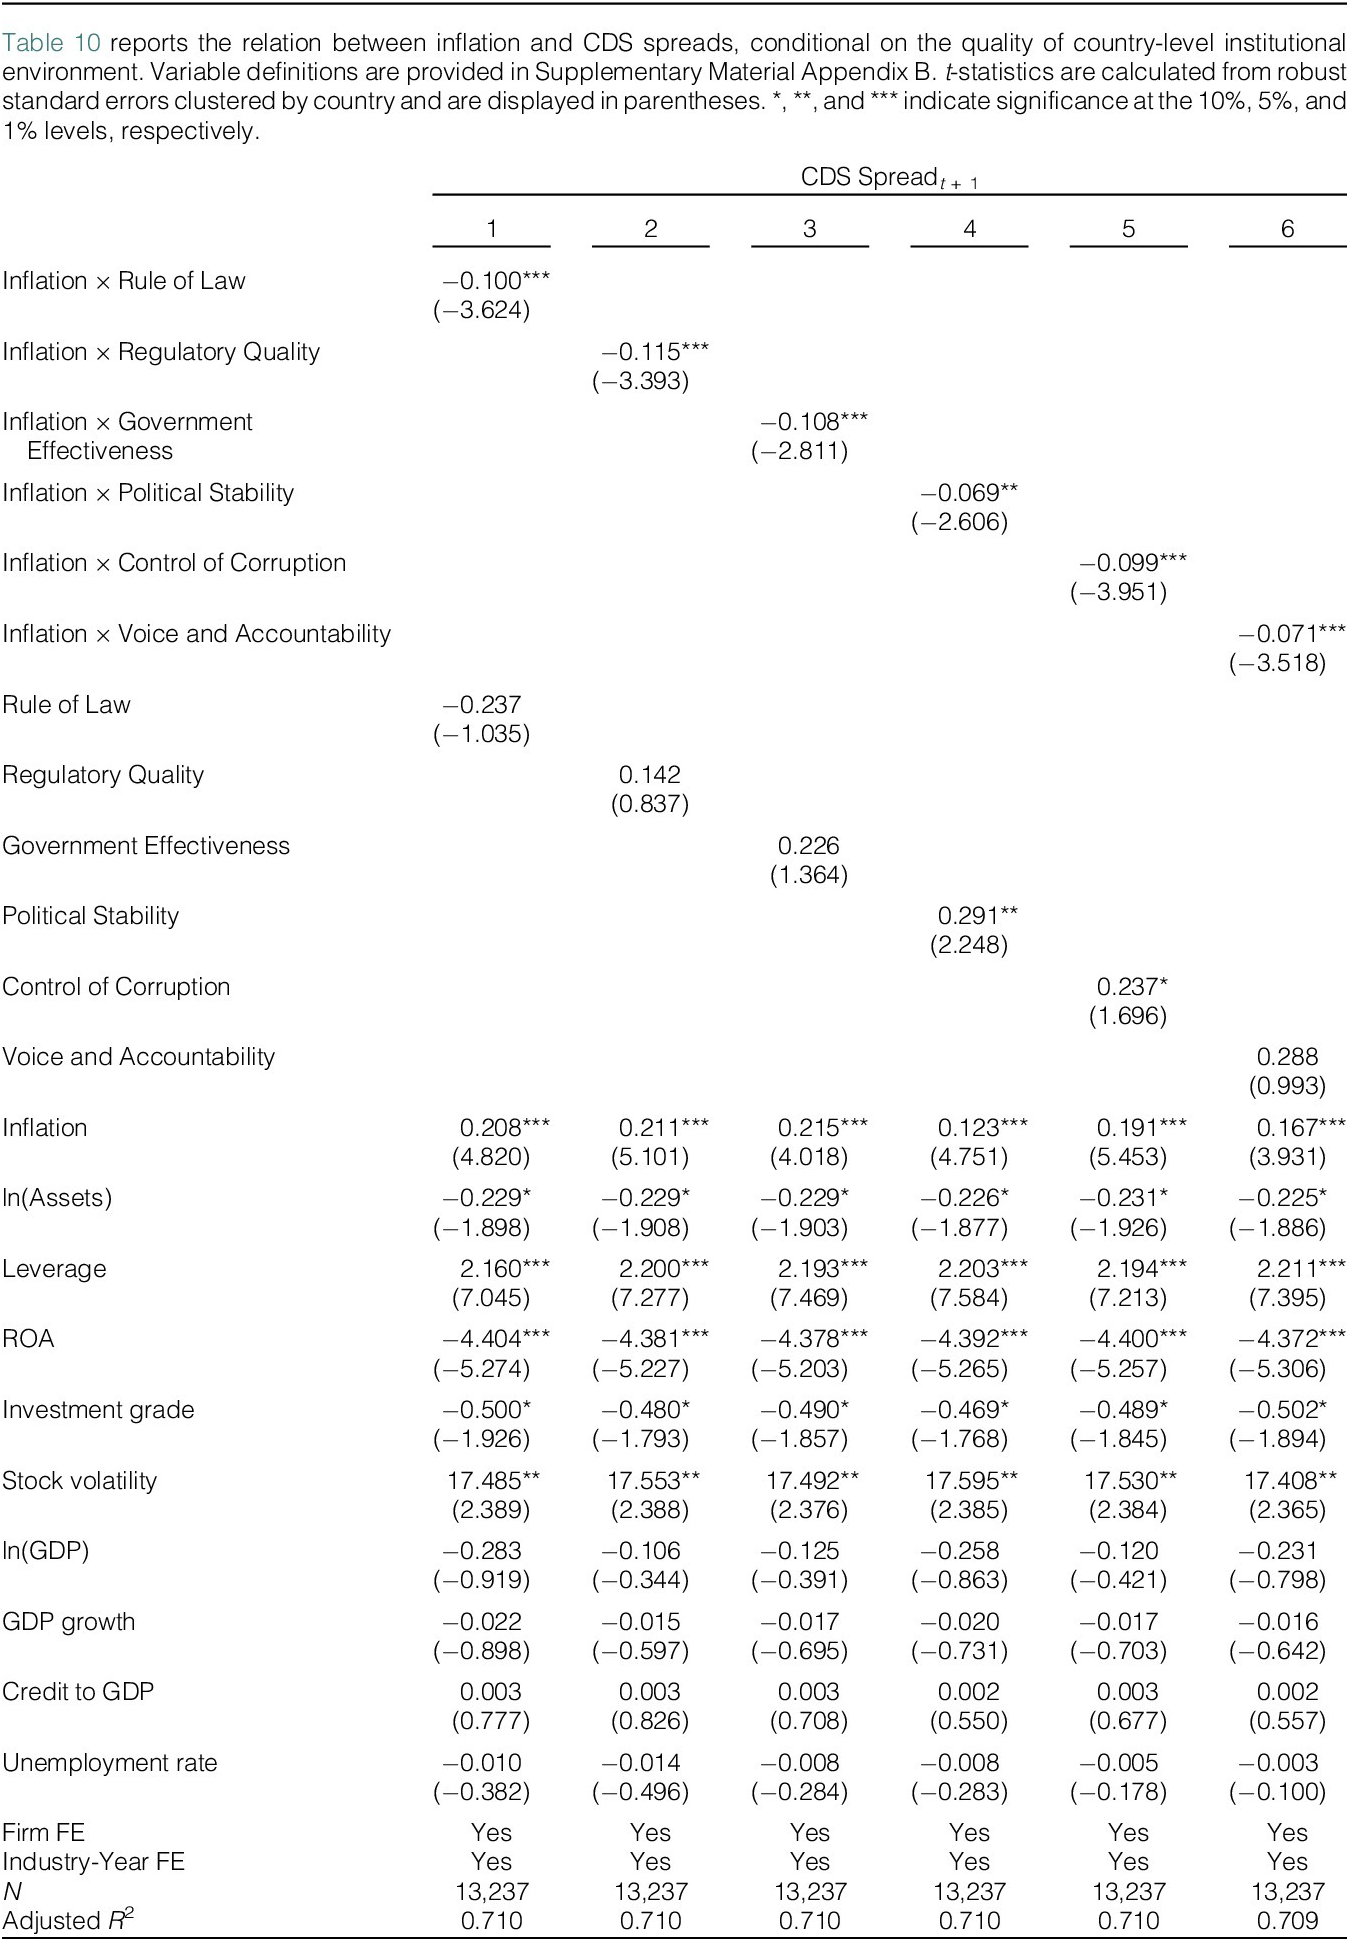
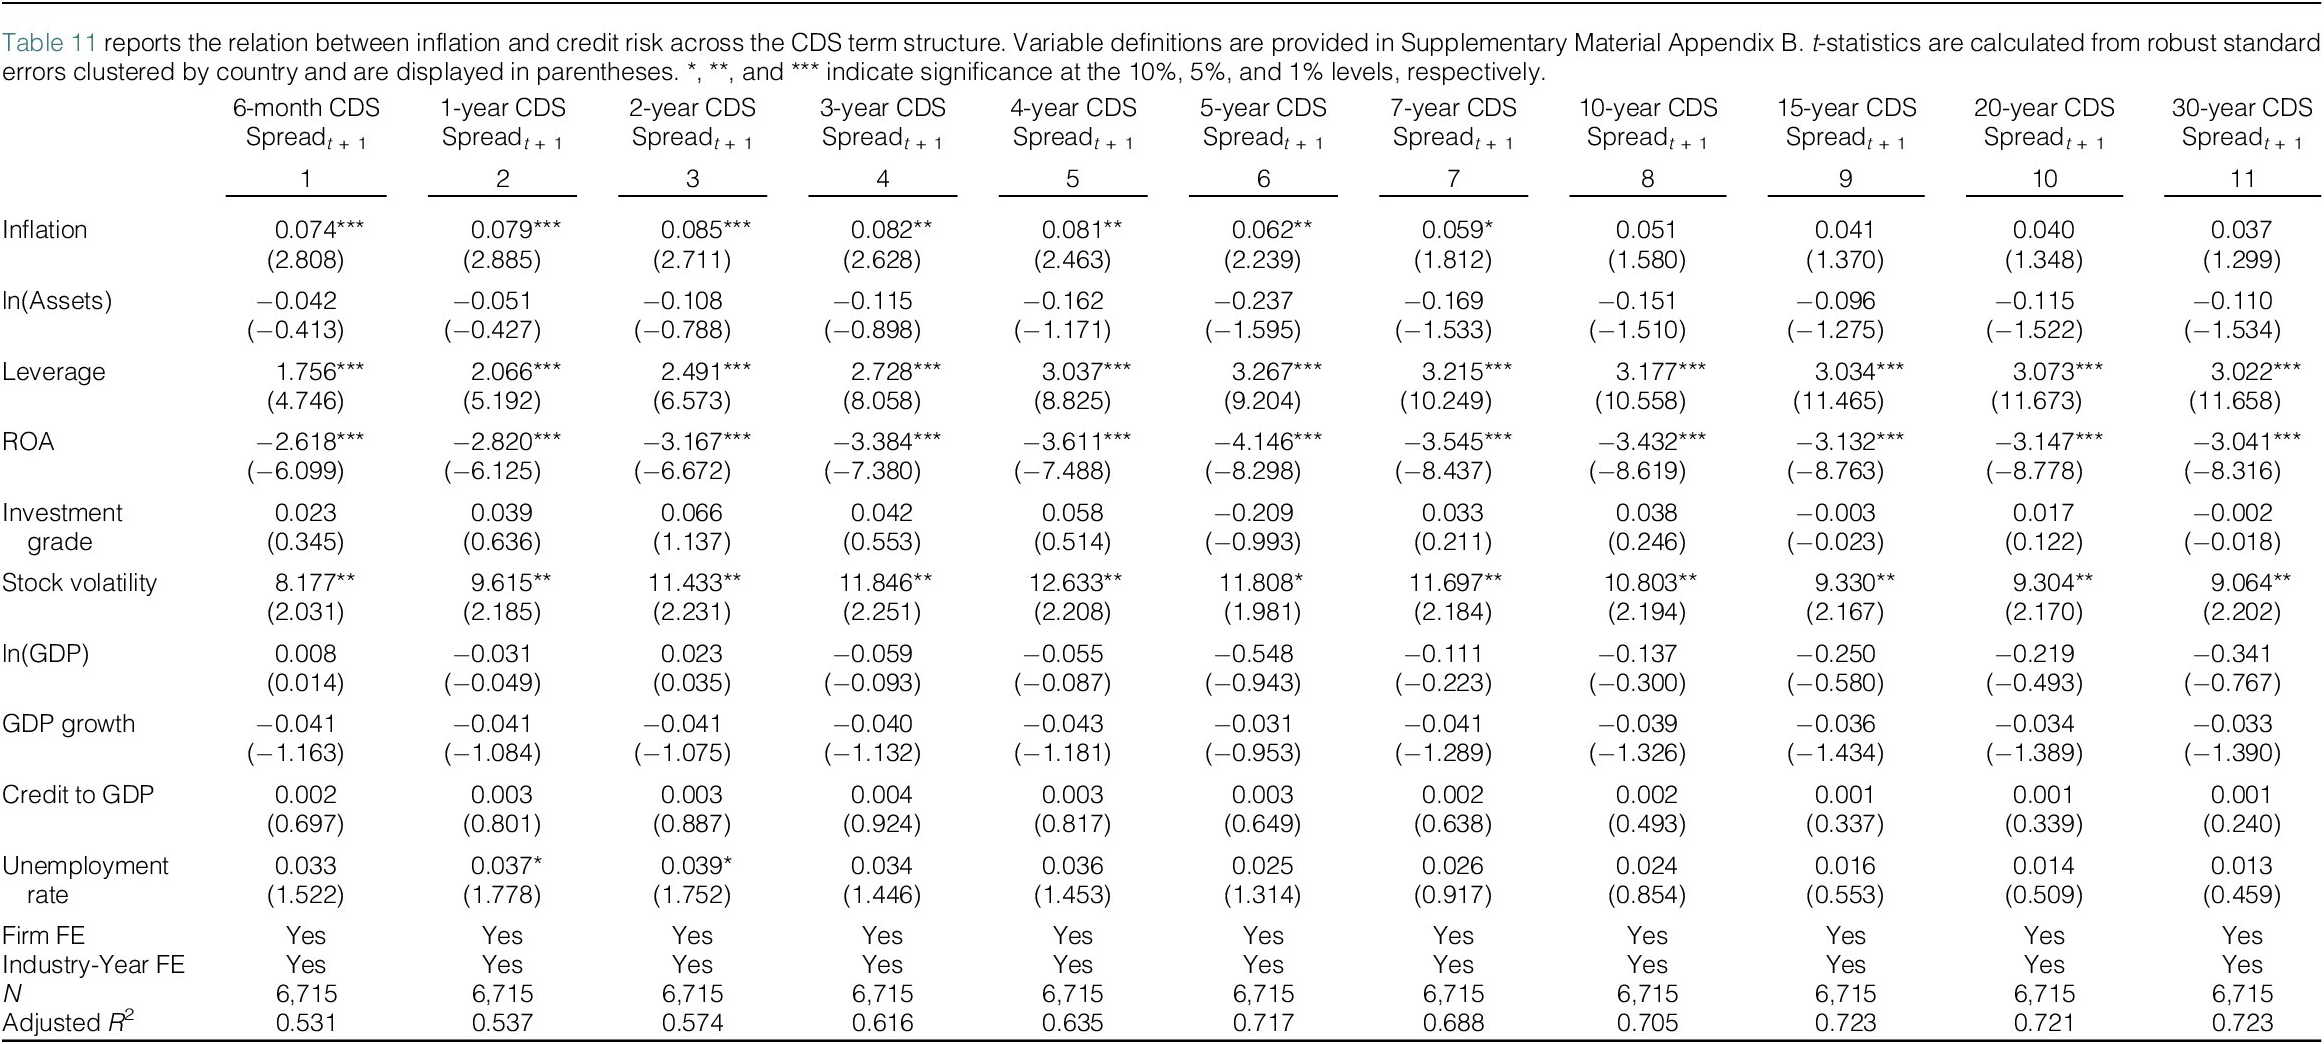



 Open access

