1. Introduction
Over the past two decades, there has been a substantial change in the choice architecture governing US defined contribution (DC) retirement plans, most notably the growing use of automatic enrollment. In a retirement plan with automatic enrollment, the plan sponsor may enroll an eligible employee in the plan unless the employee affirmatively elects otherwise. In a voluntary enrollment retirement plan, the employee must affirmatively elect to enroll in the retirement plan. Automatic enrollment of newly eligible employees substantially raises plan participation rates and retirement plan wealth (Madrian and Shea, Reference Madrian and Shea2001). Yet under federal tax rules, at the time of job change, participants have full access to the vested balance in their accounts. As a result, many separating employees opt to ‘cash out’ those savings, rather than retain those funds in a tax-advantaged retirement account. In this paper, we consider the question of how job change behavior, retirement plan design features, and federal tax rules on retirement plan distributions interact and influence retirement wealth accumulation.
A complex set of rules governs the dynamics of plan distributions upon job change. Upon job separation from an employer, participants have the right to cash out their vested balance (paying any taxes and often a 10% penaltyFootnote 1), keep it within the employer plan, or roll it over to a personal Individual Retirement Account (IRA). This behavior is also strongly affected by a set of tax policy defaults. If the participant's balance is greater than $5,000, the participant's money must remain in the employer plan until the participant takes action. If the balance is below $1,000, the plan may distribute a check to the participant, unless the participant actively opts to roll it over to an IRA or to another employer plan that accepts incoming rollovers. Meanwhile, if the balance is between $1,000 and $5,000, by regulation the plan may roll over the account automatically to an IRA or, at the plan's discretion, retain the account within the plan.
We seek to understand the interplay among automatic versus voluntary enrollment, job market turnover, and these policy thresholds and their collective impact on retirement wealth accumulation. Those who separate from employers with voluntary enrollment (VE) plans and were participants in those plans prior to separation may be more active and motivated to save, as evidenced by their active choice to opt into their VE retirement plan. These employees may be more likely upon separation to keep their accumulated savings in a tax-qualified retirement account such as their current plan, an IRA, or a new employer's plan. On the other hand, those who saved under automatic enrollment (AE) plans may be more subject to the forces of inertia and thus more likely to follow whatever path is predetermined by the plan's design, whether that is to automatically roll over into an IRA, distribute the account as cash, or continue in the plan indefinitely.
To answer this question, we turn to an administrative data set of the retirement plan savings accounts for roughly 563,000 employees who were hired between 2010 and 2013, spanning 385 distinct employer-sponsored private DC plans. Anonymized data were provided under restricted access conditions by Vanguard, a leading DC plan administrator in the USA. Critically for our research purposes, the data contain information on plan design features (e.g. whether the plan uses automatic or voluntary enrollment), default distribution rules, and employee contribution and withdrawal behavior. Access to administrative records avoids problems associated with self-reported survey data, such as errors on retirement plan characteristics and wealth values.
We find that job turnover among new hires is frequent – 40% of our sample will separate from their jobs before the end of 2013, after an average tenure of just 1 year.Footnote 2 These job separations are a significant source of leakage (i.e., permanent losses from tax-deferred retirement accounts). Many separating employees take a cash distribution, particularly those with small balances. Even a significant portion of separated employees with balances over $5,000 take cash distributions at job separation. Notably, even after controlling for income and account balance size, individuals facing a default of a cash distribution are 37 percentage points more likely to take a cash distribution than individuals who are allowed to keep their savings in their (previous) employer's plan. Relatedly, those separating from plans with AE are significantly more likely to take a cash distribution than are those separating from VE plans. At the same time, AE is associated with large increases in plan participation. As a result, we find that individuals eligible to participate in automatic enrollment plans are considerably more likely to have accumulated retirement savings upon job separation than individuals eligible to participate in voluntary enrollment plans.
Our research is the first to examine both plan enrollment design and default distribution rules, the interaction between them, and how they impact leakage at job separation. Previous work has examined the relationship between enrollment rules and cash distributions at job separation, though lacked plan-level variation in default distribution rules. While our work is consistent with previous work in that we find that enrollment rules are important to distribution decisions, we also find that distribution rules are important predictors of cash-out behavior. Thus, much like in the participation decision, plan design rules can have a large impact on decisions about retirement savings at the point of job separation and should be carefully selected.
2. Related work
There is an established literature on the behavior of participants within US DC plans at the time of job change and retirement. Aon Hewitt (2011), using data from more than 1.8 million employees across more than 110 large DC plans, finds that 58% of employees changing jobs in 2010 retained funds in a tax-qualified vehicle (29% remained in the current plan and 29% rolled assets over to an IRA or other plan), while 42% took a cash distribution. They find no difference in the rates of choosing cash distributions at jobs under AE or VE plans, but they also did not look at distribution behavior by the plan's distribution rules. Copeland (Reference Copeland2013) and Purcell (Reference Purcell2009) use self-reported data from the Survey of Income and Program Participation (SIPP), and focus on distributions once the participant has left the plan. Measured on this basis, they find more than half of respondents cash out their distributions and just under half preserve their distributions in a tax-qualified vehicle. Engelhardt (Reference Engelhardt2002) finds that 28% of Health and Retirement Study (HRS) respondents who changed jobs rolled their retirement account (either defined benefit (DB) or DC) into a tax-qualified saving account or kept their account. Armour, Hurd and Rohwedder (Reference Armour, Hurd, Rohwedder and Wise2017) take advantage of the panel nature of the HRS to look at trends over time in cash-outs, and find a rising incidence in cash-outs between 1992 and 2004 among an older pre-retiree and retiree population.
There is also a growing literature on automatic enrollment in DC plans that considers some of the potential negative effects. Like our paper, Beshears et al. (Reference Beshears, Choi, Laibson and Madrian2018) examine both savings and withdrawal behavior and the impact of automatic enrollment. Using data from a single large firm that switched from voluntary to automatic enrollment, they find that automatic enrollment increases aggregate savings, though a meaningful portion of potential increased retirement wealth is lost to withdrawals. This is particularly true for separating employees, who forfeit over half the potential incremental savings to cash-outs. Our results are similar, though with a data set of 385 employer-sponsored plans, with both voluntary and automatic enrollment features and with a wide range of distribution rules, we are able to develop empirical estimates using greater firm and plan design heterogeneity.
This work is also related to Beshears et. al. (Reference Beshears, Choi, Laibson, Madrian and Skimmyhorn2017), which finds, using data for civilian Department of Defense employees, that automatic enrollment is associated with a possible increase in long-term debt, such as housing and automobile debt, but not with short-term credit card borrowing. Along with the research on plan distributions, this paper contributes to the observation that higher retirement plan savings from automatic enrollment may be partially offset by other behaviors over time.
3. Administrative data
We rely on administrative data from a leading DC recordkeeper for our analysis. One of the advantages of using administrative data is that we can directly observe an individual's retirement savings behavior such as participation and contributions as well as outcomes like account balances, as opposed to relying on self-reported survey data that relies on the respondent's accurate recall. Another advantage is that we have detailed information on plan design. Our data elements include whether the plan features automatic enrollment, the default fund allocation, the default contribution rate under automatic enrollment, any automatic escalation rules, whether the plan features any kind of employer match and contributions, and the plan's rules on account balances for separated employees. An important drawback relative to survey data is that we have relatively limited information on the individuals themselves: income, age, sex, and current DC account balance. In particular, we do not have data on household composition and finances, including retirement savings beyond the current DC account.
Our data encompasses approximately 563,000 newly hired employees who were eligible for their employer-sponsored retirement plan.Footnote 3 The sample covers newly eligible employees who were hired into one of 385 employer-sponsored DC plans between January 1, 2010, and December 31, 2013. We observe participation statuses, contribution rates, contribution amounts, account balances, and portfolio allocations on a monthly basis from January 1, 2010, through June 30, 2014. Other employee-level information contained in these data includes age, yearly income level, tenure with the employer, and termination date for those who leave employment. Finally, we observe whether account balances of separated employees are distributed or kept in the plan after separation.
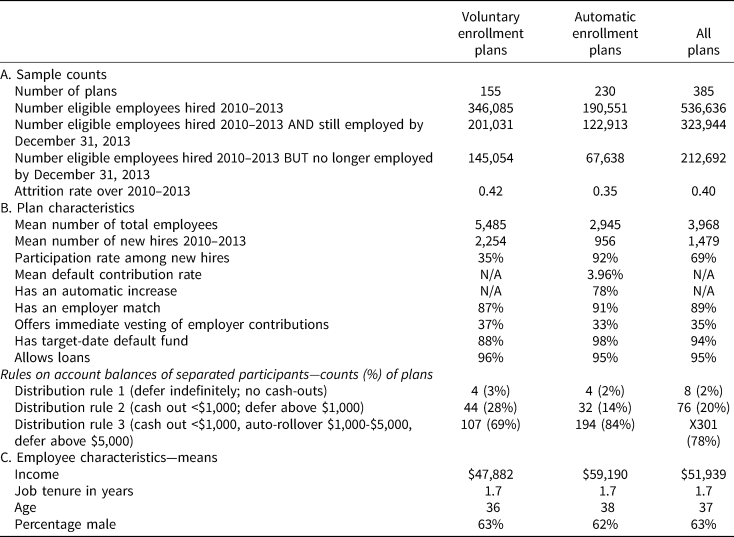
Table 1 describes our sample. As shown in Panel A, while the sample has more plans that offer AE than plans that offer VE, more employees were hired under VE during our time period than were hired under AE. Therefore, firms with VE plans hired more employees, on average, than did firms with AE plans. The attrition rate over the 4-year period for employees hired under AE is lower than the attrition rate for employees hired under VE (35 versus 42%).
Plan and employee characteristics

Source: Authors’ tabulations.
The plans that feature VE in our sample tend to be larger than AE plans in the sense that there are more eligible employees per VE plan than per AE plan (Table 1, Panel B). In line with past research, we find that participation rates (the percentage of eligible employees who participate in the plan) under AE plans are much greater than participation rates under VE plans. Thirty-five percent of eligible newly hired employees in VE plans participate in their plan, whereas 92% of eligible newly hired employees participate in AE plans (where we define newly hired as those hired since 2010 and participation in a plan as having ever made a contribution to the plan during a period of employment).
As for other features of the plans in our sample, again in Panel B, 78% of AE plans also automatically enroll participants into an automatic increase feature. The average default contribution rate (the percentage of salary that is contributed to the retirement account) for AE plans is 3.56%. Thirty-seven percent of VE plans and 33% of AE plans offer immediate vesting to employees in their plans. The vast majority of plans has an employer match, allow loans, and use a target date fund as the default investment allocation.
Panel B of Table 1 also presents the rules for what happens to retirement plan account balances when employees separate from employment. The plans in our sample use one of three different distribution rules. Very few plans use Distribution Rule 1, in which separated employees are allowed to keep any size account balance in the plan indefinitely, and in the absence of instructions from the separated employee, account balances will automatically remain in the plan. Twenty-eight percent of VE plans and 14% of AE plans use Distribution Rule 2, in which accounts with balances over $1,000 are allowed to stay in the plan, and this is the default. Balances below $1,000 are not allowed to stay in the plan and the default in these cases is a cash distribution in the absence of instructions from the separated employee. Distribution Rule 3 is by far the most prevalent. Sixty-nine percent of VE plans and 84% of AE plans follow Distribution Rule 3. Under this rule, balances over $5,000 are allowed to stay in the plan, and this is the default for these larger balances; for balances under $1,000, the default is a cash distribution; and for balances between $1,000 and $5,000 the default is to roll over the funds into an IRA.
Finally, Panel C of Table 1 presents characteristics of employees in our sample (including both plan participants and eligible non-participants). Mean wages are approximately $52,000, with employees in AE plans earning a higher wage than those in VE plans (about $59,000 versus $48,000 respectively). Job tenure is under 2 years, the median age is 37, and 63% of employees are male.
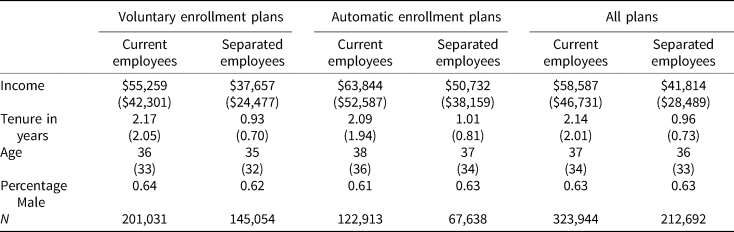
Table 2 compares demographic characteristics of current employees and separated employees. We define separated employees as individuals in our sample who are no longer active employees as of December 31, 2013. We define current employees as individuals who are still an active employee as of December 31, 2013. Current employees tend to be older, have longer tenure at the employer (in part by construction), and higher incomes than employees who separated (all differences statistically significant at 1% level).
Characteristics of current and separated employees

Notes: Data are presented as means, with corresponding medians in parentheses. Data for current employees are as of June 30, 2014 except for income, which is 2013 income for current employees. For separated employees, income averages are from one year prior to separation since incomes are truncated in the final year of employment. Other data for separated employees are also as of the last year of employment. Percentage male ignores the roughly 14% of individuals whose gender is not known.
Source: Authors’ tabulations.
4. Results
To examine our research question on the relationship between plan design and distribution decisions at job separation, we focus on the subgroup of employees who separate from their jobs and examine what, if anything, they do with their retirement accounts following separation and how that compares to their plans’ defaults. There are clear reasons to suspect that those who separate from jobs that offered AE plans will have differential outcomes than those who separate from employers offering VE plans. Those who separate from employers with VE plans and were participants in those plans prior to separation may be more active and motivated to save, as evidenced by their active choice to opt into their VE savings plan. These employees may be more likely upon separation to keep their accumulated savings in a tax-qualified retirement account such as their current plan, an IRA, or a new employer's plan. On the other hand, those who saved under AE plans may be more subject to the forces of inertia and thus more likely to follow whatever path is predetermined by the plan's design, whether that be to automatically roll over into an IRA, distribute the account as cash, or continue in the plan indefinitely.
Participant behavior following job separation
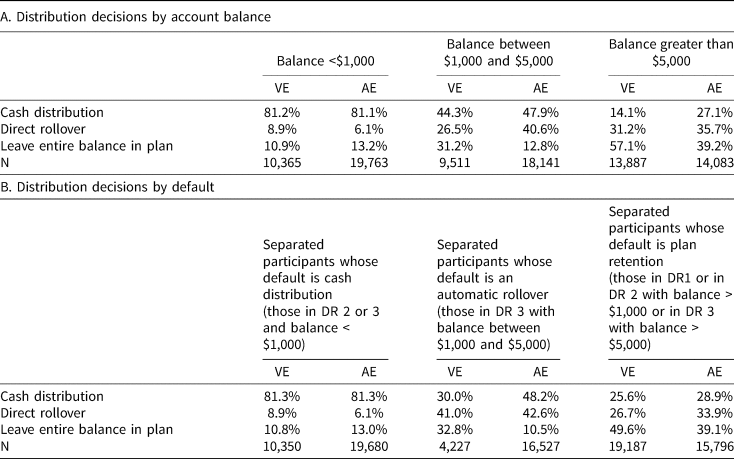
We begin by presenting an overview of the frequency of taking a cash distribution, rolling over funds into another tax-qualified retirement account (typically an IRA but sometimes another employer plan), or retaining the entire account balance in the plan (Table 3). We look at these distribution behaviors by account balance and by default rules since the relevant default action one's account will take depends on both factors.
Distribution decisions by account balance and by default regime

Notes: DR1 = any size balance can be kept in the plan; default is to keep balance in the plan. DR2 = balances over $1,000 allowed to be kept in the plan, default is to keep these balances in the plan; smaller balances cannot be kept in the plan and the default is a cash distribution. DR3 = balances over $5,000 allowed to be kept in the plan, default is to keep these balances in the plan; for balances between $1,000 and $5,000, the default is a rollover into an IRA; for balances under $1,000 the default is a cash distribution.
Source: Authors’ tabulations.
Note that taking a cash distribution and rolling over funds into another retirement account are not mutually exclusive. Some participants may take a portion of funds as a cash distribution and roll over remaining funds. Note that for each of these actions, our data do not allow us to distinguish whether the action was the result of an active choice or of a default rule taking hold. For example, we can only observe whether an account balance was rolled over into a tax-qualified retirement account. For those for whom their relevant default policy given their account size and plan rules is an automatic rollover, we cannot distinguish between those rollovers into an IRA that resulted from a default and an active rollover into a new employer's plan.
Panel A of Table 3 is broken down by accumulated balance attributable to the plan, whereas Panel B is broken down by the relevant default policy that the separated employee faces given his or her plan's rules and associated balance. Those separated participants who have accumulated small balances of less than $1,000, as well as those with mid-size balances between $1,000 and $5,000, are more likely to take a cash distribution than directly roll over the account or leave the balance in the plan, regardless of the distribution rule associated with their plan. There is a negligible difference across VE and AE plans in the rates of cash distributions for balances less than $1,000 (81.2 and 81.1%, respectively, with p-value = 0.81); those with mid-size balances from AE plans have slightly higher rates of cashing out than those from VE plans, 48 versus 44%, a statistically significant (p = 0.000) yet small difference. As balances increase, we see the rates of cash distribution monotonically decrease, and rates of rollovers generally increase.
For participants who have amassed savings in excess of $5,000 (where the default policy is to leave their money in the accounts across all distribution rules), many more savers are found to leave their entire balances in the account. Yet for those who do opt to take action, savers with balances over $5,000 under AE plans are much more likely than savers with over $5,000 under VE plans to actively seek a cash distribution (21.7% versus 14.1%, significant at 1% level), and are much less likely (39.2% versus 57.1%, significant at 1% level) to leave their money in the plan.
Panel B of Table 3 explores the actions separated employees take dependent on what the relevant default action is for them given their account sizes and the distribution rule associated with their plan. Separated participants who are subject to an automatic cash distribution (corresponding to those with balances less than $1,000 under distribution rules 2 or 3) are very likely to take cash distribution, with 81.3% of VE and AE separating participants taking a cash distribution (p-value = 0.94). Another 10.8 and 13.0% of VE and AE separated participants are yet to take any action (significant at 1%), and over time these accounts will be distributed in cash by the plan administrator in the absence of action taken by the separated participant. Separated participants subject to an automatic rollover (which corresponds to those under distribution rule 3 with balances between $1,000 and $5,000) who belong to a plan that features AE are much more likely to take a cash distribution than those in a VE plan: 48.2% of separated participants in an AE plan take a cash distribution versus 30.0% of separated participants from VE plans with these balance sizes (significant at 1%). In fact, unlike VE plan participants under this distribution rule, these AE separated participants are more likely to take a cash distribution than a direct rollover (48.2 versus 42.6%, a difference significant at 1% level). Finally, among separated participants whose accounts face automatic deferral, those belonging to an AE plan are less likely than those in VE plans to remain in the plan (39.1% versus 49.6%, significant at 1%). Slightly larger yet statistically significant (at 1% level) proportions of separated participants in AE plans take cash distributions and direct rollovers than separated participants in VE plans.Footnote 4
Multivariate results for distribution behaviors of job separators
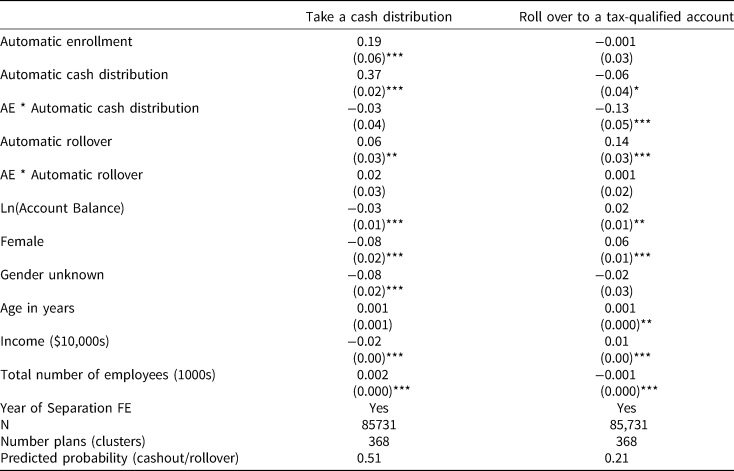
We now turn to multivariate regressions to gain a better understanding of how plan-level and individual-level characteristics relate to the distribution decisions (or lack thereof) of separated former participants. For each model, we include controls for what the default distribution policy will be for each individual given his or her associated plan's distribution rule combined with his or her account balance size at the time of their termination. That is, there are three effective default rules that can apply for each separated participant: deferring indefinitely, rolling over into an IRA or other tax-qualified account automatically, and an automatic cash distribution. In Table 4 below, for the set of separated participants, we first estimate an unconditional probit for two behaviors: the decision to take any cash distribution (column 1) and the decision to roll over any part of the distribution to a IRA or other tax-qualified account (column 2). In column 1, the dependent variable is an indicator variable that takes on the value 1 if we observe in our data that the separated participant takes a cash distribution from his or her account after job separation. In column 2, the dependent variable is an indicator variable that takes on the value 1 if we observe in our data that the separated participant rolls over any portion of his or her account into another tax-qualified retirement account after job separation.
Probability of taking a cash distribution or rolling over to another tax-qualified account

Notes: *p < 0.10, **p < 0.05, ***p < 0.01. Standard errors in parentheses clustered at plan-level. All models include the year of attrition fixed effects to control for macroeconomic factors. Column 1 shows marginal effects from a probit model where the dependent variable is the probability of taking any size cash distribution; Column 2, the probability of rolling over any part of funds. Omitted default rule category is automatic indefinite deferral in all estimations.
Source: Authors’ calculations.
Column 1 in Table 4 shows that separated participants from AE plans are 19 percentage points more likely to take a cash distribution than participants in VE plans, and this result is significant at the 1% level. Employees whose plan rules and balance sizes dictate that in the absence of an active choice their accounts will face an automatic cash distribution are 37 percentage points more likely to take a cash distribution than the omitted group, those whose accounts will allow them to defer indefinitely; this result is again significant at the 1% level. There is no difference in the estimated impact of this automatic cash distribution policy across those participants separating from AE versus VE plans as this interaction term is small in magnitude and insignificant. Interestingly, separated participants who face an automatic rollover are also 6 percentage points more likely to take a cash distribution that is the omitted group, which shows some active opting-out of the default rollover policy. In addition, females and those with higher incomes and higher account balances are significantly less likely to take a cash distribution. Cash distributions are slightly more likely among separated participants from larger firms.
Column 2 reports marginal effects from a probit model of the decision to roll over some amount of funds. As in Column 1, we find that an account holders’ plan default is a strong predictor of their action: those who face an automatic rollover are 14 percentage points more likely to roll over some funds relative to those who face an indefinite deferral. We see no differential response to the policy of automatic rollovers between those separating from AE versus VE plans. However, those subject to an automatic cash distribution are 6 percentage points less likely to roll over any amount of funds relative to those who are allowed to defer indefinitely. The effect of an automatic cash distribution policy is even stronger for those separating from AE plans, who are an additional 13 percentage points less likely to roll over any amount of funds relative to separating participants under VE plans who face an automatic cash distribution.
Employee aggregate retirement savings
Our analysis has so far considered the interplay between separating participants and default policy and plan design and has found that automatically enrolled participants, all things equal, are more likely to cash out their retirement savings. However, one of the important differences noted in Table 1 is that participation rates are more than two and a half times higher in AE plans (92%) versus VE plans (35%). As a result, there is a substantially larger population of retirement savers in AE plans than VE plans. What then are the aggregate effects on employee retirement savings of both automatic enrollment and these cash-out rules?
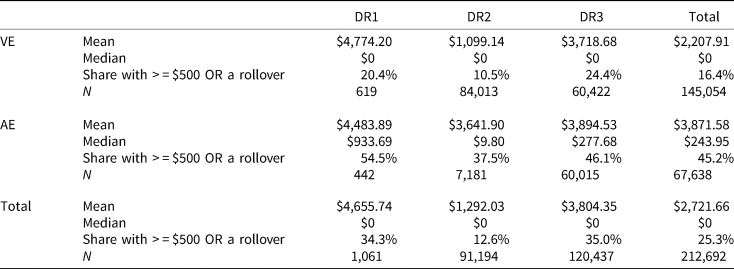
To answer this question, we expand our analysis to include not only those separating from service with retirement plan savings—but also those separating from service who did not contribute at all to the plan (i.e., the zero savers). We measure the total retirement savings that remain in the plan after any cash distributions, as well as the fraction of this sample that preserves $500 or more in either the current DC plan, an IRA, or other tax-qualified account.
Table 5 presents summary statistics for the population by both distribution default rules and plan design. The median retirement plan savings of VE employees separating from service (after any cash distributions) is $0. Only 16% of VE employees retain $500 or more in any tax-qualified account. By comparison, the median retirement savings after any cash distributions in AE plans is $244, and 45% of AE employees retain $500 or more in tax-qualified savings.
Employee retirement savings after cash distributions

Notes: DR1 = any size balance can be kept in the plan; default is to keep balance in the plan. DR2 = balances over $1,000 allowed to be kept in the plan, default is to keep these balances in the plan; smaller balances cannot be kept in the plan and the default is a cash distribution. DR3 = balances over $5,000 allowed to be kept in the plan, default is to keep these balances in the plan; for balances between $1,000 and $5,000, the default is a rollover into an IRA; for balances under $1,000 the default is a cash distribution.
Source: Authors’ tabulations.
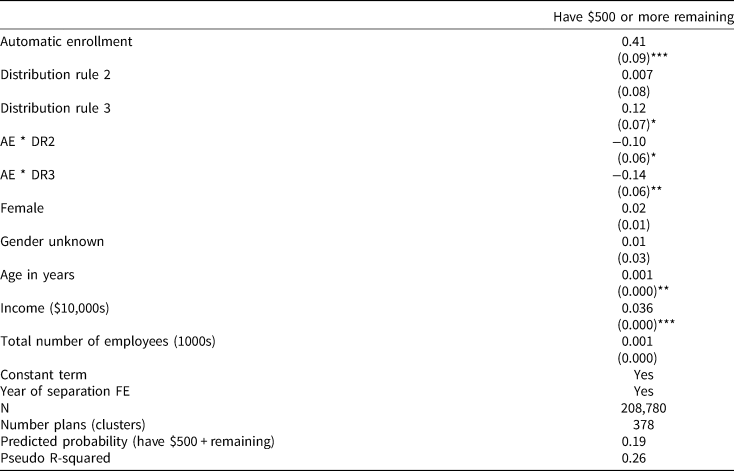
We now estimate a multivariate probit model for the outcome of having at least $500 in a tax-qualified account, whether the current employer plan or a rollover to an IRA or another qualified employer plan. Right-hand-side variables include the usual set of individual- and plan-level characteristics. Our dependent variable uses $500 as the threshold because we are interested in whether employees separate from a job with at least a modest balance of retirement savings, and $500 captures a substantial portion of the retirement wealth distribution. As seen in Table 5, the median balance for separating employees (after cash distributions) is $0. Table 6 shows that AE plans are 42 percentage points more likely to have balances of at least $500 remaining in their accounts or as rolled over amounts across all separated employees. Distribution rule 3 that features a rollover policy is positively associated with having some retirement savings under either AE or VE relative to other distribution rules, though this effect seems to be washed out by the effect of AE policies when looking at the interaction between DR3 and AE. Age and income are also positively related to having $500 in retirement savings, and females are slightly more likely to have some accumulated savings (2 percentage points), though this effect is just outside traditional significance bounds.
Probability of saving $500 or more after any cash distributions

Notes: *p < 0.10, **p < 0.05, ***p < 0.01. Standard errors in parentheses clustered at plan-level. All models include the year of attrition fixed effects to control for macroeconomic factors. Table reports marginal effects from a probit model where dependent variable is the probability of having $500 or more in any tax-deferred retirement vehicle after cash distributions. Omitted default rule category is automatic indefinite deferral in all estimations.
Source: Authors’ calculations.
5. Discussion and Conclusion
Our study considers the effect of plan design, tax policy default rules, and participant job market turnover on tax-qualified retirement savings. We use real-world administrative data on the retirement savings accounts of over a half million eligible employees across hundreds of employer-sponsored plans over a 1-year period. Our dataset includes rich details on the designs of those plans.
We find that in just a short, 4-year period covered by our data, fully 40% of those hired between 2010 and 2013 in our sample separated from their employers by the end of 2013, after a mean employment period of just 1 year – a high degree of job turnover. This turnover results in a substantial amount of leakage from retirement accounts. Over 80% of individuals with a small balance (under $1,000) take a cash distribution at job change, as do over a quarter of individuals with a large balance (over $5,000). These cash distributions potentially expose participants to a tax liability including a 10% penalty tax.
We also find that plan design is associated with distribution decisions at job separation. Individuals facing a default of a cash distribution are 37 percentage points more likely to take a cash distribution than individuals who are allowed to keep their savings in their (previous) employer's plan. Notably, we also find that individuals who participated in plans that feature automatic enrollment are 19 percentage points more likely to take a cash distribution than individuals who participated in plans that used voluntary enrollment.
Though automatic enrollment is associated with an increased rate of cash-outs at job separation, it also greatly increases participation in our sample. Over 90% of eligible employees in automatic enrollment plans participate, whereas only 35% of eligible employees in voluntary enrollment plans make a contribution during our window of analysis. As a result, eligible employees in automatic enrollment plans are significantly more likely to have accumulated retirement wealth post-job separation – they are 41% more likely to have $500 in a tax-qualified retirement account, even after cash distributions, than individuals eligible to participate in voluntary enrollment plans.
Automatic enrollment policies have risen in prominence over the past decade and have been found to greatly equalize participation and savings rates across income and racial groups. At the same time, our findings suggest that these effects are partially offset by cash-out behavior upon job change. Other research has noted a possible increase in household debt associated with automatic enrollment. These findings highlight two important points. First, the default effect found in automatic enrollment pertains equally to plan distribution behavior. Distributions that rely on inertia in human behavior and that encourage retention of tax-qualified savings result in more retirement savings, all other things equal, than those that encourage cash payments. Second, to better understand welfare effects, any default policy must be evaluated in the aggregate, across the entire financial situation of the household and across time, and not merely at the point of the initial decision.
Acknowledgement
We gratefully acknowledge the financial support of the Department of Labor, Employee Benefits Security Administration (EBSA). We also appreciate the invaluable feedback of EBSA staff on earlier drafts. We thank participants at several conferences and seminars for helpful comments and suggestion. All errors are our own.