Culture includes processes that operate at the individual and social levels, are connected to one's race and ethnicity, develop over time, have biological and environmental roots, and can play an important role in adaptation and maladaptation (Causadias, Reference Causadias2013). The developmental psychopathology literature has been criticized for its limited attention to culture (García Coll, Akerman, & Cicchetti, Reference García Coll, Akerman and Cicchetti2000) and, particularly, for its lack of attention to culture as a developmental process and one that is universal, rather than exclusive to ethnic–racial minorities (Causadias, Reference Causadias2013). In his “roadmap” recommendations for the integration of culture into developmental psychopathology, Causadias suggested that future work examine culture developmentally to better understand how cultural processes impact adaptation and maladaptation over time, rather than viewing culture as a fixed trait that is stable over time. In the current paper, I explain how the study of ethnic–racial identity provides a heuristic model for how culture can be examined developmentally and in relation to psychopathology. Moreover, I present the Identity Project intervention program (Umaña-Taylor & Douglass, Reference Umaña-Taylor, Douglass, Cabrera and Leyendecker2016), which is a universal health promotion intervention program designed to intervene in adolescents’ ethnic–racial identity development, as an illustration of how scientists studying culture can move from basic to translational research in an effort to better understand the role of cultural development in psychopathology. This approach addresses recommendations made by Causadias (Reference Causadias2013) and others (e.g., Cicchetti & Toth, Reference Cicchetti and Toth2006; Quintana, Reference Quintana2007) to conduct translational research, and interventions in particular, to advance the field. Although many of the ideas presented in this paper can likely apply to any societies characterized by considerable ethnic–racial diversity, the research, theory, and intervention presented here largely reflect work conducted in the United States.
Ethnic–Racial Identity Formation: An Important Developmental Task
Ethnic–racial identity, which is informed both by one's ethnic heritage (e.g., cultural values and traditions) and one's racialized experiences in a given sociohistorical context (e.g., ethnic–racial discrimination and racial privilege), is defined in part by the extent to which individuals have explored their ethnic–racial background and resolved the meaning of their group membership for their general self-concept (Umaña-Taylor et al., Reference Umaña-Taylor, O'Donnell, Knight, Roosa, Berkel and Nair2014; Umaña-Taylor, Yazedjian, & Bámaca-Gomez, Reference Umaña-Taylor, O'Donnell, Knight, Roosa, Berkel and Nair2004). This developmental conceptualization of ethnic–racial identity has evolved from Phinney's (Reference Phinney1989) seminal work on ethnic identity, which drew heavily from Erikson's (Reference Erikson1968) psychosocial theory of development and Marcia's (Reference Marcia and Adelson1980) operationalization of Erikson's conceptual notions. According to Erikson (Reference Erikson1968), a major task of human development is the formation of an identity. Individuals have a universal need to examine themselves with respect to their values, life goals, and perceived abilities, and to come to a synthesis of who they were, who they are, and who they believe they can become (Erikson, Reference Erikson1968). The process of identity formation involves synthesizing one's identity among multiple domains and social identities (e.g., occupation and gender), as individuals’ identities are multifaceted and constantly evolving as a function of environmental contingencies (Erikson, Reference Erikson1968). Following from these theoretical notions, ethnic–racial identity is a normative developmental process that arises from an individual's basic need for identity coherence (Umaña-Taylor, Reference Umaña-Taylor, Balter and Tamis-LeMonda2016a).
Other conceptualizations of ethnic–racial identity draw on models introduced by Cross (Reference Cross1971, Reference Cross1991), Helms (Reference Helms1990), or Sellers and colleagues (Sellers, Rowley, Chavous, Shelton, & Smith, Reference Sellers, Rowley, Chavous, Shelton and Smith1997; Sellers, Smith, Shelton, Rowley, & Chavous, Reference Sellers, Smith, Shelton, Rowley and Chavous1998). In contrast to an Eriksonian framework (Erikson, Reference Erikson1968), these models tend to focus more attention on the content of ethnic–racial identity such as the experience of epiphanies that lead to increased consciousness of one's ethnic–racial background, rather than an age-graded developmental progression of awareness that is prompted by increases in social and cognitive maturity that accompanies adolescence. In addition, Cross's and Helms's models focus on the process of ethnic–racial identity for adults, whereas an Eriksonian framework explicitly considers the developmental period of adolescence as a unique period in the life span that has explicit implications for identity formation.
From an Eriksonian perspective, the developmental processes of ethnic–racial identity exploration and ethnic–racial identity resolution are critical to the identity formation process. Together, they ensure that individuals have a clear sense of how their ethnic–racial background plays a role in defining who they are, and they have reached this sense of clarity via a process of exploration in which they have gathered information, considered multiple options, and participated in activities that helped them learn more about this aspect of their identity. As noted by Erikson (Reference Erikson1968), individuals who are unable to resolve their identities in a manner that gives them a clear sense of who they are and who they can become will experience identity confusion, which can have negative consequences such as limiting the individual's ability to develop close relationships with others. In addition, Erikson (Reference Erikson1968) emphasizes that a clear sense of identity must be achieved via a process of earnest exploration in which individuals actively examine their identities and consider multiple possibilities for their future. With respect to ethnic–racial identity, exploration is essential for enabling youth to develop an informed understanding of their ethnic–racial background, one that is actively developed rather than passively attained by blindly adopting their parents’ or other significant socializers’ views (Umaña-Taylor, Reference Umaña-Taylor, Balter and Tamis-LeMonda2016a). Furthermore, having engaged in exploration provides youth with a sense of self-assuredness regarding their sense of clarity, which can give youth a sense of inner strength from which to engage with others on issues related to race and ethnicity. As described in detail, below, ethnic–racial identity formation is expected to follow an age-graded developmental trend in which normative increases in exploration and resolution are evidenced from early adolescence through late adolescence and into young adulthood.
The Developmental Progression of Ethnic–Racial Identity
As previously introduced, identity formation is a key developmental task of the life span that takes prominence during the developmental period of adolescence (Erikson, Reference Erikson1968). Prior to adolescence, children's development with respect to their ethnic–racial group membership begins in early childhood, with the ability to differentiate the self and others along the lines of race and ethnicity (Umaña-Taylor et al., Reference Umaña-Taylor, O'Donnell, Knight, Roosa, Berkel and Nair2014). Gains in cognitive abilities during this developmental period enable learning ethnic–racial categories and labels (for self and others), and during early to middle to childhood, children increasingly gain knowledge about specific ethnic–racial groups, including language, behaviors, and traditions, and begin to understand ethnic–racial constancy (i.e., that one's ethnic–racial background cannot change as a function of superficial changes in appearance or behaviors; Umaña-Taylor et al., Reference Umaña-Taylor, O'Donnell, Knight, Roosa, Berkel and Nair2014). Although identity begins to form at earlier developmental periods (and continues to evolve across the life span), the advances in cognitive maturity (i.e., abstract thinking, introspection, advanced perspective taking, and other forms of social cognition) that characterize the period of adolescence are essential for individuals’ capabilities to think about their identity as an abstract construct that is informed by previous experiences and possibilities for the future. Furthermore, the gains in social development that take place during adolescence, in which individuals are given more freedom to engage with environments outside the home and gain autonomy in decision making, also make this developmental period particularly relevant to a process that involves individuals exploring new options and considering their possible selves as potentially different from that of their parents.
With respect to ethnic–racial identity, the cognitive advances evidenced in adolescence are essential for identity development in this domain because the constructs of race and ethnicity are abstract, and the social norms and perspectives that surround these concepts are not straightforward. Youth need advanced cognitive abilities to enable an understanding of these realities and how they play a role in the individual's sense of self (Umaña-Taylor et al., Reference Umaña-Taylor, O'Donnell, Knight, Roosa, Berkel and Nair2014). Furthermore, the sociocontextual changes that characterize the developmental period of adolescence, such as transitioning into larger and more diverse schools and gaining exposure to nonfamilial settings, are also critical for motivating the ethnic–racial identity developmental process. This is the case because it is in contexts in which individuals notice difference that they begin to more carefully consider who they are with respect to the identity domain in which they are noticing difference (Turner, Hogg, Oakes, Reicher, & Wetherell, Reference Turner, Hogg, Oakes, Reicher and Wetherell1987; Umaña-Taylor, Reference Umaña-Taylor2004).
It is important to note that the age-graded developmental trends in ethnic–racial identity formation (e.g., increases in ethnic–racial identity exploration from early adolescence through late adolescence) are a function of both biological changes (e.g., increases in cognitive maturity) and sociocontextual/environmental changes that are closely, though not exclusively, tied to age (e.g., greater exposure to diversity as youth navigate more nonfamilial settings). Thus, changes in ethnic–racial identity are expected due to increased social exposure, which is closely tied to developmental maturation. For instance, during this developmental period, adolescents are increasingly allowed to venture outside the home as they age; adolescents transition from smaller schools to larger schools that consist of more diverse student bodies; and their social worlds expand to include individuals outside of school settings such as work. In addition, cognitive changes (which are a direct function of age maturation) make it increasingly possible for adolescents to think about this aspect of their identity as they evolve their conception of who they are and who they hope to become. These changes (i.e., incremental increases in exploration and resolution) are theorized to continue throughout the developmental period of adolescence, as youth continuously invent and reinvent themselves according to their observations of the social contexts that pervade their lives and as they contemplate how they fit into any given society.
In terms of how this process continuously evolves throughout adolescence, youth will engage in greater ethnic–racial identity exploration in middle school (i.e., early to middle adolescence), relative to elementary school, because they are increasingly able to think about their ethnic–racial background as a meaningful social attribute that informs who they are (i.e., due to increased cognitive abilities). In high school (i.e., middle to late adolescence), youth will engage in greater exploration, relative to middle school, because they are more likely to encounter experiences of ethnic–racial discrimination due to a more diverse school setting in which issues of race and ethnicity are more salient. In addition, during this time, youth are more likely to be exposed to (and be able to understand) current events depicting ethnic–racial conflict in society. For both ethnic–racial minority and majority youth, these contextually based experiences will prompt ethnic–racial identity exploration as adolescents more deeply consider how this identity domain (i.e., race–ethnicity) plays a role in defining their sense of self. Although personal experiences of ethnic–racial discrimination are more likely for members of ethnic–racial minority groups, because they (or members of their ethnic–racial group) are more likely to be victims of such marginalization, White youth are also expected to become increasingly aware of their race and ethnicity as a meaningful part of their identity as issues of race and ethnicity take a center stage in US society (Rivas-Drake & Umaña-Taylor, Reference Rivas-Drake and Umaña-Taylor2019). Prior work has demonstrated that in contexts in which race and ethnicity are salient to White youth, ethnic–racial identity appears to follow a similar developmental progression (Syed & Azmitia, Reference Syed and Azmitia2009) and to be linked with adjustment (Phinney, Reference Phinney1992; Umaña-Taylor & Shin, Reference Umaña-Taylor and Shin2007) in a similar manner as to what has been observed among members of the ethnic–racial minority.
However, as noted in the example above regarding current events, sociocontextual experiences interact with biological changes (e.g., cognitive abilities) to inform adolescents’ ethnic–racial identity formation. Without increased cognitive abilities, the social exposure would result in limited change in ethnic–racial identity formation; similarly, without the social exposure, the increased cognitive abilities would likely not lead to much change in ethnic–racial identity. In the context of the United States, and particularly in the current sociopolitical environment in which issues of race and ethnicity are central to everyday discourse and the tone of these conversations is typically not amicable (Kaplan, Reference Kaplan2011), it is safe to say that ethnic–racial identity formation will progress throughout the developmental period of adolescence as individuals gain increased cognitive abilities that enable them to think about these abstract constructs as a salient part of who they are and who they will become. Furthermore, the theoretical notions described here, though discussed in a manner specific to the US context, likely apply to any nation with considerable ethnic–racial diversity.
In the past decade, several longitudinal studies with ethnically, geographically, and developmentally diverse samples have provided empirical evidence supporting the notion that ethnic–racial identity exploration and resolution follow an age-graded developmental progression from early to late adolescence. For instance, one study conducted in the Southwest United States with Mexican-origin adolescents found that a majority of the sample transitioned, during the 5th grade to the 7th grade, toward profiles characterized by greater ethnic–racial identity exploration (Matsunaga, Hecht, Elek, & Ndiaye, Reference Matsunaga, Hecht, Elek and Ndiaye2010). Similarly, Huang and Stormshak (Reference Huang and Stormshak2011) followed a sample of adolescents (Latino/Hispanics, African American, Asian/Pacific Islander American, American Indian/Native American, and multiethnic) from 6th through 9th grades in the Pacific Northwest region of the United States, and found that the pattern of change that characterized a majority of adolescents in their sample was one in which youth reported significant increases in exploration and resolution of their ethnic–racial identity during these 4 years.
In the Northeast United States, African American, Latino, and European American adolescents reported significant increases in ethnic–racial identity exploration from the 8th to the 10th grade (French, Seidman, Allen, & Aber, Reference French, Seidman, Allen and Aber2006). Furthermore, in a study conducted in the Midwestern United States, with Latino 9th and 10th graders who were followed for 4 years, the trajectory of change from middle to late adolescence that was most common was one in which adolescents’ ethnic–racial identity exploration and resolution increased significantly over the course of the study (Douglass & Umaña-Taylor, Reference Douglass and Umaña-Taylor2015). Finally, increases in exploration and resolution were also evidenced in a longitudinal study that followed Black, Latino, Asian American, and White youth from their first year of college into their senior year (Syed & Azmitia, Reference Syed and Azmitia2009). Together, these findings support theoretical notions of normative, age-graded increases in ethnic–racial identity exploration and resolution from early to late adolescence. Furthermore, Syed and Azmitia's (Reference Syed and Azmitia2009) work demonstrates the continuously evolving nature of ethnic–racial identity development into adulthood, particularly for college-attending youth.
In contrast to the above, Pahl and Way (Reference Pahl and Way2006) did not find significant increases in ethnic–racial identity exploration among Black and Latino youth from 10th grade to 1 year after high school. Their study, however, was conducted in an urban high school in the Northeast United States, which had a student body composed predominately of ethnic–racial minority students. It is possible that this feature of the social context inhibited (or did not engage) exploration among study participants due to a relatively more limited salience of race–ethnicity in that particular school context. Their follow-up analyses indicated that greater experiences with peer discrimination in 10th grade significantly predicted changes in ethnic–racial identity exploration over time (Pahl & Way, Reference Pahl and Way2006). Thus, it is possible that in a setting in which race–ethnicity is relatively less salient, other contextual realities such as being victimized by peers due to race and ethnicity can engage the process of exploration.
In terms of the impetus for change in ethnic–racial identity development, in a synthesis of developmental ethnic–racial identity models and supporting empirical work, Quintana (Reference Quintana2007) concluded that empirical work does not support the theoretical notion that a crisis (Phinney, Reference Phinney, Bernal and Knight1993) or an encounter (Cross, Reference Cross, Ponterotto, Casas, Suzuki and Alexander1995) is what triggers increases in ethnic–racial identity exploration that are evidenced during adolescence. Researchers have rarely provided empirical support for the conceptual notion that crises or encounters were the impetus for changes in ethnic–racial identity during adolescence (see Syed & Azmitia, Reference Syed and Azmitia2008, for an exception with retrospective accounts from young adults); however, adolescents do experience encounters on a daily basis in which issues of race and ethnicity are raised to the fore (Douglass, Mirpuri, English, & Yip, Reference Douglass, Mirpuri, English and Yip2016; Rivas-Drake & Umaña-Taylor, Reference Rivas-Drake and Umaña-Taylor2019). Youth witness peers who are members of ethnic–racial minority groups being disciplined more harshly and disproportionately relative to White youth (Finn & Servoss, Reference Finn and Servoss2014; Skiba, Michael, Nardo, & Peterson, Reference Skiba, Michael, Nardo and Peterson2002); youth regularly hear “jokes” that explicitly rely on ethnic–racial stereotypes to incite humor, oftentimes attacking one's own ethnic–racial group (Douglass et al., Reference Douglass, Mirpuri, English and Yip2016); and youths’ exposure to issues of race and ethnicity on social media is constant and relentless (Tynes et al., Reference Tynes, Rose, Hiss, Umaña-Taylor, Mitchell and Williams2014; Tynes, Umaña-Taylor, Rose, Lin, & Anderson, Reference Tynes, Umaña-Taylor, Rose, Lin and Anderson2012). Thus, youth are bombarded with information regarding race and ethnicity daily; these encounters form the social context within which adolescents are developing their identities, and these experiences constitute part of the information on which adolescents rely when they are attempting to answer the question “Who am I?” that is so central to the developmental period of adolescence. Consistent with this idea, in Phinney's early work, she noted that there was no evidence that the Black, Latino, and Asian participants in her study who were actively engaged in ethnic–racial exploration had experienced any type of dramatic encounter or experience, and instead, she concluded that their engagement in exploration was likely the result of “an increasing awareness of the importance of the issue and the need to understand it” (Phinney, Reference Phinney1989, p. 26).
In summary, these daily ethnic- and race-related experiences that are pervasive in youths’ lives increase the salience of race and ethnicity as an important aspect of one's identity and play an important role in the age-graded developmental increases in ethnic–racial identity that are evidenced from early to late adolescence (Umaña-Taylor, Reference Umaña-Taylor, Balter and Tamis-LeMonda2016a). Furthermore, the gains in social and cognitive maturity that characterize the developmental period of adolescence make it such that (a) adolescents are increasingly exposed to these experiences as they age, and (b) they have the cognitive capabilities to think about abstract social constructs such as race and ethnicity and to consider how they inform their overall conception of the self (Umaña-Taylor, Reference Umaña-Taylor, Balter and Tamis-LeMonda2016a; Umaña-Taylor et al., Reference Umaña-Taylor, O'Donnell, Knight, Roosa, Berkel and Nair2014). In sum, by studying the contextual realities that pervade adolescents’ lives, assessing youth over time as they mature both biologically and socially, and examining their behavioral patterns (e.g., exploration) and the psychological meaning that they attach to the ethnic–racial domain of their identity, we are able to assess the development of culture over time.
Ethnic–Racial Identity and Adaptation
Turning now to adaptation, there is an abundance of literature that has examined the links between ethnic–racial identity and indices of individuals’ adaptation and maladaptation. In developmental conceptualizations of ethnic–racial identity, these associations are theorized to be a function of the benefits gained from engagement in the identity formation process (Umaña-Taylor, Reference Umaña-Taylor, Balter and Tamis-LeMonda2016a). Specifically, Erikson's (Reference Erikson1968) theory of psychosocial development suggests that individuals successfully pass through the stage of identity versus role confusion only if they have immersed themselves in a process of self-examination in which they carefully reflect on their past and present, and consider the multiple possibilities that exist for their future. Furthermore, those who have successfully passed through this stage will have, as a result of their thorough self-examination, come to a clear sense of resolution regarding their identity, including their values, goals, and future plans. Successful passage through this stage is theorized to lead to many psychosocial benefits, such as the ability to establish close and meaningful relationships with others, a greater sense of inner strength, and greater self-assurance (Erikson, Reference Erikson1968). Similar to the benefits that were theorized by Erikson (Reference Erikson1968), adolescents who have engaged in greater exploration and have a greater sense of clarity regarding their ethnic–racial identity are also expected to reap psychosocial benefits such as developing a stronger self-concept, having higher self-esteem, and experiencing better mental health (Phinney, Reference Phinney1992; Phinney & Kohatsu, Reference Phinney, Kohatsu, Schulenberg, Maggs and Hurrelmann1997; Umaña-Taylor, Reference Umaña-Taylor, Balter and Tamis-LeMonda2016a). Consistent with ideas advanced by Erikson (Reference Erikson1968), having a greater sense of clarity regarding one's ethnic–racial background that has been achieved via a process of exploration is expected to provide youth with greater self-confidence and understanding regarding this aspect of their identity (Phinney, Reference Phinney1992; Umaña-Taylor, Reference Umaña-Taylor, Balter and Tamis-LeMonda2016a).
In the past three decades, a plethora of studies have examined ethnic–racial identity in relation to adolescent adjustment. Despite extensive research on this topic, the literature is not easy to synthesize due to significant methodological limitations such as conflating developmental with nondevelopmental aspects of ethnic–racial identity in existing measures (Schwartz et al., Reference Schwartz, Syed, Yip, Knight, Umaña-Taylor and Rivas-Drake2014; Umaña-Taylor et al., Reference Umaña-Taylor, Yazedjian and Bámaca-Gómez2004). Even conclusions drawn from existing meta-analyses are based largely on findings from studies that used composite scores that conflate ethnic–racial identity developmental processes (e.g., exploration and resolution) and content dimensions (e.g., positive affect). For example, in Smith and Silva's (Reference Smith and Silva2011) meta-analysis of studies examining ethnic identity and well-being, 69% of the 184 studies identified used the Multigroup Ethnic Identity Measure (Phinney, Reference Phinney1992), which confounds ethnic–racial identity resolution with ethnic–racial identity affirmation (Umaña-Taylor et al., Reference Umaña-Taylor, Yazedjian and Bámaca-Gómez2004). Furthermore, Smith and Silva's (Reference Smith and Silva2011) meta-analysis does not specify which dimension of ethnic–racial identity is being examined in the studies included in the meta-analysis. In another meta-analysis focused on ethnic–racial identity, Miller-Cotto and Byrnes (Reference Miller-Cotto and Byrnes2016) provided a more nuanced examination of ethnic–racial identity by analyzing findings based on specific dimensions of ethnic–racial identity (e.g., private regard/positive affect, public regard, exploration, centrality, and resolution). This methodological nuance was important but given Miller-Cotto and Byrnes's (Reference Miller-Cotto and Byrnes2016) exclusive focus on academic achievement as an outcome, their meta-analysis of 47 studies only included 2 studies that examined ethnic–racial identity exploration or resolution, which negates the benefits of a meta-analysis and limits their ability to elucidate the role of these dimensions on adolescent adjustment.
Thus, given the current state of the field, it is difficult to synthesize the literature, even when relying on existing meta-analyses. Nevertheless, the preponderance of evidence from the studies that have examined developmental components of ethnic–racial identity supports the notion that adolescents who have engaged in greater exploration regarding their ethnic–racial background, and those who have a clearer sense of the personal meaning that this aspect of their identity has for their sense of self, are better adjusted in a number of domains, such as self-esteem (Kenyon & Carter, Reference Kenyon and Carter2011; Umaña-Taylor & Updegraff, Reference Umaña-Taylor and Updegraff2007), mental health (Street, Harris-Britt, & Walker-Barnes, Reference Street, Harris-Britt and Walker-Barnes2009; Tynes et al., Reference Tynes, Umaña-Taylor, Rose, Lin and Anderson2012; Umaña-Taylor et al., Reference Umaña-Taylor, O'Donnell, Knight, Roosa, Berkel and Nair2014), self-efficacy (Knight, Carlo, Streit, & White, Reference Knight, Carlo, Streit and White2017), coping efficacy (Swenson & Prelow, Reference Swenson and Prelow2005), adaptive coping (Umaña-Taylor, Vargas-Chanes, Garcia, & Gonzales-Backen, Reference Umaña-Taylor, Vargas-Chanes, Garcia and Gonzales-Backen2008; White, Umaña-Taylor, Knight, & Zeiders, Reference White, Umaña-Taylor, Knight and Zeiders2011), and academic outcomes (Borrero & Yeh, Reference Borrero and Yeh2011; Chang & Lee, Reference Chang and Lee2010; Umaña-Taylor, Tynes, Toomey, Williams, & Mitchell, Reference Umaña-Taylor, Tynes, Toomey, Williams and Mitchell2015).
Some longitudinal studies have also examined whether changes in ethnic–racial identity development over time are linked with positive outcomes among youth. For example, among a sample of African American, Dominican, Chinese, and White early adolescents, increases in exploration significantly predicted adolescents’ more positive feelings about their ethnic-group membership (Hughes, Del Toro, & Way, Reference Hughes, Del Toro and Way2017); relatedly, in other work, positive feelings about group membership have been linked with physiological benefits (Zeiders, Causadias, & White, Reference Zeiders, Causadias and White2018). In another study, which followed a sample of Mexican-origin adolescent mothers from middle to late adolescence, significant increases in ethnic–racial identity exploration predicted significant increases in self-esteem and decreases in risk-taking behaviors over the 6 years of the study (Umaña-Taylor, Updegraff, Jahromi, & Zeiders, Reference Umaña-Taylor, Updegraff, Jahromi and Zeiders2015). Similarly, another study found that as Mexican-origin girls increased in ethnic–racial identity exploration from middle to late adolescence, they also demonstrated significant decreases in depressive symptoms (Gonzales-Backen, Bámaca-Colbert, & Allen, Reference Gonzales-Backen, Bámaca-Colbert and Allen2016).
Thus, empirical work has provided significant evidence to support the theoretical notions that ethnic–racial identity is a normative developmental process that has consequences for young people's adaptation. Following from this significant body of work, and in an effort to consider the possibilities for translational work in the area of ethnic–racial identity development, my program of research turned toward investigating whether it was possible to intervene in this normative developmental task and whether such intervention would result in better adaptation and lower maladaptive functioning among youth. Such an approach was directly in line with prevention scientists’ recommendations that the field should invest more in promotion efforts focused on the achievement of developmental competencies, as this serves as an important foundation from which to develop future competencies that are essential for adjustment (National Research Council and Institute of Medicine, Reference O'Connell, Boat and Warner2009). As such, the development of the Identity Project intervention program began. Via an extensive process that took approximately 18 months, we developed the theoretical model guiding the intervention, used a mixed-method design to create and refine the Identity Project curriculum, created an attention control curriculum, and established a collaboration with a school partner to conduct an initial small-scale randomized control efficacy trial of the Identity Project (see Umaña-Taylor & Douglass, Reference Umaña-Taylor, Douglass, Cabrera and Leyendecker2016).
Overview of the Identity Project
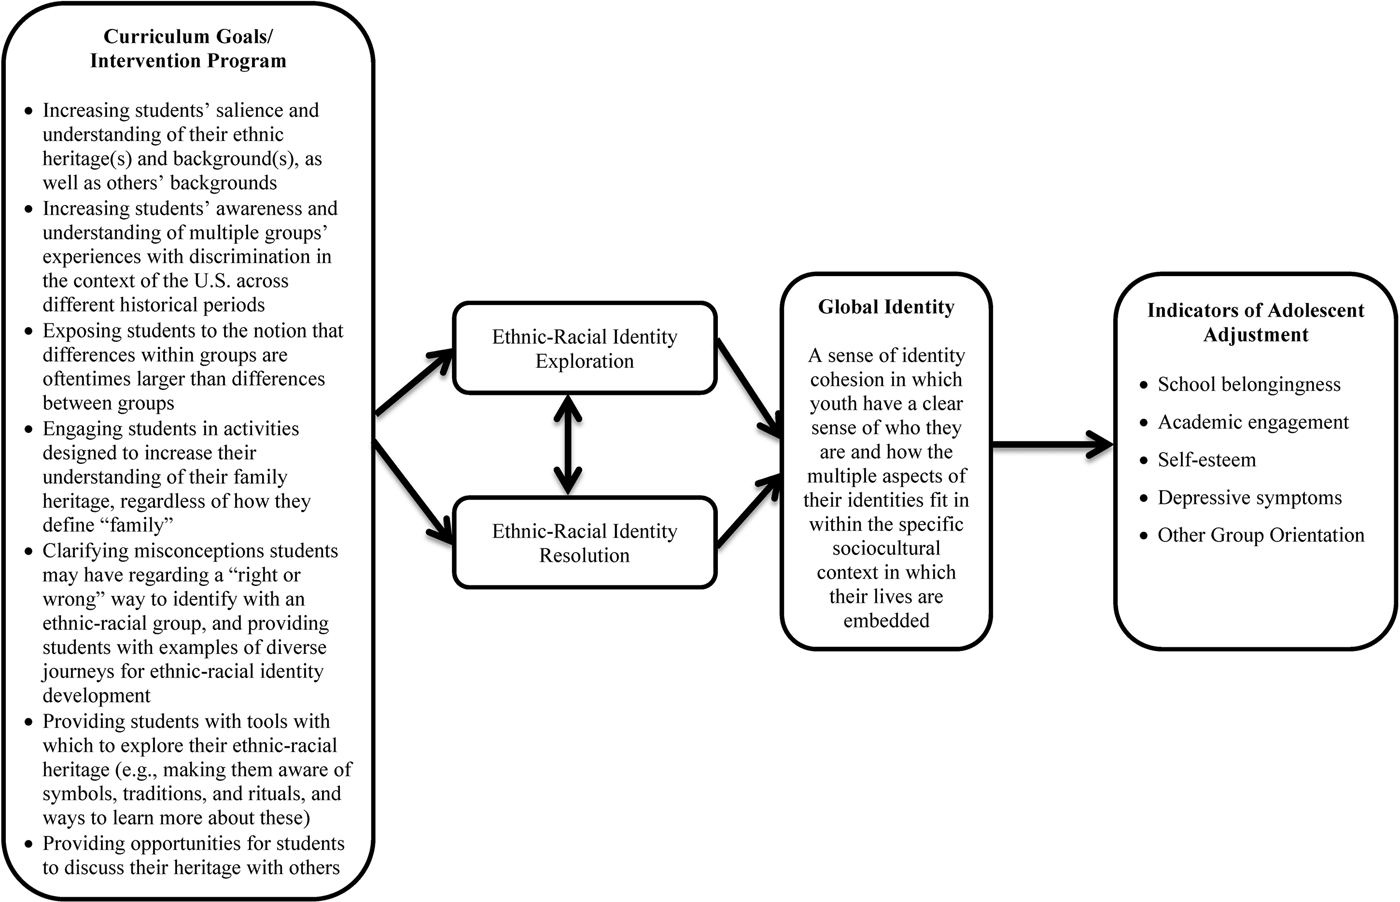
The Identity Project was developed as a health promotion intervention program designed to enhance adolescents’ abilities to achieve the developmental competency of ethnic–racial identity formation (Umaña-Taylor & Douglass, Reference Umaña-Taylor, Douglass, Cabrera and Leyendecker2016). The theoretical model guiding the intervention posed that program elements that (a) exposed youth to the concepts of ethnic–racial stereotypes and discrimination, historical experiences of discrimination in the United States for different groups, and an understanding of within-group versus between-group differences; (b) taught youth strategies and tools to enable exploration of their own ethnic–racial background, and provided a space within which students could engage in such a process; (c) exposed youth to the notion that their ethnic–racial identity is one of many domains that make up their identity, and explained that there is no right or wrong way to identify with one's ethnic–racial background; and (d) provided opportunities for students to examine their heritage, discuss their background with others, and learn about others’ background, would, in effect, lead to increases in adolescents’ ethnic–racial identity exploration and resolution (Umaña-Taylor & Douglass, Reference Umaña-Taylor, Douglass, Cabrera and Leyendecker2016). These increases in exploration and resolution would lead to greater global identity cohesion (i.e., less identity confusion; per Erikson, Reference Erikson1968), and ultimately to increases in positive adjustment and decreases in negative adjustment (see Figure 1; Umaña-Taylor & Douglass, Reference Umaña-Taylor, Douglass, Cabrera and Leyendecker2016; Umaña-Taylor, Douglass, Updegraff, & Marsiglia, Reference Umaña-Taylor, Douglass, Updegraff and Marsiglia2018).
Theory of intervention guiding the Identity Project Intervention Program. Reprinted with permission from Umaña-Taylor and Douglass (Reference Umaña-Taylor, Douglass, Cabrera and Leyendecker2016).

The targets of the Identity Project intervention were ethnic–racial identity exploration and resolution, given that these components of ethnic–racial identity formation are essential aspects of the normative developmental task of identity formation (Umaña-Taylor & Douglass, Reference Umaña-Taylor, Douglass, Cabrera and Leyendecker2016; Umaña-Taylor et al., Reference Umaña-Taylor, O'Donnell, Knight, Roosa, Berkel and Nair2014). The program was designed to be delivered in a school-based setting, by a single instructor, via eight 1-hr weekly sessions. The objectives of the eight sessions are detailed in Umaña-Taylor, Douglass, et al. (Reference Umaña-Taylor, Douglass, Updegraff and Marsiglia2018). Generally, the curriculum was designed to begin with an introduction to basic concepts and, specifically, to the notion of identity as a multifaceted and fluid construct that could change as a function of time and space (e.g., at different developmental periods and in different situational contexts). Students were encouraged to think about all of the different identities that make up who they are; then, students were introduced to the concepts of race and ethnicity, and a discussion ensued explaining that these are social identities and that they inform one's global identity. Another lesson focused on understanding the difference between stereotypes and discrimination, and on learning about the experiences of discrimination for different ethnic–racial groups throughout the course of US history. Students also learned about genetic variations that exist between ethnic–racial groups versus within groups, and that the differences that exist between groups are continuous rather than categorical. Another lesson focused on students creating a family tree in which they documented the ethnic–racial background and place of birth of their family members going back three generations; to ensure that this activity was accessible to all students, they were encouraged to focus on their social family, including adoptive and fictive kin, rather than limiting themselves to biological kin. Within each of the eight sessions, students engaged in active learning.
Although all lessons began with a brief lecture to orient students to the topic and provide important definitions, every lesson involved active participation by students in which they shared their experiences and perspectives with their peers in dyads or triads and then brought their ideas to a large group discussion with the entire class. This pedagogical strategy was an essential program element because, in the qualitative work our team conducted during the program development stage of the intervention, students indicated that they often learned most about their own ethnic–racial background when they were learning about others’ (Umaña-Taylor & Douglass, Reference Umaña-Taylor, Douglass, Cabrera and Leyendecker2016). This approach also is consistent with prior work noting that programs that focus on awareness and inclusion of diverse ethnic–racial perspectives facilitate the identity development of individual participants (Spears, Reference Spears2004), and with Markus, Steele, and Steele's (Reference Markus, Steele and Steele2000) identity safety model proposed for educational settings, in which group differences are acknowledged, accepted, and respected.
Another important characteristic of the Identity Project program was the emphasis placed on providing students with tools with which to engage in exploration and to consider the meaning and role of their ethnic–racial background in their lives, but it was entirely up to youth to engage in these processes on their own (e.g., via homework assignments and via their participation in class activities). This was important because conceptual work underscores that it is essential that the synthesis of one's identity evolve as a function of one's own exploration and meaning making, rather than a blind adherence to others’ views or perspectives (Phinney, Reference Phinney, Bernal and Knight1993; Umaña-Taylor, Reference Umaña-Taylor, Balter and Tamis-LeMonda2016a).
Finally, the Identity Project intervention program was developed to be applicable to youth from any ethnic–racial minority or majority group. This decision was informed by conceptual notions that ethnic–racial identity is a developmental competency that should be fostered among all youth, particularly in contexts such as the United States in which issues of race and ethnicity are highly salient (Umaña-Taylor et al., Reference Umaña-Taylor, O'Donnell, Knight, Roosa, Berkel and Nair2014; Williams, Tolan, Durkee, Francois, & Anderson, Reference Williams, Tolan, Durkee, Francois and Anderson2012). As articulated by Helms (Reference Helms1990), although the content of one's ethnic–racial identity is different for individuals from ethnic–racial minority and majority backgrounds, the process by which such identities unfold does not differ. However, because culture, and ethnic–racial identity by extension, is typically viewed as something that is possessed exclusively by ethnic–racial minorities and not by members of the ethnic–racial majority (Causadias, Reference Causadias2013), there are few studies that provide empirical data comparing the ethnic–racial identity development of Whites to that of ethnic–racial minority group members. Nevertheless, in one study that examined changes in exploration, but not resolution, findings indicated that the ethnic–racial identity exploration of both ethnic–racial minority and majority students increased significantly from middle to late adolescence; furthermore, rates of change did not differ significantly between majority and minority groups (French et al., Reference French, Seidman, Allen and Aber2006). In another study that followed ethnic–racial majority and minority (i.e., Latino, Black, and Asian American) college students over a 3-year period, findings indicated that students from both groups significantly increased in their ethnic–racial identity exploration and resolution. Further, the rates of change were similar between the two groups (Syed & Azmitia, Reference Syed and Azmitia2009), consistent with French et al.’s (Reference French, Seidman, Allen and Aber2006) findings. These findings support a major foundational premise of the Identity Project: ethnic–racial minority and majority youth alike engage in the developmental process of ethnic–racial identity formation. In this way, the Identity Project intervention is making significant strides in the literature by recognizing the importance of cultural processes in individuals from all ethnic–racial groups and not falling into the cultural (mis)attribution bias in which the development of ethnic–racial minorities is perceived to be informed primarily by culture while the development of Whites is perceived to be shaped primarily by individual-level psychological processes that are not culturally informed (Causadias, Vitriol, & Atkin, Reference Causadias, Vitriol and Atkin2018).
In sum, the focus of the Identity Project on adolescents’ ethnic–racial group identity is critical because it is based on this group identity that individuals experience social degradation and insults on a regular basis (or witness these acts against those who are members of other ethnic–racial groups). Therefore, addressing this specific identity domain is essential for helping youth gain the tools with which to understand their own identity in this regard. The Identity Project was designed to capitalize on a developmental process that is already taking place, and to provide youth with opportunities to engage with this process perhaps more quickly than they would have otherwise. This is important for minority youth, as the images they see and the messages they receive are often portraying their group in a negative light, yet it is within this social context that they are having to define themselves. However, for majority youth this developmental task is also important, as it helps them understand the role they play in actively resisting the continuation of such discrimination (Rivas-Drake & Umaña-Taylor, Reference Rivas-Drake and Umaña-Taylor2019).
Findings From the Identity Project Intervention
The short- (Umaña-Taylor, Douglass, et al., Reference Umaña-Taylor, Douglass, Updegraff and Marsiglia2018) and long-term (Umaña-Taylor, Kornienko, Bayless, & Updegraff, Reference Umaña-Taylor, Kornienko, Douglass and Updegraff2018) effects of the Identity Project intervention were tested via a small-scale randomized efficacy trial conducted in a high school in the Southwest region of the United States. The intervention was tested among students enrolled in an elective course targeted to all 9th-grade students at the high school. A total of eight classrooms were randomized, resulting in 116 students in the treatment group and 102 in the control group. Students in the treatment group received the Identity Project curriculum; those in the control condition received a curriculum (also developed by the research team) that focused on teaching students about educational and career options after high school, the type of training or education needed for different options, and how to find out about admissions requirements and financial aid. The author or a postdoctoral fellow taught all lessons (intervention and control). Furthermore, both conditions were assigned the same amount of homework and experienced the same of amount of contact time with session leaders. The lessons for both groups were simultaneously implemented across a 10-week period beginning the week after students returned from winter break.
Participants (M age = 15.02, SD = 0.68; 50% female) included 53 Black, 66 Latino, 6 Asian American, 13 American Indian, and 80 White students, which generally mirrored the ethnic–racial demographics of the school student body the year the intervention was implemented (21% Black, 28% Latino, 4% Asian, 3% American Indian, 39% White, and 6% other; National Center for Education Statistics, 2017). There were no significant differences between those randomized into treatment versus control conditions on the following demographics: age, gender, nativity status, free/reduced-lunch status, or parental education. American Indian adolescents were more likely to be randomly assigned to the intervention versus the control condition, but no other ethnic–racial group differences emerged (Umaña-Taylor, Douglass, et al., Reference Umaña-Taylor, Douglass, Updegraff and Marsiglia2018).
To test the efficacy of the intervention, adolescents completed self-administered surveys the week before the first lesson (Time 1), 12 weeks after Time 1 (Time 2), 18 weeks after Time 1 (Time 3), and 67 weeks after Time 1 (Time 4). At Time 1, no significant differences emerged between adolescents in the treatment group and those in the control group on any of the study constructs: ethnic–racial identity exploration, ethnic–racial identity resolution, global identity cohesion, grades, academic engagement, depressive symptoms, other group orientation (i.e., positive attitudes toward and interactions with ethnic–racial out-group members), and self-esteem (see Umaña-Taylor, Kornienko, Douglas, & Updegraff, Reference Umaña-Taylor, Kornienko, Douglass and Updegraff2018, for detailed results).
Findings from the short-term effects of the intervention (i.e., pretest to 18-weeks posttest) demonstrated that adolescents in the treatment condition reported significantly higher levels of exploration relative to adolescents in the control condition at Time 2, demonstrating a small effect size (Cohen's d = 0.26). Furthermore, the significant increases in exploration produced by the intervention led to significant increases in ethnic–racial identity resolution at Time 3, only for adolescents in the treatment condition, demonstrating a very large effect size with a Cohen's d of 1.48 (Umaña-Taylor, Douglass, et al., Reference Umaña-Taylor, Douglass, Updegraff and Marsiglia2018). In addition, an alternate model was tested, reversing the causal order such that the intervention was tested as a predictor of Time 2 resolution, and Time 2 resolution predicted Time 3 exploration; no support emerged for this alternate model (Umaña-Taylor, Douglass, et al., Reference Umaña-Taylor, Douglass, Updegraff and Marsiglia2018). All analyses controlled for ethnic–racial majority/minority status. These findings provided initial support for the theoretical model guiding the intervention. The Identity Project intervention did increase adolescents’ ethnic–racial identity exploration and resolution. The next step was to examine whether those increases had downstream effects on adolescents’ psychosocial adjustment.
The long-term effects of the intervention were tested approximately 1 year after Time 3. Specifically, findings indicated that the increases in exploration at Time 2 and resolution at Time 3 that emerged as a function of assignment into the treatment versus control condition at Time 1 were significantly associated with higher global identity cohesion, higher self-esteem, higher grades, and lower depressive symptoms 1 year later (Umaña-Taylor, Kornienko, et al., Reference Umaña-Taylor, Kornienko, Douglass and Updegraff2018). Effect sizes for chain sequential mediation analyses that tested the downstream impact of the intervention from Time 2 to Time 4 were larger for youth in the intervention versus control conditions. Specifically, global identity cohesion at Time 4 increased by 0.20 SD for every 1 SD increase in Time 2 ethnic–racial identity exploration via Time 3 ethnic–racial identity resolution for adolescents in the intervention group, whereas Time 4 global identity cohesion for adolescents in the control group only increased by 0.06 SD. Similarly, Time 4 self-esteem increased by 0.20 SD for every 1 SD increase in Time 2 ethnic–racial identity exploration via Time 3 ethnic–racial identity resolution for youth in the intervention group, whereas this figure was 0.04 SD for the control group. Grades at Time 4 increased by 0.03 SD for youth in the intervention condition relative to a 0.01 SD increase for those in the control condition; in addition, depressive symptoms at Time 4 decreased by 0.15 SD for every 1 SD increase in Time 2 ethnic–racial identity exploration via Time 3 ethnic–racial identity resolution for youth in the intervention condition, while Time 4 depressive symptoms for youth in the control condition decreased only by 0.04 SD.
We also examined whether ethnic–racial majority/minority status would modify these associations. We found no support for moderation, and thus, the process was statistically equivalent for White versus ethnic–racial minority youth (Umaña-Taylor, Kornienko, et al., Reference Umaña-Taylor, Kornienko, Douglass and Updegraff2018). This finding supports Helms's (Reference Helms1990) argument that the process by which individuals develop their ethnic–racial identity is similar across ethnic–racial majority and minority group members. It extends Helms's (Reference Helms1990) ideas, however, to also provide support for the notion that both ethnic–racial minority and ethnic–racial majority group members gain benefits from engaging in this normative developmental process.
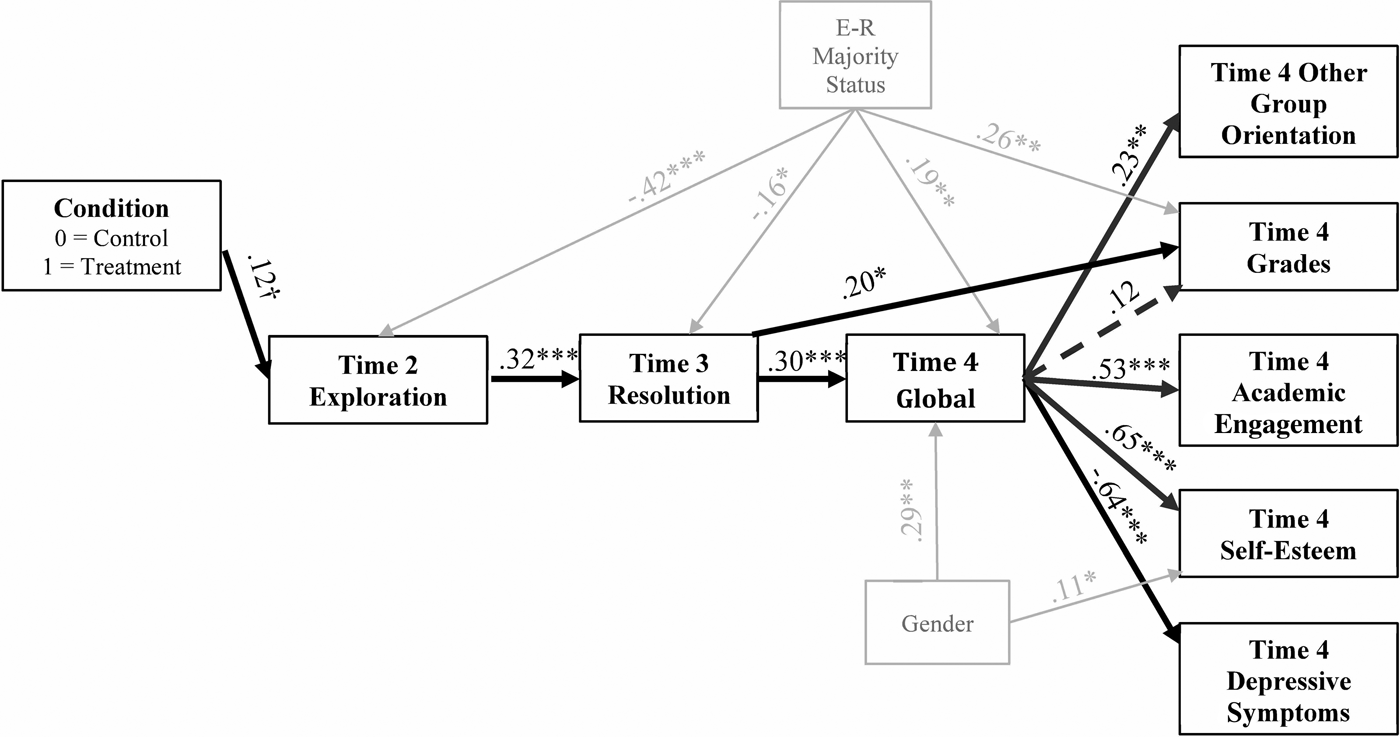
Another alternate model was tested that more closely mirrored the theory of intervention, in which global identity cohesion was examined as a mediator of the links between ethnic–racial identity resolution and each of the indices of psychosocial adjustment. Findings indicated that increases in exploration and resolution were significantly associated with higher global identity cohesion and, in turn, with more positive other group orientation, higher grades (trend level), higher academic engagement, higher self-esteem, and lower depressive symptoms (see Figure 2). In addition, we found significant mediation from the intervention condition to grades via exploration and resolution (see Umaña-Taylor, Kornienko, et al., Reference Umaña-Taylor, Kornienko, Douglass and Updegraff2018, for detailed results).
Alternate model testing the indirect effect of the Identity Project Intervention via Time 2 exploration, Time 3 resolution, and Time 4 global identity cohesion to Time 4 psychosocial adjustment. Direct effect of condition on each dependent variable was estimated. E-R Majority status (0 = ethnic–racial minority, 1 = White) and gender (1 = male, 0 = female) are included as controls. Standardized estimates are presented. Bolded black lines indicate significant indirect effects (p < .05); dashed black lines indicate trend level of indirect effects (p < .10); gray lines indicate control variables. Originally presented in Umaña-Taylor, Kornienko, et al. (Reference Umaña-Taylor, Kornienko, Douglass and Updegraff2018). ***p < .001, **p < .01, *p < .05, †p = .05 (all two-tailed).

Overall, findings supported the theory of intervention and provided preliminary evidence that the Identity Project curriculum could increase adolescents’ engagement in the process of ethnic–racial identity development, and that such engagement would be associated with adolescents’ positive adjustment over time. The increase in exploration and resolution that led to increased global identity cohesion also offered empirical support for a major conceptual argument, namely, that engagement in the process of ethnic–racial identity development plays a significant role in adolescents’ global identity formation.
Implications, Challenges, and Future Directions
Causadias (Reference Causadias2013) contrasted social-level and individual-level culture by noting that social-level cultural processes refer broadly to community practices, meanings, behaviors, and mental processes that are iteratively renegotiated by members within a given community, whereas individual-level cultural processes “develop over time in relation to social-level cultural processes and operate in multiple areas of functioning, including the cognitive, behavioral, biological, social, and emotional domains” (p. 1376). Because both are essential for the construal of the cultural self, Causadias (Reference Causadias2013) emphasized the need to address both levels in our understanding of how culture informs developmental psychopathology. The Identity Project intervention program tackles the development of individual-level culture (i.e., one's ethnic–racial identity development) by making students aware of social-level culture. The program does this by helping youth to understand the meaning making that takes place on a more macro societal level with respect to culture, while simultaneously helping them recognize the agency that they have in defining themselves and determining who they are and who they can become. The potential to intervene in individual-level cultural development in this manner is promising, particularly considering the positive implications this dimension of culture has on individuals’ adjustment. Nevertheless, there are several challenges to consider.
Addressing ethnic–racial identity development in school settings
One of the most significant challenges involves implementation of the Identity Project as part of the general education curriculum in school settings. Identity is a social product that evolves, in part, via social interactions with others and engagement in a broader society; this interdependence makes the settings in which individuals’ lives are embedded critical for the identity formation process (Markus et al., Reference Markus, Steele and Steele2000). One such setting in which adolescents spend a significant portion of their day is school. In this sense, the delivery of the Identity Project curriculum in the school setting is ideal. Furthermore, by offering programs such as these in the school setting, we increase the chances that more youth will be able to benefit from this resource. With this in mind, the Identity Project was designed to be implemented as part of the general education curriculum for 9th-grade students throughout all regions of the United States. We did this by ensuring that one person (i.e., a teacher) could deliver the curriculum during a 55-min class period for eight consecutive sessions that took place once per week. In addition, we included many diverse examples and suggested slight modifications in the lesson plans to enable teachers to modify the curriculum to meet the unique needs of their classroom (e.g., how to address issues of adoption and multiethnic backgrounds). Furthermore, the lessons were designed to apply to youth from any ethnic–racial background and not specific to any single group. Thus, the curriculum itself is not what poses a challenge to implementation in the school setting; rather, the challenge comes, in part, from the current sociohistorical context in which issues of race and ethnicity are not readily discussed in school settings and pose concerns for school administrators.
For the past two decades, I have partnered with numerous public schools (mostly high schools) across three different states in the Midwest and Southwest United States to conduct research with adolescents. My studies have always included a focus on ethnic–racial identity, and I have not obscured this focus during my school recruitment process. Throughout the years, multiple schools have respectfully declined my request to partner with them explicitly because of my focus on issues of race and ethnicity. One principal explained that anything dealing with race or ethnicity raised a red flag with teachers and parents, just as issues of sex and drugs raised red flags. Research has documented the challenges educators experience when discussing issues of race and ethnicity in schools (Flynn, Reference Flynn2012; Jett & Cross, Reference Jett and Cross2016), which likely contributes to administrators’ hesitation to engage with research or intervention programming that directly addresses issues of race and ethnicity.
It is unfortunate that schools are hesitant to include programming focused on race and ethnicity, particularly because empirical work notes that nurturing an academic environment in which diversity is recognized, supported, and respected can have significant positive consequences for student outcomes. For example, Brown and Chu (Reference Brown and Chu2012) studied Mexican immigrant children across 19 schools and found that children who were attending schools that were characterized as more strongly valuing multiculturalism and diversity tended to perceive relatively lower levels of ethnic–racial discrimination; furthermore, students whose teachers reported more strongly valuing diversity tended to have more positive ethnic identities. Ultimately, a school climate that supported diversity was associated with significant academic benefits for youth, in terms of academic attitudes, school belonging, and academic performance (Brown & Chu, Reference Brown and Chu2012). Similarly, in a study of 11- to 15-year-old Asian American, African American, and Latino students, those who perceived the school climate as more supportive of multiculturalism and diversity tended to also report more positive peer relationships and greater civic engagement; in turn, these constructs were associated with lower engagement in interpersonal violence (Lee & Johansen, Reference Lee and Johansen2011).
In a similar vein, school contexts that silence issues of diversity or promote a colorblind approach in which diversity is not acknowledged can be detrimental. For instance, using an experimental design, Apfelbaum, Pauker, Sommers, and Ambady (Reference Apfelbaum, Pauker, Sommers and Ambady2010) found that adopting a colorblind approach versus one that acknowledged and respected diversity in educational settings was associated with a greater likelihood of students not being able to detect racial victimization and a greater likelihood that their description of the event to their teachers would not prompt adult intervention. Furthermore, in a school-based study consisting mostly of Black youth, Byrd (Reference Byrd2015) found that students who perceived their school context to be more consistent with a colorblind approach (e.g., students are told that race does not matter) tended to report lower school belonging and lower academic competence; furthermore, higher perceived colorblindness was associated with lower academic motivation via its association with school belonging. Thus, messages that encourage students to ignore race can lead students to feeling less connected at school and, in turn, viewing their academic abilities more negatively (Byrd, Reference Byrd2015).
Unfortunately, societal norms are such that talking about race is taboo (Pauker, Apfelbaum, & Spitzer, Reference Pauker, Apfelbaum and Spitzer2015). Students demonstrate their understanding of this societal norm via their own reluctance to talk about race (Pauker et al., Reference Pauker, Apfelbaum and Spitzer2015). Similar reluctance has been documented among teachers (Kaplan, Reference Kaplan2011; Pollock, Reference Pollock2004). Thus, students and teachers alike generally are hesitant to discuss issues of race or ethnicity. Everyone wants to believe that race no longer matters, but race matters (Kaplan, Reference Kaplan2011). Race influences our perceptions of one another, the decisions that we make, and how we judge others’ behaviors and opinions (Kaplan, Reference Kaplan2011). In addition, research shows that teachers are critically important for instilling norms regarding how students handle issues of race and ethnicity (Pauker et al., Reference Pauker, Apfelbaum and Spitzer2015). In discussing how the United States can move toward a more inclusive and accepting society along the lines of race and ethnicity, Kaplan (Reference Kaplan2011) noted that “perhaps even more important than corporate diversity initiatives are training programs for teachers and administrators in the nation's schools” (p. 117).
Beyond the benefits that programs such as the Identity Project will bring to schools, it also is important to embed programs such as the Identity Project in school curricula because this approach increases the likelihood that all youth will benefit from this programming, rather than limiting participation to youth who self-select, or whose parents self-select them into these experiences. Making this a part of compulsory education ensures that select demographic groups are not excluded. When programs are offered as after-school or extracurricular programs, many key sociodemographic factors play a role in determining whether youth will be able to participate (Roth & Brooks-Gunn, Reference Roth and Brooks-Gunn2016). For instance, youth from more disadvantaged communities and ethnic–racial minority groups are less likely to engage in these programs or engage in a more limited way (Bouffard et al., Reference Bouffard, Wimer, Caronongan, Little, Dearing and Simpkins2006). Furthermore, barriers that are disproportionately more common among ethnic–racial minority youth, such as after-school responsibilities of caring for younger siblings, work responsibilities, and safety issues, also limit participation (Terzian, Giesen, & Mbwana, Reference Terzian, Giesen and Mbwana2009). These barriers disproportionately limit program participation of low socioeconomic status and ethnic–racial minority youth and families. There is no empirical evidence to demonstrate how participation would vary for the Identity Project program if it were offered as an after-school activity; however, given the current ethnic–racial conflict-ridden nature of our society, and the potential for participation to be reduced if offered as an extracurricular, it is imperative that programs such as the Identity Project get integrated into our schools’ general education curricula.
In addition, as we consider how to expand the reach of the Identity Project intervention, it will be important to consider adapting the program for implementation with university students. As previously discussed, ethnic–racial identity development is a process that is continuously revisited throughout the life span, and there is evidence of college students’ (Syed & Azmitia, Reference Syed and Azmitia2009) and young adults’ (Umaña-Taylor, Zeiders, & Updegraff, Reference Umaña-Taylor, Zeiders and Updegraff2013) engagement in this process. The psychosocial benefits of ethnic–racial identity development, particularly for students of color (e.g., Smith & Silva, Reference Smith and Silva2011), could potentially contribute to narrowing the achievement gap in higher education. Moreover, an especially important audience in the university setting for the Identity Project intervention will be students who are training for careers in education. As previously noted, there is some reluctance among teachers to discuss issues of race (Kaplan, Reference Kaplan2011; Pollock, Reference Pollock2004), yet teachers play an important role in setting the tone for how students will handle issues of race and ethnicity in school settings (Pauker et al., Reference Pauker, Apfelbaum and Spitzer2015). As a result, intervening with educators-in-training in a manner that enables them to have a more informed understanding of their own ethnic–racial identity could have significant ripple effects by impacting how they handle issues of race and ethnicity in their classrooms and their preparedness for delivering curricula that is designed to promote ethnic–racial identity development among their students.
Nevertheless, in considering how to partner with school districts or universities and gain their interest in implementing programs such as the Identity Project, it will be important to not overly emphasize (or exaggerate) the benefits of the program, which are currently based on limited findings. Instead, it may be useful to emphasize the importance of promoting programming that meets students’ needs for social–emotional development and raising awareness of ethnic–racial diversity. As noted by Eagly (Reference Eagly2016), scientists must be cautious when advocating for diversity initiatives and representing their research findings as evidence for policy changes. In such cases, it is sometimes more appropriate to emphasize the social justice gains from potential policy changes than to unintentionally mislead stakeholders by overstating findings (Eagly, Reference Eagly2016).
Specific experiences, specific times, specific effects, specific people
Before considering the scale-up of the Identity Project intervention in school settings, there are many questions that must be addressed regarding the efficacy of the program with specific groups and in specific contexts. Bornstein's (Reference Bornstein2017) specificity principle indicates that “the life-span development of specific characteristics in specific individuals is affected by specific experiences in specific ways at specific times” (p. 5). He further explains that “The specificity principle advances a theory that is particularistic in nature, such that development depends on several separate identifiable factors, including the experience involved, who experiences and who generates the experience, when in life the experience occurs, how the experience occurs, and the domain of development affected by the experience” (p. 5). With respect to ethnic–racial identity development, there is significant variability in contexts (both macro, such as geographical regions, and micro, such as schools and family) and individual characteristics (e.g., gender, age, ethnic–racial group, and nativity status) that inform the unique nuances that characterize development. Nevertheless, as underscored by Bornstein (Reference Bornstein2017), in the midst of all of this variability, it is possible to identify aspects of any given developmental process that are generalizable (i.e., universal). Considering ethnic–racial identity development, I would argue that what is generalizable is the notion that ethnic–racial identity formation is an age-graded developmental process, and that engaging in exploration and developing a sense of resolution regarding this identity domain is beneficial for all youth because it meets a basic human need for identity cohesion. These are the universal aspects of this construct, and what make a curriculum such as the Identity Project amenable to universal programming.
Nevertheless, variability in the contexts (e.g., family) and individual characteristics (ethnic–racial group membership) that define individuals’ lives inevitably play a significant role in how youth engage with programs such as the Identity Project and, in turn, the efficacy of such programs in modifying ethnic–racial identity development. This is also consistent with the concept of differential effectiveness in prevention science, in which some program participants will benefit more than others due to individual differences or unique ecological circumstances (Greenberg & Lippold, Reference Greenberg and Lippold2013). As such, there are several research questions that must be addressed to examine the differential effectiveness of the Identity Project, which will enable the identification of these contingencies and inform context-specific modifications that are necessary to strengthen the Identity Project's efficacy in particular settings (e.g., school with a given majority/minority composition), with particular people (e.g., ethnic–racial minority vs. ethnic–racial majority), and at particular times (e.g., developmental age).
In their review of youth development programming, Roth and Brooks-Gunn (Reference Roth and Brooks-Gunn2016) make a similar observation: youth vary, both in terms of individual characteristics and in terms of the unique contextual characteristics that define their lived experiences such as their peers, family context, and neighborhoods. There is no clear answer to whether some features of programs have a great impact on certain youth compared to others, but there is a need to identify core features of programs that can be applied broadly, and specific features required for programs that target specific populations. These are the next steps for the Identity Project.
It is also important to note here that, to date, all research on ethnic–racial identity draws on typically developing samples of youth, with respect to cognitive development. Given the lack of research, the extent to which issues of race and ethnicity are salient to youth with cognitive developmental delays is unclear, and this is an area for future research.
Variability as a function of ethnic–racial group membership
The initial efficacy testing of the Identity Project examined whether program effects were moderated by ethnic–racial majority versus minority status. Findings suggested no moderation; however, the sample was relatively small, and we were unable to examine differential effectiveness of the program by specific ethnic–racial groups (e.g., Black, Latino, and Asian American). Directly examining this variability will be important for confirming the universal nature of the program and ensuring that it can be delivered to youth from all backgrounds.
Turning back to Causadias's (Reference Causadias2013) noted concern that culture is largely considered to be relevant only to ethnic–racial minorities, the Identity Project intervention program addressed this issue in its inception by developing a curriculum that would be relevant to members of ethnic–racial minority and majority groups alike. As previously noted, tackling issues of race and ethnicity is critical for youth from all backgrounds in the United States, given the current inescapable conflict-ridden nature of US society based on issues of race, ethnicity, and immigration (Kaplan, Reference Kaplan2011; Umaña-Taylor, Reference Umaña-Taylor, Schwartz, Luyckx and Vignoles2011). Ethnic–racial majority youth are aware of these conflicts and deal with them on a daily basis in the media, their schools, and possibly their neighborhoods. As they are forming their identities and concretizing their values and beliefs, part of the information that they rely on to inform their identity is related to their own ethnic–racial position in society. Nevertheless, developing a program that meets the needs of students with vastly different experiences of privilege and marginalization can pose unique challenges. Thus, an important future direction for research in this area will be to understand whether there are unique modules that would increase program efficacy in settings with predominately White students.
In this vein, it is interesting to consider how the notion of equifinality in development and psychopathology applies to this topic, in which there are many different developmental experiences that can ultimately lead to a similar outcome of positive adaptation or maladjustment (Cicchetti & Rogosch, Reference Cicchetti and Rogosch1996). For instance, White and ethnic–racial minority adolescents participating in the Identity Project may similarly advance in their ethnic–racial identity development and reach similarly high levels of exploration and resolution that promote global identity cohesion and positive adjustment; however, the manner by which White and ethnic–racial minority youth achieve their strong ethnic–racial identity may be qualitatively different. For White youth, an achieved ethnic–racial identity will need to involve exploring and considering an identity that they believed did not exist (i.e., going against the commonly held assumption that culture is something that is only relevant for ethnic–racial minorities). In contrast, for minority youth, the process will involve an acknowledgment that their identity with respect to their ethnic–racial minority group membership is worthy of exploration and recognition (i.e., going against the expectation that ethnic–racial minorities should assimilate to the mainstream White culture).
In addition, a unique aspect of this process for White youth must involve developing an understanding of their ethnic–racial group's position of power and privilege in society (Helms, Reference Helms1990; also see Spanierman, Reference Spanierman, Salett and Koslow2015, for an overview of White racial identity development). Although the Identity Project curriculum does not currently directly address issues of power and White privilege, this is an aspect of the curriculum that I am in the process of modifying, and an important future direction will involve testing whether this increases the efficacy of the program, particularly for White youth. In sum, although there are some similarities expected in the content of what aspects of their ethnic–racial identity youth will explore (e.g., heritage, ancestry, or cultural traditions), there will certainly be differences with respect to what they will learn regarding the unique positions of power, privilege, and marginalization of their ethnic–racial group and the meaning-making process in which they must engage in order to consider how this informs their sense of self with respect to race and ethnicity.
Variability as a function of school ethnic–racial composition
Closely related to the above, the next phase of efficacy testing for the Identity Project must involve multiple school settings that vary according to ethnic–racial composition. Studies have demonstrated that salience of race and ethnicity among students varies according to the ethnic–racial characteristics of their school student body (e.g., Douglass, Mirpuri, & Yip, Reference Douglass, Mirpuri and Yip2017; Juang, Nguyen, & Lin, Reference Juang, Nguyen and Lin2006; Umaña-Taylor, Reference Umaña-Taylor2004). Attention to this variable also requires attention to the individual's ethnic–racial background. Put simply, it is the interaction of an individual's ethnic–racial background and the ethnic–racial composition of the school context that will have to be examined in relation to program efficacy. For example, the effectiveness of the program may be different for a Latino adolescent attending a predominately Latino school versus a Black adolescent attending a predominately Latino school. Likewise, it will be important to investigate whether program effects are comparable for ethnic–racial minority youth from specific backgrounds (e.g., Asian American vs. Black) in school settings that are predominately White. Self-categorization theory (Turner et al., Reference Turner, Hogg, Oakes, Reicher and Wetherell1987) suggests that a prerequisite for a social group identity to be salient is an uneven distribution of resources and power based on the given social identity. Because race and ethnicity will vary in salience across these diverse contexts, it is necessary to understand under which conditions the program is most effective for which groups. This information will be valuable for introducing programming modifications for specific populations in specific contexts.
Variability as a function of geographical context
The United States has a complex history with respect to issues of race, ethnicity, and immigration. Moreover, the treatment and experiences of particular ethnic–racial groups vary according to the geographical region of interest due to distinct patterns of settlement for specific groups in particular regions of the United States. For example, in the West and Southwest, the majority of the Latino population is of Mexican origin, partly because many of the territories in this area were part of Mexico before they were acquired by the United States in the Mexican-American War, partly because of the US government's labor policies that encouraged migration from Mexico, and partly because of the close proximity to Mexico in this part of the country (Engstrom, Reference Engstrom, Cafferty and Engstrom2000). The Asian American population also is differentially dispersed throughout the United States, with 45% of the population found in the West, and 31% concentrated in a single state: California (Lopez, Ruiz, & Patten, Reference Lopez, Ruiz and Patten2017). Similarly, the Black population in the United States is more heavily concentrated in the South (i.e., 55% of the Black US population), and least represented in the West (i.e., 9.8%; Rastogi, Johnson, Hoeffel, & Drewery, Reference Rastogi, Johnson, Hoeffel and Drewery2011). The unique historical context of ethnic–racial relations in these geographical regions can lead to differences in how issues of race and ethnicity are addressed and how individuals perceive their ethnic–racial group membership. This variability informs social-level cultural processes discussed previously. As a result of this considerable variability, programs such as the Identity Project may be received differently based on the intersection of an individual's ethnic–racial group membership and the sociohistorical context of his or her group in the particular geographical region in which he or she lives. Thus, future efficacy testing will need to empirically examine this variability and how it may inform differential effectiveness of the program.
Multiple settings interacting to inform cultural development
Finally, Roth and Brooks-Gunn (Reference Roth and Brooks-Gunn2016) recommend that an important area for future research in the area of youth programming involves understanding how other contexts influence the effect of programs on adolescents, as there is limited work understanding interactive influences or reciprocal relations. Similarly, for the Identity Project intervention, another challenge will be understanding the role that other contexts can have on the ethnic–racial identity development process and, particularly, how they might interact with the current intervention. Two critical contexts for ethnic–racial identity development, beyond schools, are the family and peers. Both of these are developmentally salient, and both are proximal influences. For example, prior work has established that familial ethnic socialization plays a critical role in adolescents’ ethnic–racial identity development (Umaña-Taylor, Alfaro, Bámaca, & Guimond, Reference Umaña-Taylor, Alfaro, Bámaca and Guimond2009), and other work has noted that after-school programs that emphasized ethnic socialization among youth also had a positive effect on ethnic–racial identity development (Riggs, Bohnert, Guzman, & Davidson, Reference Riggs, Bohnert, Guzman and Davidson2010). Adolescents whose families do more to socialize them about their ethnic–racial background may benefit more from the Identity Project curriculum because they could be relatively more primed for the course material and they may have more resources outside of the school context, particularly with their family, to further engage with the curriculum. Thus, it will be important to understand how the efficacy of the Identity Project varies as a function of other experiences adolescents are having in these proximal contexts.
In sum, the multiple sociodemographic factors introduced above must be systematically examined in future efficacy testing of the Identity Project to best understand how to effectively promote ethnic–racial identity development among all youth. As noted by Bornstein (Reference Bornstein2017), “In the real world, interventions are applied to specific individuals and specific groups, rather than to abstract populations, and so to be effective they must be appropriate to specific people and specific goals as well as the specific social-cultural-ecological settings those specific people inhabit” (p. 27).
Conclusion
Positive ethnic–racial identity formation must be supported and facilitated, given its significant links to youth adaptation. An essential step toward supporting positive identity formation is to acknowledge and respect group differences (Markus et al., Reference Markus, Steele and Steele2000; Rivas-Drake & Umaña-Taylor, Reference Rivas-Drake and Umaña-Taylor2019). This is especially important in the current sociohistorical context in which youth are constantly exposed to instances in which people who are members of ethnic–racial minority groups are treated differently than those who are members of the ethnic–racial majority (e.g., Kaplan, Reference Kaplan2011; Rosenbloom & Way, Reference Rosenbloom and Way2004; Umaña-Taylor, Reference Umaña-Taylor2016b). As eloquently stated by Markus et al. (Reference Markus, Steele and Steele2000):
The key is to recognize that race and ethnicity are undeniable social realities that are constitutive of the person and that create differences among people. These differences are by no means essential or immutable; they change as the nature of the social situation changes. They matter, however, because people live their lives in these terms and require recognition of them, and because people respond to one another through the meanings associated with race and ethnicity. (Markus et al., Reference Markus, Steele and Steele2000, p. 251)
The Identity Project intervention provides one example of how we may intervene in young people's lives to ignite or mobilize a normative developmental process that will aid in young people's awareness and understanding of difference along the lines of race and ethnicity.
Sroufe (Reference Sroufe1990) explained that normal and abnormal development were mutually defining and that the field's understanding of nonnormative development was inextricably tied to our knowledge of normative development. Put differently, to understand normative development, one must understand deviations, yet deviations are only understood in the context of expected norms. García Coll et al. (Reference García Coll, Akerman and Cicchetti2000) made a similar assertion: “Within the discipline of developmental psychopathology, it often is the case that knowledge of psychopathology lags until gains in the understanding of normal developmental processes occur” (p. 351). Consistent with these ideas, I argue that understanding the developmental progression of ethnic–racial identity formation, and particularly the extent to which features of this process are modifiable through intervention, is a critical and necessary step toward understanding the role of culture in developmental psychopathology. As illustrated by the conceptual arguments and empirical findings summarized in the current paper, ethnic–racial identity development evolves as function of both biological and sociocultural influences. It is possible to intervene in adolescents’ ethnic–racial identity exploration and resolution, and such intervention can have cascading effects that promote positive development (i.e., grades, academic engagement, self-esteem, and positive orientations toward out-group members) and reductions in maladjustment (i.e., depressive symptoms). Although more research is needed to further examine the efficacy of the Identity Project and, specifically, examine its effectiveness by scaling up and testing important moderators of program effects, the findings to date suggest that this is a promising area in which to invest as we consider the role that culture plays in developmental psychopathology and how we might intervene to promote positive youth development.