I. INTRODUCTION
Slag is a general term used to describe the by-product of different pyrometallurgic processes of various ores (Piatak et al., Reference Piatak, Parsons and Seal2015). The slags focused on in this research project refer to steel and iron slags, which are coproducts of the steelmaking and ironmaking processes (World Steel Association, 2020, 1–2). Though restricted to these two metallurgy types, a vast amount of variability exists due to the different processes and material inputs used to produce steel and iron.
Iron and steel slags are known for their diverse, complex chemistries that are a product of the steel mill's high-pressure, high-temperature environment. These chemistries are specific to each furnace type, i.e., blast furnace (BF), basic oxygen furnace (BOF), electric arc furnace (EAF), and ladle furnace (LMF). Most milling operations reach temperatures at or above 1500 °C (ASTM D8021-20, 2021). The treatment of the slag post-steel or ironmaking also greatly affects chemistry, as different cooling methods (air-cooled, water-drenched, etc.) are used to achieve different particle sizes and properties. An example of such a treatment is the granulation of blast furnace slag for a predominantly amorphous, uniformly sized slag that is suitable as a cement additive (ASTM D8-22, 2022). In addition to the various thermodynamic processes slag undergoes, the chemical richness derived from different additives and fluxes must be considered. Though the major and minor elements that make up slag are considered common (Al, Ca, Fe, Si, Mg, Mn, C, O, H, K, Na, P, S, Cr), trace elements can range from fluorine to lead, which means the analyst must look at a wide range of different elements for minor and trace analysis. Further complications arise from the kinetic and thermodynamic environment of the mill, as polymorphs and solid solutions are common, demanding that the analyst must also look for shifts in the lattice parameters for major and minor phases to assure proper QPA (Jay and Andrews, Reference Jay and Andrews1946; Nishinohara et al., Reference Nishinohara, Kase, Maruoka, Hirai and Hiromi2015; ASTM D8-22, 2022).
Standardized regulation within the United States leaves many aspects of the steelmaking, ironmaking, and slag processing procedures flexible, as each company seeks to meet different goals and to make different products. Therefore, the chemistries, both elemental and mineralogical, differ in the type, quality, amount, and internal regulation of fluxes and additives from mill to mill, process to process. This flexibility, along with the thermodynamics and kinetics of a mill environment, makes analyzing slag for QPA extremely difficult.
When performing QPA on slags, problems are encountered at almost every step – from sample collection to sample prep, from data collection to data analysis. Foremost, sample collection and preparation are imperative to the success of any QPA, as errors acquired during sample preparation can extend throughout the whole analysis (Scarlett et al., Reference Scarlett, Madsen, Cranswick, Lwin, Groleau, Stephenson, Aylmore and Agron-Olshina2002). The inherent process of slag production allows for many errors in sampling if proper guidelines are not followed. Samples must be pulled from slag piles (ASTM D75/D75M-19, 2019), dried, split, and crushed (ASTM C702/C702M-18, 2018) appropriately according to ASTM guidelines. In addition, proper attrition using a micronizing mill with an appropriate grinding agent is necessary to obtain suitable particle size while avoiding as much degredation of the crystalline components as possible.
Data collection also creates complex issues. For example, some iron and steel slags are high in iron (20–60%), which is known to fluoresce in the presence of copper X-rays. This interference causes a significant increase in background across 2ϴ if not mitigated with the proper instrument configuration. A variable knife edge, Kβ filter, and fixed slits all help reduce errors associated with background (fluorescence, Bremsstrahlung, low-angle scatter). A monochromator or the use of different X-ray sources could also help streamline data collection, though are not used within the laboratory setting at Edw. C. Levy Co. In addition to background interferences, peak overlap is of extreme concern as slags typically contain more than 10 major and minor phases per sample on average, with some samples reaching 16–18. Therefore, having good counting statistics and mitigating any background interferences are imperative to the success of the refinement.
Even with minimal fluorescence or instrument contributions, background processing of slags remains complex due to the presence of amorphous phases – sometimes multiple per sample – in concentration ranges of 10–95 wt%. This variability, in combination with the wide range of crystallite sizes, makes background fitting extremely difficult. The analyst must be aware of any possible external or amorphous contributions for each sample to confirm that the background is fit appropriately.
In addition to the complexities of sample prep, data collection, and data reduction, many problems are encountered when performing phase identification and QPA via Rietveld or intelligent relative intensity ratio (RIR) refinements. As mentioned above, there are a high number of major and minor phases typical to each slag type (>10), some of which have shifts in the lattice parameters from dopants or vacancies. This, in addition to variability in solid solution chemistry, can make both identifying phases and refining the lattice parameters and scale factors in slags difficult. These chemical defects are thought to be a product of the chemical richness and variable thermodynamic and kinetic environments this material encounters during production.
Additionally, refining crystallite sizes for trace phases, semi-crystalline phases, and small crystallites like iron oxides such as wustite or magnetite, often leads to an over-broadening effect that causes these phases to interact with nearby unfulfilled peaks and background. The refinement software over-broadens the peak width for these phases, bolstering areas that lack intensity indiscriminate of the feature for which it compensates (amorphous intensity, unfulfilled peaks, incorrect background selection leading to an area lacking intensity, etc.). This compensation effectively leads to unrealistically low agreement factors (R), goodness of fits (R/E), and smoother difference plots, though errors in the comparison of the Rietveld refinements to elemental data like XRF would be appreciable.
To further complicate things, some slag types also contain phases like gypsum and wollastonite, which are minerals with known needle-like structures that tend to orient. Therefore, depending on the type of slag, preferred orientation is common, and if the orientation cannot be fully removed during sample prep, the proper modeling function (March–Dollase, spherical harmonics) must be applied to compensate for orientation effects (Sitepu et al., Reference Sitepu, O'Connor and Li2005, 159–60). Note that there is often a trade-off between sufficient grinding to reduce particle size and orientation, and degradation of the sample.
All these issues related to the proper QPA of slags compound, forming a large quantity of potential variables that could lead to an unrealistic refinement. As mentioned in Fawcett et al. (Reference Fawcett, Blanton, Kabekkodu, Blanton, Lyza and Broton2022), “A difficulty of QPA by Rietveld analysis is the large number of potential variables that can be refined using 12 structures, multiple supercells, polymorphs, and variable doping at atomic sites.” Like in cements, having a large group of phases in a material, and therefore having more refinable parameters, could lead to an unrealistically better fit during Rietveld refinement. The analyst must be cautious to avoid impractical refinements and ensure that there is enough information in the data to support their analysis (Peterson et al., Reference Peterson, Ray and Hunter2006, 16).
Edw. C Levy Co. collaborated with Tim Fawcett and the International Centre for Diffraction Data (ICDD) to find solutions to the aforementioned issues with the goal to better elucidate potential complexities during QPA of slags. The objective of this research is to determine proper sample preparation, data collection parameters, and Rietveld refinement techniques to obtain acceptable QPA results that could be obtained routinely (Walenta and Füllmann, Reference Walenta and Füllmann2004). The aim is to develop a thorough protocol that non-experts could apply to analyze slag mineralogy in a conventional laboratory setting.
II. EXPERIMENTAL
A. Samples
In steel and iron making two main mill types exist, integrated mills and mini-mills. Integrated mills are capable of producing both iron and steel through the use of a blast furnace (BF) and basic oxygen furnace (BOF), respectively. Typically, they are larger facilities with a higher output capacity (26.3 tonnes/y) (CRS Report, 2021; USGS, 2021). The process consists of the combination of coke and iron ores fluxed in a BF at a temperature above 3000 °F to create pig iron, which is then removed and reduced into steel in a BOF (AIST, 2022). Coke remains the major fuel and reducing agent used in integrated mills, which results in higher carbon dioxide emissions, making integrated mills more environmentally costly (Pellegrino, Reference Pellegrino2000). Mini-mills are typically smaller facilities consisting of an electric arc furnace (EAF) and have a yearly output capacity of about 61.5 tonnes/y (CRS Report, 2021; USGS, 2021). EAFs use an electric arc to charge the furnace instead of the array of energy sources, like coke, used in integrated mills. Though the metallurgy processes are different, mini-mills reach similar temperatures and pressures as integrated mills. EAF mills rely on recycled steel scrap as a main source of input, with high iron slag and metallic slag also used as a supplementary recycled material. In addition to the lessened environmental costs of mini-mills, they are also easier to start and stop on a regular basis, making them more economically desirable as their use can be shifted as the marketplace needs change (McGannon, Reference McGannon1971). Mini-mills now yield the majority of the steel produced in the United States, at around 70% of total production as reported by the U.S. Geological Survey (2021).
In addition, both integrated and mini-mills employ ladle metallurgical furnaces (LMF), which are specialty furnaces used to further refine steel chemistry after initial melting, and typically reach similar temperatures and pressures as EAFs, BFs, and BOFs.
This research project takes an in-depth look at five different slag types: EAF, BOF, ACBF (air-cooled blast furnace slag), AWBFS (alternatively watered blast furnace slag), and LMF. Two other main slag types, SSS (stainless steel slag) and PT (Plant Tuff™ slag blend – BOF and ACBF), are also commonly tested at Edw. C. Levy Co, but thorough analysis of these two slags will be reserved for future work. Each slag type has a different chemistry and mineral makeup, which is further explained in Table I. These samples were characterized using XRD, XRF, and ICP-OES at Levy Technical Laboratories, a division of Edw. C. Levy Co. Some samples within this data set were also run and analyzed at the ICDD. Table II highlights the number of samples for each slag type analyzed for this research project, as well as the laboratory that collected those data sets.
The chemistries of the five slag types analyzed in this research project.

Elemental data was collected for major elements via XRF, minor elements via ICP-OES and carbon/sulfur analyzer.
a The LMF samples analyzed in this research come from the alumina killed process in the ladle, as opposed to silica killed processes in the ladle furnace, where siliceous minerals dominate.
Sample group size for each individual slag type analyzed in this research project broken down by the location of data collection.

B. Data collection
Powder X-ray diffraction data were collected at two different laboratories using two different laboratory benchtop diffractometers and analyzed by three different analysts. Both laboratories worked independently to determine the best data collection method for their diffractometer.
At Levy Technical Laboratories, a McCrone micronizing mill equipped with corundum grinding agents was used to prepare specimens. Most samples were ground for 5 min unless otherwise noted (i.e., grinding time for samples containing phases with known needle-like structures). An internal standard of zinc oxide (CAS 1314-13-2) was used at 8.0 wt% and incorporated using an agate mortar and pestle. Samples were then prepared for analysis using either a 2-mm indent sample holder, or a Si-low background holder with a 1 mm sample well. A Rigaku MiniFlex 6G Benchtop X-ray diffractometer equipped with a Cu X-ray tube (Kα 1 = 1.540593, Kα 2 = 1.54414) was used to collect X-ray diffraction patterns. Measurements were taken at 40 kV and 15 mA with an instrument radius of 150 mm, a step size of 0.01°, and from 3 to 90° 2ϴ for 1–5 h. A typical Bragg-Brentano geometry with a 5° incident soller slit and 1.25° divergence slit were used as incident optics. Receiving optics consisted of an 8 mm scattering slit, a 5° receiving soller slit, and a 0.3 mm receiving slit. This diffractometer was also equipped with a Kβ filter to compensate for fluorescence interference, and a variable knife edge to reduce scattering at low angles. A D/teX Ultra 0D/1D high-speed silicon strip detector was used in the 1D, linear detector mode (12.8 mm × 20 mm active area, 106 cps pixel count rate). Rigaku's MiniFlex employs a variable + fix slit model that remains variable until 10° 2ϴ, where the instrument's configuration switches to fixed slits.
At the ICDD, data were collected on a Bruker D-2 benchtop diffractometer equipped with a LYNX-EYE strip detector. Scans were taken on samples both previously prepared at Levy Technical Laboratories, as well as prepared at the ICDD. Both sample sets were finely ground powders (less than 10 micron). Samples were mounted into either a zero-background holder or side-loaded holder. Data were collected with a 0.02 step size, a 0.6° incident slit with 3 s steps for a total time of 2.7 h from 0 to 65° 2ϴ. Measurements were taken at 30 kV and 10 mA.
The authors noticed that data collected by using either diffractometer produced similar signal-to-noise ratios and peak width resolution, though background contributions were more easily fitted with the ICDD's Bruker D-2. This difference was attributed to better sample loading technique as well as its fixed-slit set-up. From the extensive efforts, it was determined that crystallite size was the foremost contribution to peak width for most phases. Although peak resolution could be improved with different X-ray sources, it was important to obtain data representative to the laboratory setting for reproducibility within industrial settings. It should be noted that for most data sets run at 1 h, phases at a concentration of 1% and higher were usually above the noise level. Longer scans increased trace peaks minutely.
C. Quantitative phase analyses and data analyses
At Edw. C. Levy Co, data processing consisted of the following actions. In SIeve+, background corrections were performed by hand due to the highly variable amorphous profiles found in slags. In JADE Pro, background selection began with a BG-variable spline curve starting with 7–8 points, with manual adjustments made when needed. Peak selection was performed by a combination of second derivative peak selection and supplementary peak additions for some minor and trace peaks by hand when appropriate. Kα 2 peaks were stripped in SIeve+. JADE Pro automatically filters out Kα 2 contributions unless the “Kα 2 screening” function is manually turned off, therefore all samples analyzed in JADE Pro were stripped of Kα 2 peaks.
Data processing at ICDD consisted of automated background correction, α 2 stripping and second derivative peak selection with periodic manual intervention. Due to the high incidence and variable concentration of amorphous content, the background was always visually assessed and adjustments made if required. The adjustment typically increased the curvature of the background fitting in high amorphous content samples prior to QPA. For most data sets, >95% of the peaks and all high intensity peaks were identified automatically using a second derivative peak finding method. The manual adjustment consisted of changing the intensity threshold for peak finding and manual addition of peaks upon visual inspection. This usually consisted of identifying shoulders and weak peaks above the background, typically not found in an automated process. Due to the overlap issues, peak shoulders and peak asymmetry were very common.
Sample displacement was present in most samples, therefore data used in this research were normalized to the zinc oxide internal standard using PDF 04-003-2106 (Gates-Rector and Blanton, Reference Gates-Rector and Blanton2019). Phase identification was performed using the search/match functions of both SIeve+ and JADE Pro. A list of 44 XRPD reference patterns were used for phase identification for most samples. When unapplicable due to variable chemistry, other general searches based on chemistry, subgroup, unit cell, or d-spacing were employed. Generally, the phases with the best GOM/FOM and similarity index were used in this project.
The authors referred to a previous study done by Fawcett et al. that used three different whole pattern methods and two different types of analysis to determine the QPAs of cements and applied part of that approach to this work. As stated by Fawcett et al., “For various reasons described … totally automated methods produced unsatisfactory results. Based on the automated results and an analysis of the methods, including a review of prior published Rietveld refinements, a modified Rietveld method was developed with some parameter restraints and block refinement. In both the RIR and Rietveld methods, it was necessary to closely examine the pattern profile fitting and make adjustments when required, to obtain accurate results” (Fawcett et al., Reference Fawcett, Blanton, Kabekkodu, Blanton, Lyza and Broton2022). Because of the similar matrices of cement and slag, this approach was applied to this work.
The main refinement technique used in this research was the “Modified Rietveld” block refinement using JADE Pro (MDI, 2023), as it seemed to best handle the various crystallite sizes found in this material. Whole pattern RIR was performed in the SIeve+ module in PDF-4+ (Fawcett et al., Reference Fawcett, Kabekkodu, Blanton, Crowder and Blanton2015, Reference Fawcett, Gates-Rector, Gindhart, Rost, Kabekkodu, Blanton and Blanton2020, Reference Fawcett, Blanton, Kabekkodu, Blanton, Lyza and Broton2022) to validate the block refinement method. The full, automated Rietveld refinement option in JADE Pro was tested periodically during this project by T. Fawcett, which showed correct identification of phases >10 wt%, but false positives for most, if not all, remaining phases. These results, in conjunction with previous research from Fawcett et al. (Reference Fawcett, Blanton, Kabekkodu, Blanton, Lyza and Broton2022), determined that the full, automated Rietveld refinement in JADE Pro led to inaccurate results. These results are not a reflection of the software but the severe overlap, number of phases, and density of peaks in the pattern, which makes phase selection problematic, particularly when phases are at low concentration and fewer peaks are clearly observable. In fact for most of these samples, it can be shown that each observed peak has multiple phase contributions. This was the prime reason a preferred list of phases was developed, which was based upon statistical analyses of a group of samples.
Therefore, the automated refinement module was not used by the other authors of this paper for this project. Table III was taken from Best References for the QPA of Portland Cement, as it best summarizes the methods used in this study.
Table I from Best References: comparison of methods used in quantitative phase analysis (Fawcett et al., Reference Fawcett, Blanton, Kabekkodu, Blanton, Lyza and Broton2022).

All data sets collected at Edw. C. Levy Co were refined independently using the approach detailed in Table III. Supplementary refinements for most data sets were performed by co-authors T. Fawcett and S. Page. These analyses were used to confirm the success of both the methodology and results obtained by the author. Data sets collected at the ICDD were initially analyzed by T. Fawcett, with complementary analyses performed by J. Lyza at Edward C. Levy Co.
D. Validation methods
The elemental comparison between XRD and XRF/ICP-OES data was performed in order to validate the results obtained from the QPA of slags. This verification was completed in Excel by breaking down the elemental weight percent for all phases included in the refinement and summing each individual elemental component. The elemental data from XRF/ICP-OES was then normalized to the internal standard (8% ZnO for this research). To compare the two results, the elemental sum via XRD was divided by the XRF/ICP-OES elemental data and multiplied by 100. An ideal scenario for a sample that is 100% crystalline would be that all elemental sum comparisons between XRD and XRF equal 100%. However, in samples with variable amorphous content like slag, some of these elemental comparisons should be <100%, as some material resides in non-crystalline phases. For slag, those elementals usually include the following: Ca, Al, Si, Mg, Mn, O, and Fe.
Microscopy was also used to validate Rietveld refinement results. Images were collected using two different microscopes at two different laboratories. Edw. C. Levy Co employed a 3.5×–90× stereomicroscope with a total magnifying power of 1800×, equipped with an 80 LED compact ring light with dimmer and 10MP USB 2.0 color camera with reduction lens. The use of the camera inhibited total magnification with this stereomicroscope, however, as the camera sits in a different focal pathway than the ocular pieces and does not contain supplementary adaptions to account for the lost magnification.
Unless specified otherwise, images used in this research project were collected by T. Fawcett at the ICDD using a light microscope with incremental objectives of 4×, 6×, 40×, 60×, and 100×, and a magnifying camera at 10×, resulting in a total magnification range of 40×–1000×. Initial analysis occurs between 40 and 60× to determine bulk crystalline behavior. Images were collected at higher magnification, ranging between 400 and 600×. A 70 micron calibration dot was used to validate that 600× was the appropriate magnification power to analyze the particle sizes (1–100 μm) used for XRD analysis. Some images were taken at even higher magnification (1000×) with Type A microscope oil, which helped dispersed samples that tended to cluster, as well as changed the refractive index, allowing for clearer imaging of certain particles.
III. RESULTS AND DISCUSSION
A. Phase identification
1. AWBF slag
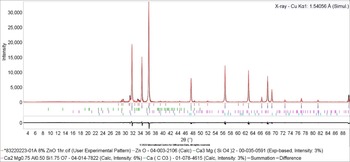
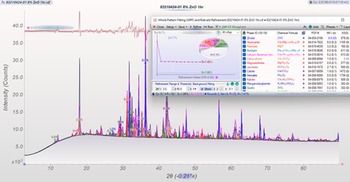
Phase identification of AWBF slag led to two common phases, merwinite and akermanite. Merwinite, PDF 04-011-6738, Ca3Mg(SiO4)2 (Gates-Rector and Blanton, Reference Gates-Rector and Blanton2019) and akermanite, PDF 04-014-7822, Ca2Mg0.75Al0.50Si1.75O7 (Gates-Rector and Blanton, Reference Gates-Rector and Blanton2019) are the preferred references used for AWBF slag. If total crystallinity was on the higher end (3–5 wt%), calcite and corundum were sometimes identified. Since ABWF slag is highly amorphous (>95 wt%), all phases are considered either minor or trace. Figure 1 illustrates all phases found in an AWBF slag sample using SIeve+'s phase identification module.
Phase identification of AWBFS sample 83220223-01A using SIeve+.

2. ACBF slag
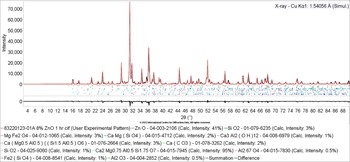
Performing phase identification for ACBF slag resulted in the identification of one major phase, akermanite. Figure 2 demonstrates a typical ACBF slag sample, with akermanite as the major phase, while also showing ZnO, SiO2, MgFe2O4, and other minor phases. Akermanite appeared consistently as the dominant phase, and the preferred reference used for this specific slag type was a Mg-doped polymorph from an akermanite/gehlenite solid-solution study with fractional site occupancies, Ca2Mg0.75Al0.50Si1.75O7, PDF 04-014-7822 (Gates-Rector and Blanton, Reference Gates-Rector and Blanton2019). This reference was the closest available match to the data, though both d-spacings and intensities of the collected data had slight variations from the reference.
Phase identification ACBF of sample 83220123-01A using SIeve+.

A combination of katoite, calcite, merwinite, larnite, and monticellite were all commonly identified as minor phases in different samples. Merwinite and monticellite are Mg-doped calcium silicates that were the predominant calcium silicates in samples with higher magnesium concentrations (>8.0 wt%). When within the average range for magnesium in ACBF slag (6–8 wt%), larnite was the preferred calcium silicate. Katoite is a calcium aluminum hydroxide that fit many unaccounted for peaks in this data set once a shift to higher 2ϴ was applied.
Quartz, mayenite, forsterite, krotite, and gypsum were common minor and trace phases found in ACBF slag. Other minor and trace phases were plausible but too variable to list due to the everchanging trace chemistry of slag. ACBF slags usually contained between 10 and 16 phases.
3. LMF slag
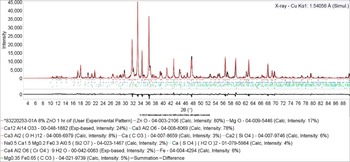
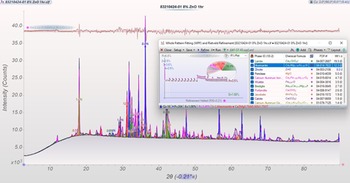
Analysis of LMF slag using QPA yielded three major phases: calcium aluminum oxide (C3A in cement notation), periclase, and mayenite. Calcium aluminum oxide, PDF 04-008-8069 (Gates-Rector and Blanton, Reference Gates-Rector and Blanton2019) acted as a supercell structure with Z = 24 for this material. Other common phases included katoite, larnite (C2S in cement notation), and calcite. Both calcium aluminum oxide and katoite had changes in chemistry that altered the unit cell parameters and thus shifted the diffraction lines to higher 2ϴ. Therefore, manual shifts were applied by the analyst. An illustration of these major phases in an LMF sample can be found in Figure 3.
Phase identification of LMF sample 83220253-01 using SIeve+.

Quartz, merwinite, gypsum, and dolomite were common minor or trace phases in LMF slag. Other minor and trace phases occurred with variability like in other slag types, though tended to show a slight preference for sulfur-containing phases like bassanite or anhydrite due to LMF's higher sulfur concentration.
Total phase count for LMF slag using laboratory data ranged between 10 and 15 phases. Specimen with a greater number of phases usually had a higher sulfur concentration, meaning more sulfate or sulfite phases occurred during the cooling process.
4. BOF slag
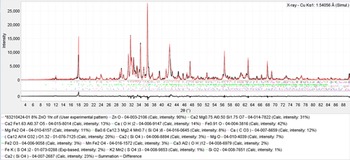
Phase identification of BOF slag resulted in nine common phases: larnite, srebrodolskite, wustite, magnetites (including jacobsite and magnesioferrite), periclase, mayenite, portlandite, akermanite, and calcite. The most concentrated phases varied from sample to sample, though phases typically included larnite, srebrodolskite, wustite, and akermanite. Figure 4 depicts the common phases found in a BOF sample using SIeve+'s phase identification module.
Phase identification BOF of sample 83210424-01 using SIeve+.

Many of these main phases had alternative chemistry from either solid solutions or variable doping. Srebrodolskite occurred as a solid solution with brownmillerite, usually dictated by the aluminum concentration, with a higher concentration favoring brownmillerite and a lower concentration favoring srebrodolskite. Magnetite and mayenite commonly appeared with shifted d-spacings in BOF slag, suggesting that variable doping occurred in both phases. Wustite was identified as having either fractional site occupancies, as with preferred reference Fe0.910O PDF 04-004-3816 (Gates-Rector and Blanton, Reference Gates-Rector and Blanton2019), or Mg-doping, Fe0.88Mg0.08O PDF 04-019-7808 (Gates-Rector and Blanton, Reference Gates-Rector and Blanton2019). If an appropriate reference for these phases could not be identified, angular shifts were applied to account for these unit cell defects.
Trace phases for BOF slag included katoite, quartz, lime, and yavapaiite. As with other slag types, variability is expected due to the mutable nature of slag chemistry. The number of phases for BOF slag ranged between 12 and 18 phases, with some exceptions at 19–21 phases. Most samples fell between 12 and 16 phases major and minor phases, with a few samples having 18–21 phases.
5. EAF slag
Research into the QPA of EAF slags was the most recent and most complex analysis attempted, therefore the following results should be viewed as preliminary and will not be accompanied by preferred phases.
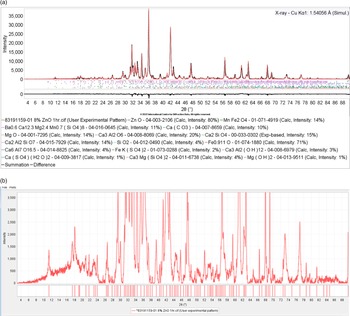
Though EAF slag has a similar number of common phases as BOF slag, phase identification of this material proved to be more complex. This complexity is thought to be tied to the inherent nature of the production processes for this slag type, as described in the introduction. Its nine common phases/phase groups, named such for the polymorphic variability that occurs between samples, had more irregularity than in other slag types, like BOF. An example of this issue resides with calcium silicate, which can be found as either larnite, calcio-olivine, merwinite, bredigite, or any combination of the above. Depending on the materials used, furnace process, and cooling process, different chemical compositions for calcium silicates can occur, meaning any of the aforementioned phases could be present under the proper conditions. Common phase groups for EAF slags were determined to be the following: calcium silicates, magnetites, gehlenites/akermanites, and srebrodolskites/brownmillerites. The other five common phases for EAF slags were wustite, periclase, calcite, quartz, calcium aluminum oxide (C3A), and mayenite. Figure 5(a) illustrates the SIeve+ phase identification of the major phases for EAF slag, while Figure 5(b) shows the combined complexities found in this material.
(a) Phase identification of EAF sample 83191159-01 using SIeve+. (b) Same pattern as shown in (a), but with the intensity scale expanded showing the large number of low intensity peaks, peak shoulders, and peak clusters which are typical in EAF samples. This also shows the variability in the baseline.

Just as with BOF slag, magnetite and mayenite were typically identified with a shift in d-spacing, suggesting that these phases had some sort of variable doping. Additionally, wustite also sometimes preferred fractional occupancy in the form of Fe0.910O. Merwinite also had its diffraction peaks shifted to higher 2ϴ, suggesting an altered unit cell due to chemical substitutions.
To further complicate QPA for this slag type, EAF steel mills use recycled materials and varying additives that lead to a wide range of different chemistries. Therefore, phases appeared extremely variable, though some trace and minor phases were identified commonly, such as gypsum, yavapaiite, hydrocalumite, and brucite. The presence of fluorite and/or cuspidine can be found depending on EAF slag source, as fluorite has been a common additive in EAF steelmaking for many years.
The total number of phases for EAF slag usually ranged between 14 and 20 phases depending on the type of recycled products and other additives used during the steelmaking process.
B. Data processing and background modeling
In SIeve+'s intelligent RIR module, best results were obtained with the background fit manually using the “Use Mouse to Create Background” function under data processing. For background modeling in JADE, the variable spline function was used, starting with 7–8 points and adding or editing points for a better fit. The background model must be tailored to each specimen due to changes in amorphous concentrations. For highly amorphous material like AWBF slag, the amorphous contribution must be carefully considered in order to avoid an ill-fitting background curve. During Rietveld whole pattern refinement in JADE Pro, the “Current BG-Curve Fixed” background option was used, which locks the modeled background selected during data processing in place for analysis.
If present, instrument and sample holder contributions were also corrected during this step. Low-angle scattering and fluorescence contributions were determined and corrected for if present using previously collected instrument/sample holder blanks.
C. Rietveld refinement
1. AWBF slag
Refinement of AWBF slag was the least complex of all slag types. Since there were only four phases per sample, the number of refinable parameters remained feasible. Most errors occurred in the background selection, which if modeled improperly, led to errors in both the crystalline phases and the amorphous contributions. Proper background modeling was essential in order to prevent the convolution of peaks with the amorphous content. Lattice constants and scale factors were refined for all phases. Temperature factors and crystallite size parameters were not refined, the latter because of potential interference with the amorphous components.
As mentioned previously, this material was highly amorphous, >95 wt%, with the amorphous concentration typically falling between 96 and 99 wt%. Usually, there were no more than four phases present, though sometimes cooling issues occured, which increased crystallinity, and therefore the number of phases. This issue was rare and easily noticeable.
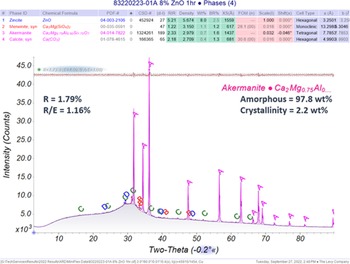
The agreement factor, R, for AWBF slag fell between 1 and 2.5, with the goodness of fit value, R/E, falling between 0.5 and 2. These refinements were considered successful, as the R value was consistently less than 6, and the R/E value often <2 (MDI, 2023). In addition, the refinements were validated by difference plot and elemental breakdown comparisons using XRF data.
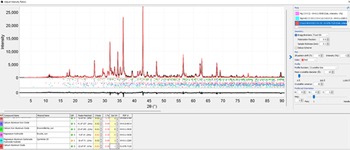
An example of an AWBF slag Rietveld whole pattern refinement can be found in Figure 6. This figure also depicts the refinement overlay and difference plot for validation.
A typical Rietveld whole pattern refinement report from JADE Pro for AWBF slag sample 83220223-01A. Labeled phases are as follows: (A) zincite, (B) merwinite, (C) akermanite, and (D) calcite.

2. ACBF and LMF slags
Rietveld refinement of ACBF and LMF slags were relatively straightforward, though some considerations must be made. Scale factors and lattice constants were refined for all phases initially, though some were deselected during refinement if the error associated with the parameter became too large (1% or ±0.05 Å for lattice constants). Those parameters were reset to the original values obtained from the PDF reference file and the refinement continued. JADE Pro's overall temperature factor function was refined for most phases in these samples. According to JADE Pro, the “overall temperature factor parameter unifies thermal vibration of all atoms in a phase” (MDI, 2023). Preferred orientation needed to be considered in LMF slag, specifically for gypsum. If texture was present, JADE's March–Dollase module was used to correct for the error. Potential validation of gypsum's needle-like structures can be seen using a stereomicroscope at 100× magnification if the concentration of gypsum is high enough. This validation technique was applied during this project, confirming the likelihood of preferred orientation for gypsum in samples analyzed for this research.
Since both slag types are relatively low in iron (FeXRF < 2 wt%), and most of the peaks in these specimens were highly crystalline, crystallite sizes for most phases in ACBF and LMF slag were refined. Some discretion must be used in areas of high peak overlap where some intensity remains unfulfilled from either amorphous contributions or variable chemistries with insufficient references. In these cases, JADE overcompensated the intensity of the known phases if the crystallite size parameters were refined. This issue occurred on a case-by-case basis.
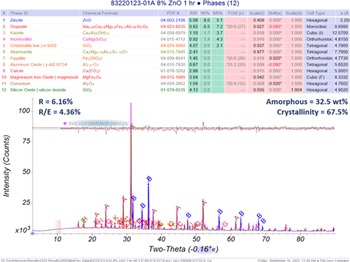
The amorphous content for ACBF slag ranged between 20 and 50 wt%, though most samples fall within 25–45 wt%. For LMF slags, the amorphous component had a concentration range of 20–50 wt%, with most samples falling between 20 and 45 wt%. The difference in amorphous content likely resulted from variability in the watering and cooling rates by location. The agreement factor, R, tended to fall between 4 and 7 for both slag types, with the goodness of fit value, R/E, falling between 2.0 and 5.0.
Higher R and R/E values, as seen in sample 83220123-01A in Figure 7, sometimes occurred, usually because of a combination of errors from heavy peak overlap in regions essential to the identification of major and minor phases and discrepancies between the major phases, akermanite for ACBF and calcium aluminum oxide for LMF, and their reference files due to variable doping. The largest residual intensities in the Rietveld refinement were often attributed to these major phases.
A typical Rietveld whole pattern refinement report from JADE Pro for ACBF slag sample 83220123-01A. Labeled phases are as follows: (A) akermanite, (B) zincite, (C) diopside, (D) calcite, (E) corundum-γ, (F) fayalite, (G) monticellite, (H) katoite, (I) quartz, (J) cristobalite, (K) corundum-α, and (L) magnesioferrite.

Furthermore, the analyst must remain vigilant to ensure that the refinement makes sense with the available information, since both these slag types have a high number of phases, and therefore a high number of refinable parameters, which could lead to an unrealistically low R value as previously suggested by Peterson et al. (Reference Peterson, Ray and Hunter2006). The conclusion of a successful refinement can be made when there is agreement between the R and R/E values, elemental comparison data, microscopy, refinement overlay, difference plot, and repetitious analyses, some of which can be seen in Figure 7.
Better results could be obtained with the collection of higher quality data. According to Fawcett et al. (Reference Fawcett, Blanton, Kabekkodu, Blanton, Lyza and Broton2022), “High resolution and/or synchrotron studies can enable the detection of very weak peaks that help with refinement of supercell structures and occupancy factors and also help resolve the overlap issues – enabling better models and whole pattern fitting for QPA. They also may help with the detection of minor phases and/or detection of polymorphic mixes that may not be observable in a 1 or 2 h laboratory scan.” Though not practical for industrial use, future studies using higher quality data could be beneficial in investigating the complexities mentioned above to further elucidate these issues for easier analysis in the industrial setting.
3. BOF and EAF slags
Rietveld refinement of BOF and EAF slags proved to be most difficult due to a more complex chemistry that resulted in not only more phases, but more intense peak overlap as well. Both BOF and EAF slag include iron oxides such as wustite, magnetite, magnesioferrite, and srebrodolskite, which tend to have small crystallite sizes. Crystallite sizes were determined using SIeve+'s crystallite size profile function and JADE Pro's Crystallite Size & Strain module, which employed a preveiously derived instrument profile curve calibratied with NIST 660c, lanthanum hexaboride. Small crystallite sizes needed to be monitored during refinement to ensure their intensities only contributed to their own peaks and were not over-broadening and contributing to one of the following: other phases, amorphous contributions, or unoccupied peaks. These peak width errors were found to be highly prevalent in iron oxides phases. Therefore, no crystallite size parameters were refined for iron oxides in this suggested protocol.
Lattice constants and scale factors were refined for all phases. If errors became too large (1% or ±0.05 Å for lattice constants), the parameters were deselected and reset to their reference values and the refinement continued. As with ACBF and LMF slag, temperature factors were refined for most phases. For BOF and EAF slags, those phases could include any combination of mayenite, magnetite, magnesioferrite, wustite, katoite, lime, periclase, and srebrodolskite. Temperature factors were closely monitored for errors and deselected if proven to be unreasonable. Preferred orientation needed to be considered in both slag types, specifically for gypsum, wustite, periclase, mayenite, portlandite, and akermanite. If texture was present, JADE's March–Dollase module was used to correct the error. As with ACBF and LMF slag, the presence of gypsum could potentially be validated using a stereoscope if enough needles were present.
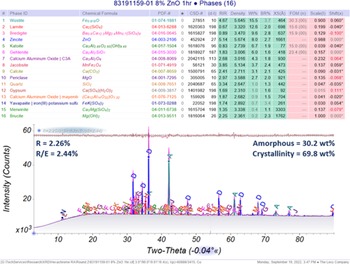
Amorphous content for BOF slags ranged from 15 to 55 wt%, though most samples fell within 20–45 wt%. For EAF slags, amorphous contributions ranged from 35 to 55 wt%, with most samples falling between 35 and 50 wt%. R values for EAF and BOF slag tended to fall between 1 and 5, with R/E falling between 1 and 4. Figure 8 shows an example Rietveld refinement for EAF slags.
A typical Rietveld whole pattern refinement report from JADE Pro for EAF sample 83191159-01. Labeled phases are as follows: (A) wustite, (B) larnite, (C) bredigite, (D) zincite, (E) katoite, (F) gehlenite, (G) calcium aluminum oxide, (H) jacobsite, (I) calcite, (J) periclase, (K) quartz, (L) gypsum, (M) mayenite, (N) yavapaiite, (O) merwinite, and (P) brucite.

Errors in R and R/E values occurred for several different reasons. First, the presence of altered unit cells due to vacancies and variable doping for many different phases common in these slag types led to higher errors in the lattice parameters and scale factors, which increased the overall error for the sample. Additionally, both slag types had a high number of phases and refinable parameters, which can lead to an unrealistically low R and R/E value. Like with ACBF and LMF slags, the analyst must ensure the refinement makes sense for the quality of data obtained. These QPAs were considered acceptable because of the relatively low R and R/E values and were validated using the difference plot, microscopy, elemental breakdown comparison using XRF data, and repetitious analyses.
Higher quality data could prove advantageous in investigating the complexities of BOF and EAF slags. Clarifying many of the issues relating to site occupancies, doping, and other shifts in d and intensity, as well as gathering higher quality data for confirmation of trace phases, would result in a more complete analysis and less error associated with QPA. Results from these studies could be used to help increase the ease of analysis in an industrial setting.
4. BOF example phase refinement
An example of the block-Rietveld refinement method used for this research is detailed below on BOF slag sample 83210424-01. Phase identification was performed using a custom subfile with selected phases identified as common and probable hits in high iron slags. Peaks that remained unfulfilled after the use of the subfile were identified using supplementary search/match methods. These methods included using broader subfiles such as the “Cement & Hydration Product” or “Mineral Related” subfiles in PDF-4+ or searching with elemental data and d-spacings.
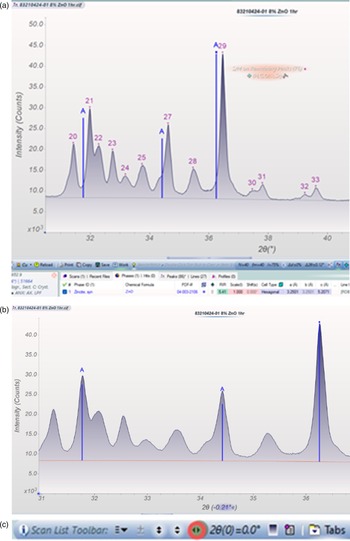
Once identified in SIeve+, the data for this sample was uploaded into JADE Pro and normalized to the internal standard, zincite, PDF 04-003-2106 (Gates-Rector and Blanton, Reference Gates-Rector and Blanton2019). The images in Figure 9 depict the data shift before (a) and after (b) normalization, as well as the toolbar and button (c) used to carry out this action.
(a) Addition of ZnO IS without normalization. (b) Data with ZnO IS normalization shift applied. (c) Button used for IS (Internal Standard) normalization.

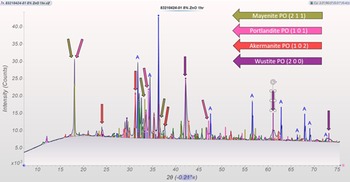
Reference files from the phase identification performed in SIeve+ were then loaded into JADE Pro. When entered, each phase was checked for the following: goodness of fit, shifts in d, and intensity scaling. All intensities were initially scaled to their I 100 peak, which highlighted four phases where the intensities did not match throughout the entire reference. Since these intensity issues were repetitious in BOF slags regardless of sampling location or product type, the suggested phases were identified as potentially having preferred orientation and checked later during analysis. During this time, the background was modeled using 7 spline points to simulate the variable-slit region from 0 to 10° 2ϴ, as seen in Figure 10.
Zoomed in view of phase identification for BOF slag sample 83210424-01, adjusted for intensity and shifts in d. Color coded arrows point to errors in intensity, hypothesized to be from preferred orientation in the suggested directions: mayenite (2 1 1), portlandite (1 0 1), akermanite (1 0 2), and wustite (2 0 0).

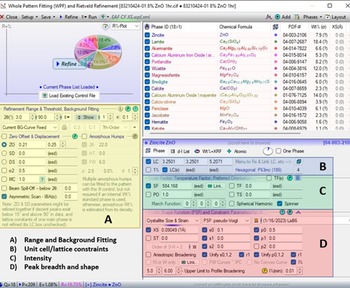
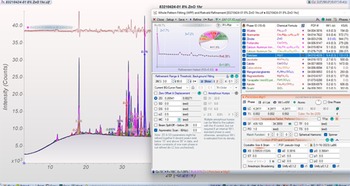
Next, whole pattern block-Rietveld refinement was implemented using the whole pattern fitting module. Fixing parameters began in section A of the refinement module, “Refinement Range & Threshold, Background Fitting”, as seen in Figure 11. Range of analysis was confirmed to be from 3 to 90° 2ϴ. “Current BG-Curve Fixed” option was used to fit the background, as it best handled the variable + fixed-slit set-up of the Rigaku MiniFlex. Zero offset (ZO) was determined earlier by the internal standard normalization shift applied at the beginning and was automatically filled in by the software.
Whote Pattern Fitting dialog box from JADE Pro for BOF slag sample 83210424-01. The box is sectioned off into the following sections: (A) range and background fitting in yellow, (B) unit cell/lattice constraints in blue, (C) intensity considerations like scale factors, temperature factors, and preferred orientation in green, and (D) peak breadth, profile shape functions, instrument functions in red.

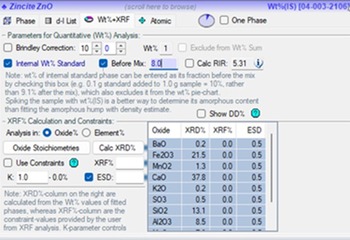
Before other parameters were adjusted, the internal standard, ZnO, was set to 8 wt% under “Wt%+XRF”, as seen Figure 12. “Before Mix” was selected so that all data obtained during the analysis would be normalized to the internal standard.
Internal standard dialog for BOF sample 83210424-01, set to 8.0 wt%.

After the internal standard was set, the block-Rietveld refinement was initiated by refining lattice constants and scale factors, while not refining crystallite sizes or any other parameters in section D, or temperature factors and preferred orientation in section C. The R value was 7.45 and R/E was 6.84, with visible issues with intensity for mayenite, akermanite, portlandite, wustite, and zincite as seen in Figure 13.

Before adjusting any other intensity-based parameters, crystallite sizes were refined for all phases >1 wt%, excluding iron oxides like wustite, magnesioferrite, jacobsite, hematite, and srebrodolskite, following the protocol of Fawcett et al. (Reference Fawcett, Blanton, Kabekkodu, Blanton, Lyza and Broton2022). s0 and p0 were also refined at this time, as s0 refined the peak shape to a typical pseudo-Voigt profile, and p0 refined the calibrated instrument parameters for the Rigaku MiniFlex from a previously developed instrument profile curve (IPC). The R value from the second refinement round was 6.35, and R/E was 5.83, with intensity issues still present for mayenite, portlandite, akermanite, zincite, and wustite. The peak breadth was carefully monitored to ensure realistic shape and size, particularly to avoid over-broadening. If the shape or crystallite size were deemed unreasonable, the value was reset to a value, typically between 0.1-0.3, depending on the peak width and deselected from refinement. A depiction of this refinement round can be found in Figure 14.
Results from the second refinement round for BOF slag sample 83210424-01.

The last parameters refined were temperature factors for non-iron oxide phases >1 wt%, and reset if found to be correlating with the full-width-half-maxima (FWHM) of the data (Pritula et al., Reference Pritula, Smrčok and Baumgartner2003). The summation plot matched the data well after this refinement round, excluding the textured mayenite peak at 18° 2ϴ, as highlighted by the smooth difference plot seen in Figure 15. Since there were no errors given by the software, and all peak shapes and crystallite sizes seemed appropriate, the refinement would be considered complete at this point, with a final R value of 3.50 and an R/E value of 3.21.
End results from block-Rietveld Refinement of BOF slag sample 83210424-01.

D. Elemental verification
Complimentary analytical data were collected on all samples described in this publication using a combination of the following: XRF, ICP-OES, and carbon-sulfur analyzer. Elemental results generally aligned with XRD QPAs in all cases. Generally was used since deviations were expected for major bulk elements such as Ca, Al, Si, Mg, Fe, Mn, and O due to variable doping, vacancies, and amorphous contributions, the latter of which caused non-insignificant digressions from elemental expectations.
However, even with deviations from amorphous contributions, results from elemental comparisons fell within predictable and expected trends for all elemental data types. This cross-verification ensured that major phase identification and minor (>1%) elements were validated for each slag type, and sometimes helped with the determination of trace phases.
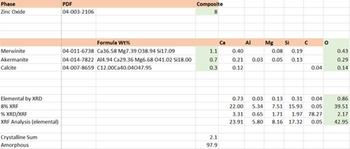
Figure 16 shows the complementary elemental comparison for EAF slag sample 83191228. Elemental data in wt% was calculated from the normalized XRD values, which can be found in the row titled “Elemental by XRD.” This data was compared to XRF data that had also been normalized to the weight percent of the internal standard used in this data set, found in the row titled “8% XRF.” This normalized elemental XRF value was compared to the normalized elemental XRD value in the row titled “% XRD/XRF” using Eq. (1) which can be seen in the equation below:
 $$\left[{\% {\left({\displaystyle{{{\rm XRD}} \over {{\rm XRF}}}} \right)}_A = \left({\displaystyle{{\sum A_{{\rm XRD}, \;N}} \over {A_{{\rm XRF}, \;N}}}} \right)\times 100} \right]$$
where A denotes the element of interest and N denotes values normalized to the internal standard, 8 wt% ZnO in this example. This equation was repeated for every element with available data.
This image depicts the elemental breakdown of phases and their comparison to other analytical elemental data from XRF or ICP-OES for AWBF slag sample 83220223-01A.

Good agreement was determined to occur when the percent comparison (%XRD/XRF) met the following criteria: the percent comparison was as close to 100% as possible without being over 100%, unless the element was a suspected contributor to the amorphous components, which led to a value less than 100%. A value greater than 100% usually suggested an error occurred during phase identification. However, sometimes achieving a value greater than 100% was unavoidable due to variations in solid solution chemistries and/or variable doping leading to difficulty finding an exact reference, therefore the best available reference was used. Values lower than 100% were common, especially in AWBF slag, and related to the amount and type of amorphous material present.
The significance and type of amorphous content was the biggest factor in determining the amount of elemental yield via XRD. SIeve+'s crystallite size modeling (Scardi et al., Reference Scardi, Leoni and Faber2006) was used to approximately identify the amorphous contribution, as seen in Figure 17. Mayenite, (Ca12Al14O32)O1.32, PDF 01-076-7125 (Gates-Rector and Blanton, Reference Gates-Rector and Blanton2019), with a crystallite size of 10 Å seemed best fit the amorphous contributions from 10 to 55° 2ϴ, which suggested that calcium, aluminum, and oxygen should all have comparison values less than 100%, which agrees with the elemental comparison for this sample as seen in Figure 16.
Amorphous contribution modeling in SIeve+ using the crystallite size profile function for EAF sample 83191228-01. A crystallite size of 10 Å for mayenite was used for this model.

E. Microscopy
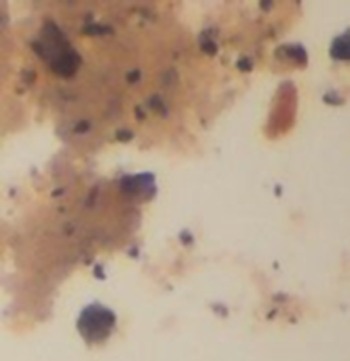
Microscopy proves to be a valuable tool in confirming particle characteristics in slags, which can help evaluate the results of attrition milling, look at particle asymmetry, examine crystalline morphology and color, and highlight how certain mill processes influence particle formation. The use of Type A microscope oil helped illuminate particle characteristics, as seen in Figure 19, where reflected light shows a red iron particle that would be missed if only transmitted light were used.
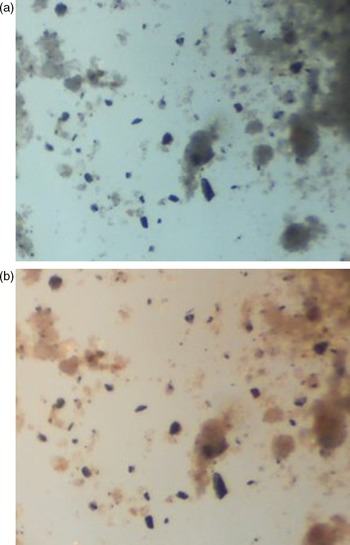
Microscopy can also highlight issues with particle uniformity, as seen in Figure 18, where there were a wide range of particle sizes even after 5 min of attrition milling. This image suggests that although a 5 min milling time is appropriate for most samples, some, like EAF slag, might need more milling due to the different densities and hardnesses of the phases found in that slag type. These particle size differences, especially large particles, can cause errors in analysis, such as preferred orientation and granularity (Figure 19).
(a) Microscopy image of EAF slag sample 83210294-03A using transmitted light at 20× magnification. (b) Microscopy image of EAF slag sample 83210294-03A using reflected light at 20× magnification.

Microscopy image of EAF slag sample 83210294-03A using reflected light, highlighting red particle at 20× magnification.

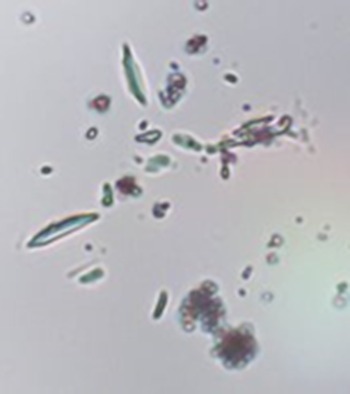
Confirmation of the presence of particles favorable for preferred orientation and granularity can be performed using this microscopic technique. For example, texture for phases such as wollastonite and gypsum were verified using benchtop microscopy. Figure 20 shows needle-like structures associated with gypsum in BOF slag sample 83210545-01, confirming the presence of preferred orientation for gypsum in this sample.
Microscope image of BOF sample 83210545-01 using transmitted light at 400×.

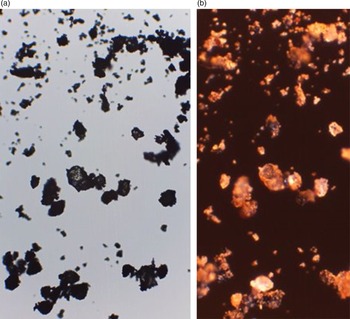
Microscopy can also be helpful in determining the influences of different mill processes, such as the effect that rapidly cooling slag has on the crystallinity of the material, i.e., the presence of amorphous material. Since light transmits through amorphous particles, making them appear somewhat translucent, a visual check under a microscope should validate the general amount (high or low) of amorphous material. As seen in Figure 21, there were particles that reflected light, appearing black and opaque, and others that transmitted light, appearing glassy and translucent.
(a) Microscopic images of rapidly cooled EAF sample 83200602-02 using transmitted light at 60× magnification. (b) Microscopic images of rapidly cooled EAF sample 83200602-02 using reflected light (right) at 60× magnification.

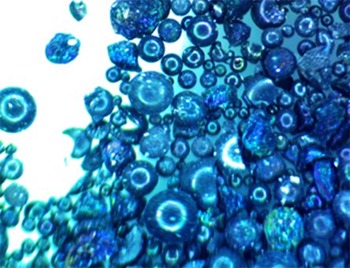
This rapidly cooled EAF sample, 83200602-02 had a high amorphous content >50 wt%, which can be seen in the number of translucent particles present in the microscopic images. Further validation appears in Figure 22, which shows 83200602-02 as received. Round, glassy spheres highlight how highly amorphous and granulated this material was.
Microscopy image of 83200602-02 as received (unprocessed) at 100× magnification using transmitted light. This image was taken at Edw. C. Levy Co.

All in all, benchtop microscopy is an essential aid in both determining and confirming particle characteristics for XRD in materials as complex as slags and should be used regularly as a check for common errors such as preferred orientation and granularity.
IV. CONCLUSION
The ease of performing QPA on slags depends not only on intrinsic refinement issues such as data quality or the convolution of peaks due to overlap, but also on the type of slag and the quality of supplementary chemical analysis available. QPA of low iron samples, such as ACBF, LMF, and AWBF, are the most straightforward, though these types are not without their complexities, like the variable doping in LMF's supercell calcium aluminum oxide. High iron slags (EAF and BOF) are more complex due to their more variable chemistry (peak overlap) and amorphous profiles.
Other conditions that are essential to perform a successful QPA analysis of slags are as follows: an instrument configuration tailored to mitigate air scatter and iron fluorescence, proper modeling of instrument and sample holder contributions, appropriate background fitting models, preferred XRD reference pattern lists to aid in phase identification, and the proper refinement of parameters via block refinement. Most refinements achieve good, repeatable R and R/E values that are supported by difference plots and elemental XRF comparisons.
The largest errors that lead to inaccurate results are contributed to severe peak overlap and solid solution effects on lattice parameters. Both issues can result in the manipulation of peak profiles. Severe peak overlap causes instability in the refinement, especially when there are many phases with a wide range of peak widths/crystallite sizes in the overlapped region. Special care is needed when refining crystallite sizes or temperature factors in these regions, as the summation plot tends to over-broaden and overcompensate for missing intensity and/or amorphous content. These errors in refinement are usually flagged by the software, though are sometimes missed. Therefore, it is incumbent on the analyst to closely examine the refinement to ensure these errors are not being overlooked.
Phases with shifts in lattice parameters like LMF's supercell calcium aluminum oxide, katoite, and mayenite could benefit from micro-XRF and/or TEM analysis. However, once the appropriate shifts are applied to the preferred references for these phases, a successful QPA can be performed. Finding these phases during phase identification is sometimes tedious, as they are often not statistically favored because of their shifted peak profiles. Changes in the unit cell can also manifest in lattice constant and scale factor errors. JADE Pro's software does a good job handling these issues or notifying the user when the error becomes too large. Determining appropriate references for these phases would greatly improve the ease of analysis for industry users.
Reliable QPAs for slags are achieved using the block refinement method laid out in Fawcett et al. (Reference Fawcett, Blanton, Kabekkodu, Blanton, Lyza and Broton2022), where restrictions on certain parameters, such as temperature factors and crystallite sizes can be manually refined. This approach led to the best refinement results of this laboratory data. Reproducibility of results has been shown between analysts, with results varying within a few percent, usually ±1–5 wt% for major and minor phases, and ±3–10 wt% for amorphous content. Though better analyses could be obtained with higher quality data, this study found laboratory data sufficient in identify and quantifying the major and minor phases in these slag types. This research could benefit from collecting higher quality data for future work that investigates the many instances of solid solutions, vacancies, and variable doping found in common slag phases, in addition to illuminating some of the common trace phases found in iron and steel slag.