


Introduction
Sea-ice thickness is an important climate variable. results of Submarine thickness measurements in the central arctic have indicated a large decrease of 43% between 1958 and 1976 and the 1990s (Reference Rothrock, Yu and MaykutRothrock and others, 1999). however, interpretation of those observations is hampered by the incomplete coverage of the arctic ocean. model results indicate that the observed thinning may be due to a redistribution of thick ice from the central arctic into the marginal Seas rather than to an overall thinning of arctic Sea ice (Reference Hilmer and LemkeHilmer and lemke, 2000; holloway and Sou, 2002). this redistribution is caused by interannual and decadal changes of the atmospheric circulation. with an increasingly cyclonic ice-drift regime in the 1990s and early 2000s, Strong thickness increases are computed for the area north of greenland and the canadian arctic archipelago. unfortunately, no recent thickness observations exist from that region. Since the beginning of Submarine operations in the arctic in 1957, only a Small number of operations have been performed in this region, and the results from these indicate the presence of the thickest Sea ice in the arctic ocean, with mean thickness of 6–7m (Reference WadhamsWadhams, 1990; Reference Bourke and McLarenBourke and mclaren, 1992). here we present results of airborne electromagnetic (em) thickness measurements performed north of alert, ellesmere island, canada, in may 2004 and 2005. these not only provide recent ice-thickness data for comparison with the earlier observations and models, in light of circulation changes in the arctic, but also Show Some interannual variability in the region.
Nares Strait, east of ellesmere island, is believed to be one of the main pathways of freshwater and ice export from the arctic ocean through the canadian arctic archipelago (Reference KwokKwok, 2005; Reference Münchow, Melling and FalknerMünchow and others, in press). thickness observations of first-year ice formed in the recurring lincoln polynya and of multi-year ice from the adjacent arctic ocean provide important constraints for estimates of the freshwater budget through that Strait.
Measurements
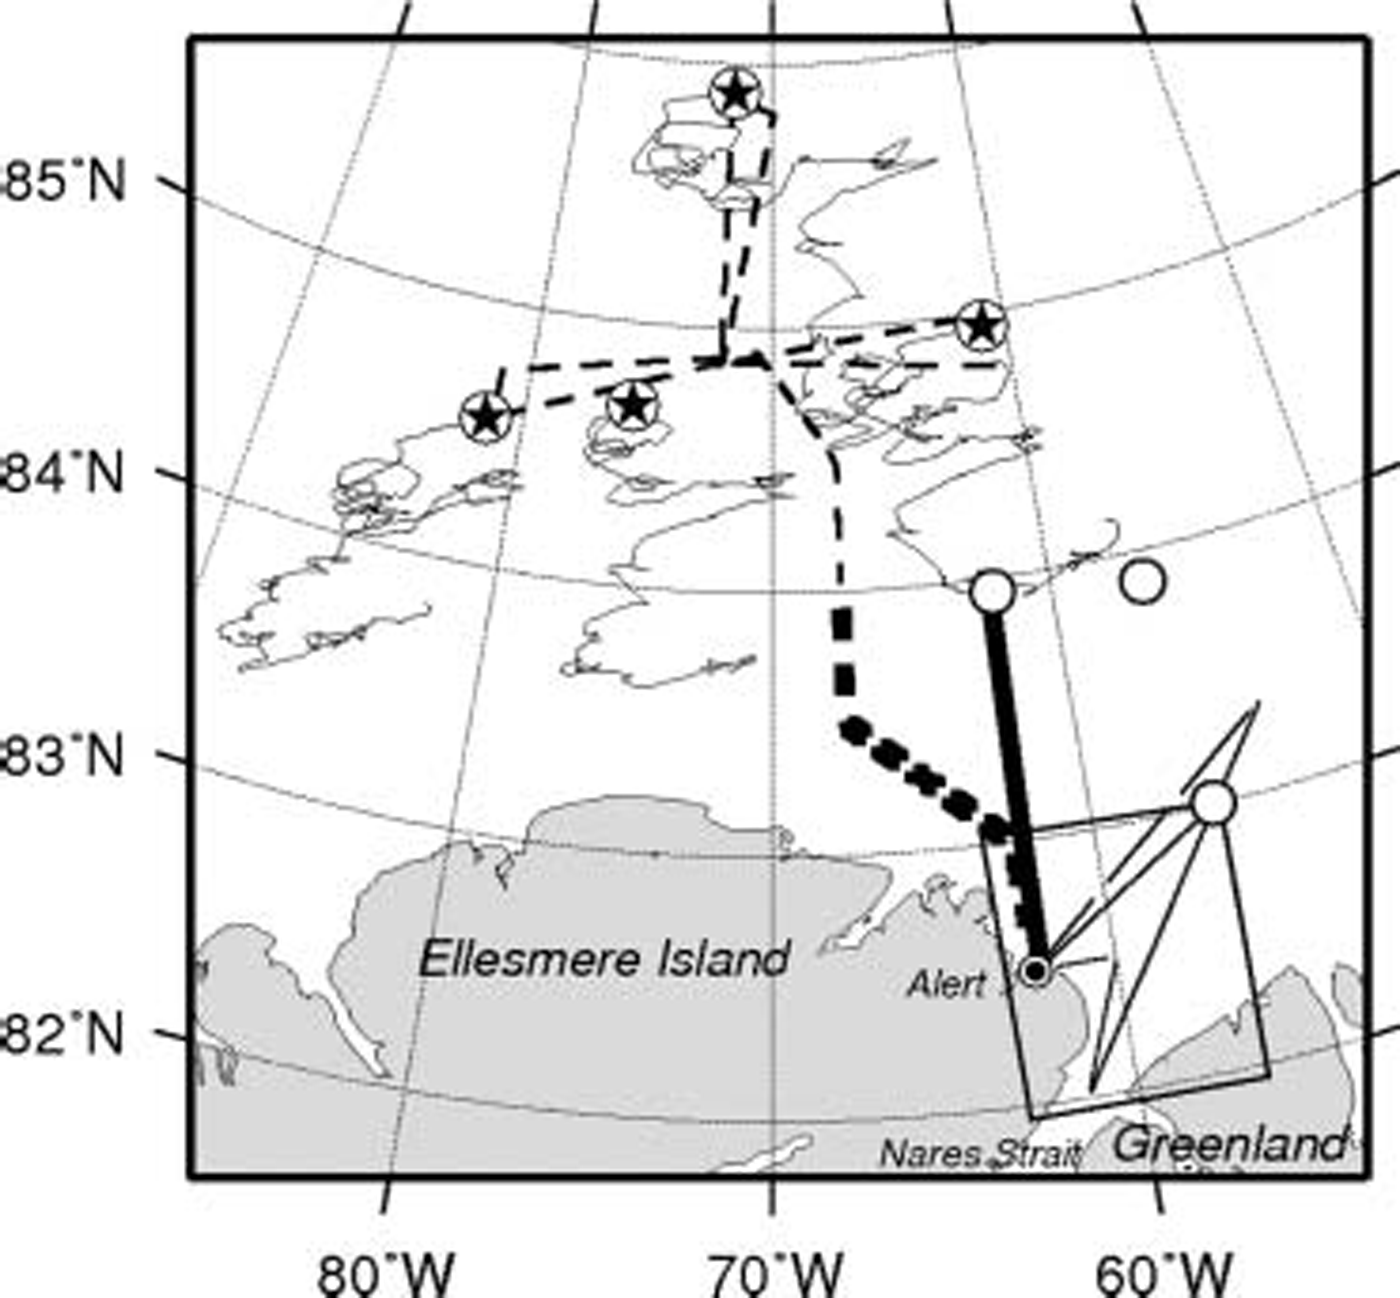
Helicopter-borne em (hem) thickness Surveys north and northeast of alert (Fig. 1) were performed on 12 and 13 may 2004, and between 6 and 14 may 2005. in 2004, a 400 km long meridional profile was obtained between alert and 86˚ n, using an ice camp at 85˚ n, 72˚w for refuel-ling. four east–west flights >100km long were also performed from that camp. in 2005, only alert could be used as a base, limiting the meridional profile to a length of 180 km, up to 84˚ n. the fast ice in nares Strait and the region of the refrozen lincoln polynya were additionally Surveyed in 2005. in 2004, ground-based em Sounding with a point Spacing of 5 m (see method described by Reference Haas, Gerland, Eicken and MillerHaas and others, 1997) was performed on four ice floes for validation of the airborne measurements. three 200m and one 1700m long Snow and total thickness profiles were obtained. the floes were located at the end and central points of the hem profiles. on every floe, measurements of Sea-water conductivity were performed using a hand-held conductivity meter. in addition, a drifting buoy was deployed on every floe to monitor ice dynamics between may 2004 and may 2005. the buoy positions were recorded every hour using the global positioning System (GPS) and transmitted via the iridium Satellite System. in 2005, Snow thickness was also measured with a ruler Stick on four floes representative of the first- and multi-year ice in the region.
Map of the Study region north of Ellesmere Island and in Nares Strait, Showing the location of HEM thickness profiles in May 2004 (dashed line) and 2005 (solid line), and the drift trajectories of four GPS buoys between May 2004 and May 2005 (thin lines). Stars mark buoy deployment and ground-based EM and Snow-thickness measurement Sites in 2004. Circles Show positions of Snow-thickness measurements in 2005. Data along the thick Sections of the 2004 and 2005 profiles are compared in Table 1 and Figure 5. Bottom right rectangle Shows coverage of SAR image in Figure 3.
The field measurements were complemented by the acquisition of Satellite Synthetic aperture radar (sar) imagery from the european Space agency (esa) envisat Satellite.
Airborne em profiling has been performed for >15 years to obtain extensive Sea-ice thickness information along the flight tracks of helicopters (Reference Kovacs and HolladayKovacs and holladay, 1990; Reference Prinsenberg and HolladayPrinsenberg and holladay, 1993) or fixed-wing aircraft (Reference MultalaMultala and others, 1996). an em System consists of an assembly of coils for the transmission and reception of low-frequency em fields, and a laser altimeter. the em components are Sensitive to the Sensor’s height above the conductive Sea-water Surface, while the Sensor’s altitude above the ice or Snow Surface is determined with the laser altimeter. over Sea ice, the water Surface coincides with the ice underside. therefore, the difference of the height measurements of both components corresponds to the total (ice plus Snow) thickness (Reference HaasHaas, 1998).
We used a Small, lightweight, helicopter-borne em bird, 3.5m long and weighing 100 kg. it was Suspended 20m below the helicopter and towed at heights of 10–20m above the ice Surface. the em bird operates at frequencies of 3.6 or 4.1 khz, with a coil Spacing of 2.7 m. Signal generation, reception and processing are fully digital, maximizing Signal-to-noise ratio. the em System is calibrated by means of internal calibration coils with a known response. em Sampling frequency is 10 hz, corresponding to a measurement point Spacing of approximately 3–4 m. measurements are interrupted every 15–20 min by ascents to high altitude, to monitor electrical System drift.
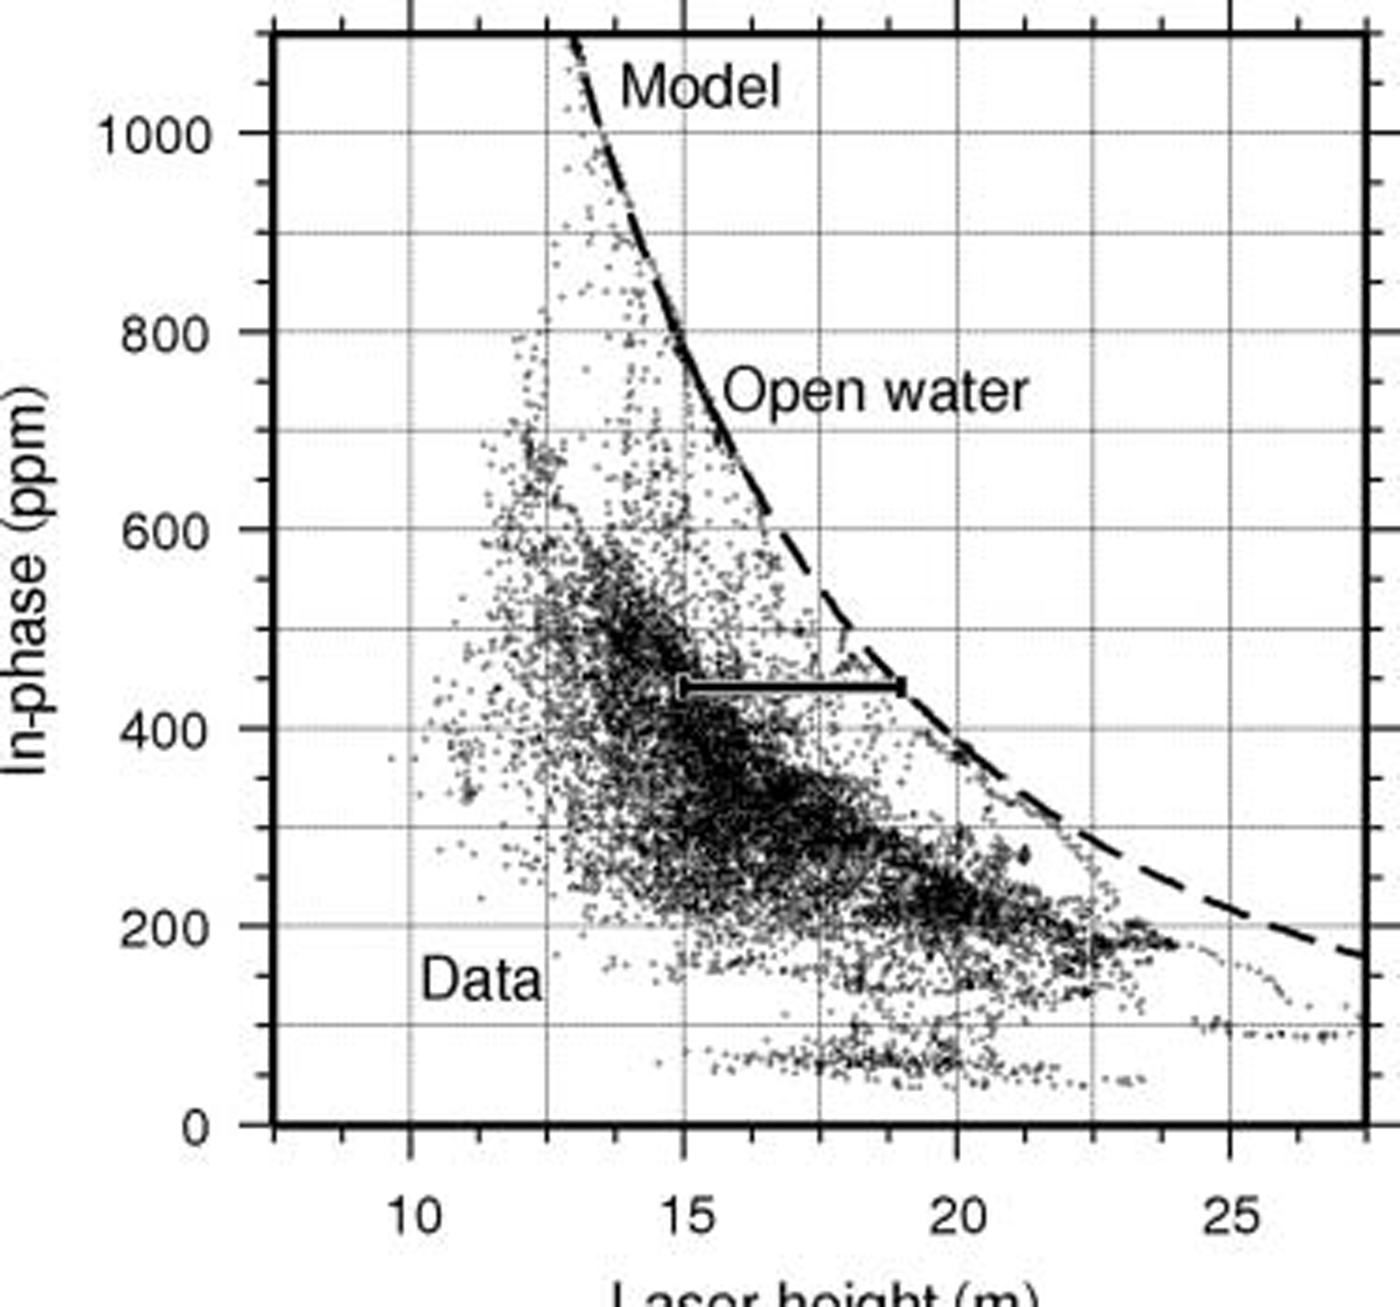
For the thickness computation, we used only data of the in-phase component of the complex em Signal, which is the Strongest and most Sensitive channel. Figure 2 Shows the relationship between bird height above the ice Surface and the measured and modelled em responses. the model results (Reference Ward and HohmannWard and hohmann, 1988) have been computed for open water (ice thickness 0m) with a Sea-water conductivity of 2400 msm–1 in 2004 and of 2500 msm–1 in 2005, representative of our in Situ measurements. the model curve provides the general means of computing the height of the bird above the water Surface or ice underside from a measurement of in-phase em field Strength at a certain height above the water (Reference HaasHaas, 1998). measurements at different heights are obtained because the altitude of the helicopter and bird vary between 10 and 25 m during the flight (Fig. 2). the data can be Separated into two branches: while open-water measurements at different bird heights agree well with the model curves, the presence of Sea ice leads to a reduction of the measured em Signal at a given laser height (Fig. 2). therefore the Scattered cloud of data points below the model curve represents measurements over ice. ice thickness is computed by Subtracting the laser height measurement over Sea ice from the model curve (Reference HaasHaas, 1998). it can also be visually estimated from the horizontal distance between each em measurement and the model curve (Fig. 2). the thickness computation assumes a negligible Sea-ice conductivity of <20msm–1, which is likely for the multi-year ice in the Study region (Reference Haas, Gerland, Eicken and MillerHaas and others, 1997).
Em field Strength (in-phase component of relative Secondary field Strength at 3.6 kHz) vs laser height measurement (13 May 2005; 83.4–84˚ N). A model curve and data over a typical ice Surface with Some leads are Shown. The model curve has been computed for a Sea-water conductivity of 2500 mSm–1. The horizontal bar illustrates how ice thickness (4 m) is obtained for a Single data point from the difference between laser measurement and the model curve for a given EM field Strength (see text).
Comparison with drillhole data Shows that the em-derived ice thicknesses agree well within ±0.1m over level ice. however, the accuracy is worse over ridges. because the low-frequency em field is diffusive, its Strength represents the average thickness of an area of 3.7 times the instrument’s altitude above the ice Surface (Reference A., Holladay and BergeronKovacs and others, 1995; Reference Reid, Pfaffling and VrbancichReid and others, 2006). due to this ‘footprint’ and the porous nature of ridge keels, the maximum ridge thickness can be underestimated by as much as 50% in the worst cases, depending on the geometry and consolidation of the keels (Reference Haas and JochmannHaas and jochmann, 2003).
Histograms of the ice-thickness profiles have been computed with a bin width of 0.1 m. modal thicknesses are defined as the thicknesses of Strong local maxima of those thickness distributions.
Results
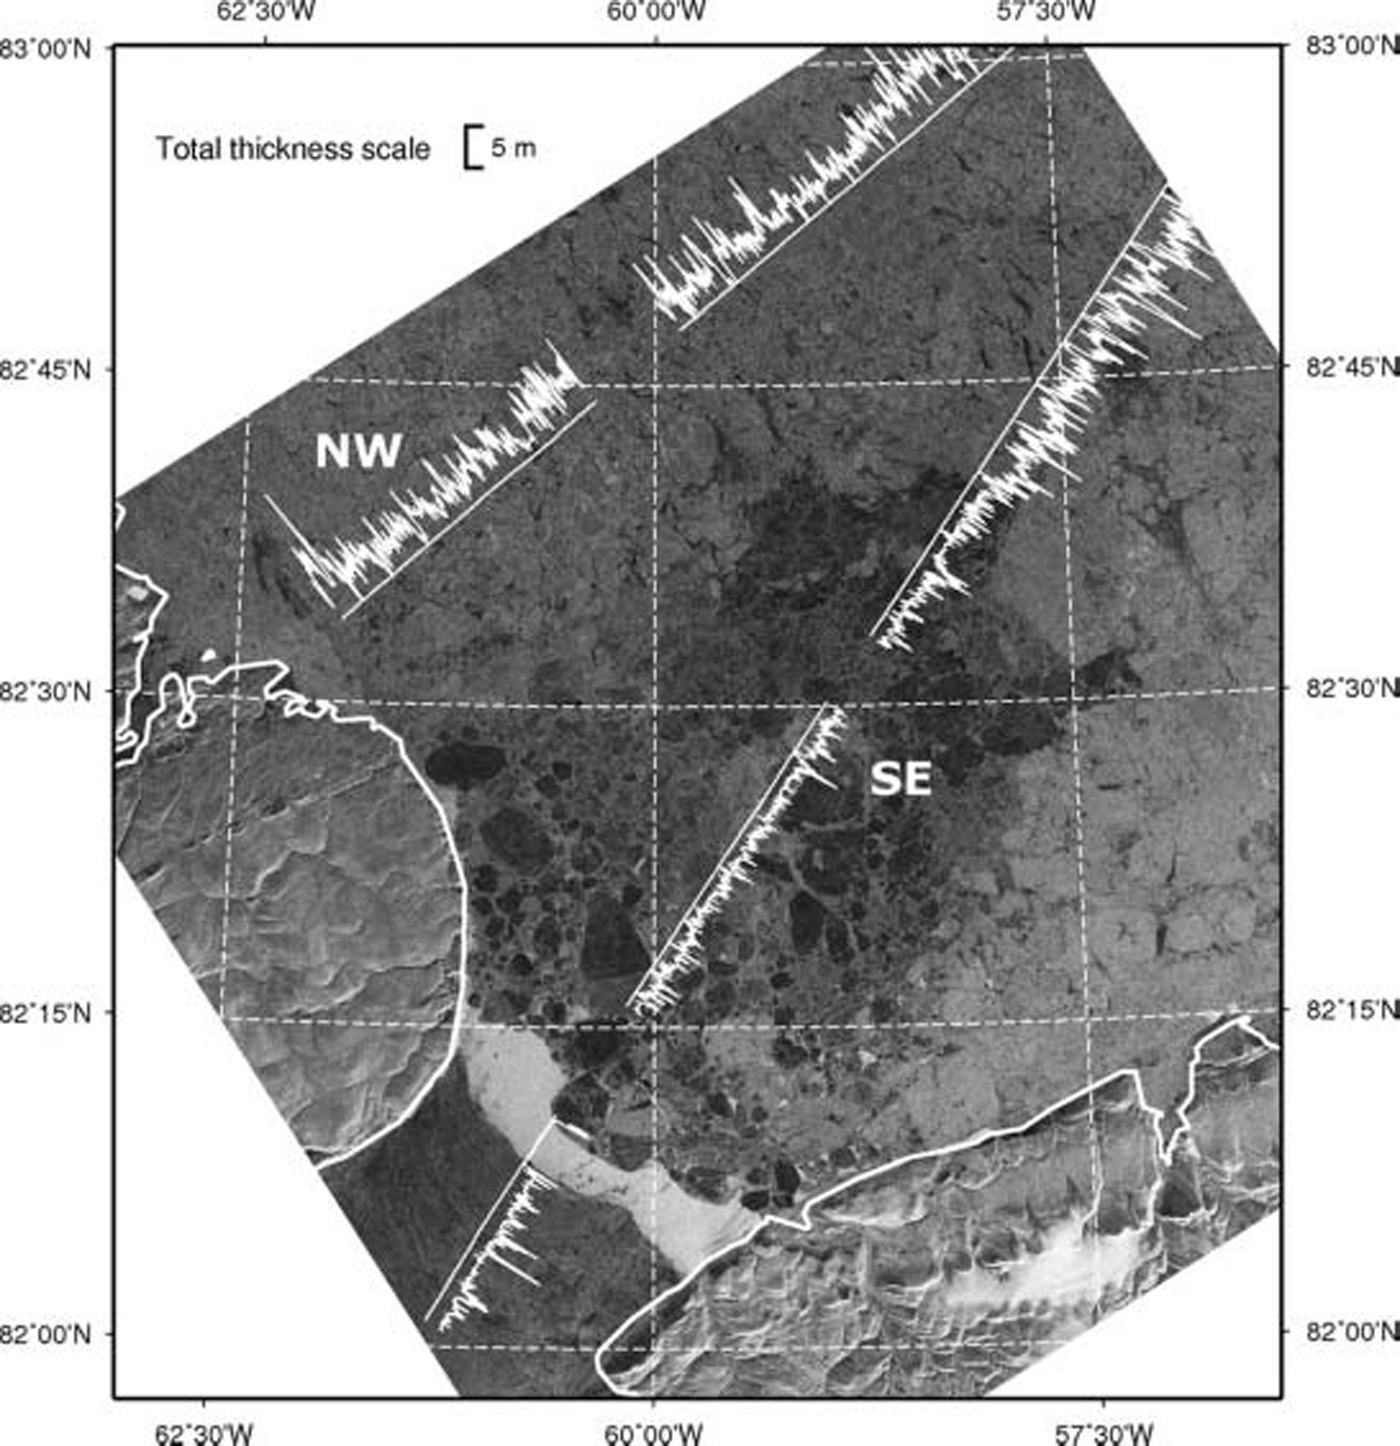
Figure 3 Shows the thickness profiles obtained on 14 may 2005 along the triangular easternmost flight track in Figure 1, Superimposed on a Sar image of the Same day representing typical ice conditions in 2005. in the north, the area is almost completely covered by multi-year ice with relatively high backscatter. in the lincoln Sea, there is a mixture of darker first-year and brighter multi-year floes. South of this, in front of the entrance to nares Strait, a large open polynya can be Seen with high backscatter, as the Surface was roughened by Strong Southerly winds. nares Strait is covered by dark first-year fast ice. it Should be noted that the Size of the open polynya was very variable in may 2005 and that the pack ice was very mobile, depending on the prevailing wind direction. in contrast, in 2004 no open water was observed at all South of 83.5˚ n, and Sar imagery revealed the presence of a large refrozen polynya covered by first-year ice, a typical Situation also for most other years (Reference KwokKwok, 2005). the thickness profiles in Figure 3 represent the different ice types and regimes very well. this is also Summarized by the thickness distributions Shown in Figure 4.
Sar Satellite image of the Lincoln Sea and Nares Strait (courtesy ESA) with Superimposed ice-thickness data along the easternmost, triangular flight tracks in Figure 1, both acquired on 14 May 2005, at 17:47UTC and between 18:17 and 21:02 UTC, respectively. NW and SE mark the northwestern and Southeastern profiles compared in Figure 4. The SAR image has been obtained by the ESA Envisat Satellite at HH polarization with a pixel resolution of 12.5 m (IMP product). Dark pixels correspond to low radar backscatter.
Sea-ice thickness distributions of the northwestern and Southeastern profiles across the Lincoln Sea on 14 May 2005 (shown in Fig. 3).

The presence of the open polynya is indicated by a Strong mode of the thickness distribution at 0m (Fig. 4). there is another mode at 1.9m in the Southeastern profile, representing older first-year ice formed Since autumn 2004 in the lincoln polynya and in nares Strait (Reference KwokKwok, 2005). this thickness is in good agreement with observations of fast-ice thickness at alert (Reference Brown and CotéBrown and coté, 1992). in the northwestern profile, the first-year ice is thicker, with a mode between 2 and 2.2 m. the thickest mode, however, results from the multi-year ice, with modal thicknesses of 3.9 and 4.0 m. this mode agrees very well in both the northwestern and Southeastern profiles.
Results of all thickness measurements in 2004 and of the South–north transect in 2005 are Summarized in Table 1 (cf. Fig. 1). with modal thicknesses between 3.3 and 5.0 m, the ice was very thick indeed (Reference WadhamsWadhams, 1990; Reference Bourke and McLarenBourke and mclaren, 1992). the mean thickness of all measurements including open water ranged between 4.06 and 5.42 m, thinner than the 6–7m given by Reference Bourke and McLarenBourke and mclaren (1992). however, it Should be noted that the mean is underestimated in our data because the maximum thickness of ridges is generally underestimated in em data (see above).
Modal and mean (±1 Standard deviation; including open water along the profiles) ice thickness and open-water fraction, f ow, of all measurements performed in 2004 and of the South–north transect in 2005. The meridional profiles represent ice between 62˚W and 72˚W in 2004 and along 62˚W in 2005 (Fig. 1). The zonal transect was obtained between 84.5˚N and 85˚N in 2004 (Fig. 1)

Open-water fraction was calculated from all measurements with an ice thickness <0.1 m, and was only a few percent, with the exception of the Southern profile Sections between 82.5˚n and 83˚n in 2005. however, the amount of open water was enough to confirm the calibration of the em bird, yielding a thickness of 0.0±0.1m over leads.
Table 1 also Shows that in 2004 there was a Small meridional thickness decrease between alert and 86˚ n, amounting to an ice thickness gradient of –0.21m(˚lat.)–1 for modal and –0.17 m(˚lat.)–1 for mean ice thickness.
The thickness distributions in Figure 5 compare the results of 2004 and 2005 along the meridional transects at 62˚w and 68˚w, between alert (82.5˚ n) and 84˚n (thick lines in Fig. 1). there was much less open water in 2004, as discussed above and Shown in Table 1. there is a clear mode of 1.6m in 2004, representing first-year ice in the refrozen lincoln polynya. in 2005, there is only a weak, but thinner, mode between 0.9 and 1.3 m resulting from young first-year ice, in agreement with the Sar image in Figure 3, which Showed a pronounced refrozen polynya only more towards the east. both thickness distributions are dominated by the modal thickness of multi-year ice. while this amounted to 3.9 m in 2004, it was 4.2 m in 2005, i.e. 0.3 m or 8% thicker. however, the mode is broader than in 2004, and the tail of the distribution also Shows a much higher fraction of thick, deformed ice in 2005. mean thickness was 4.67 ±2.24 m in 2004, and 5.18±2.49m in 2005 (i.e. 11% thicker), including 0.7% and 2.3% open water, respectively. in 2004, 80% of the ice was thicker than 3 m, representative of multi-year ice and Small fractions of deformed first-year ice, with a mean thickness of 5.27 m. in 2005, ice thicker than 3m represented 85% of all measurements, with a mean thickness of 5.73 m, i.e. 9% thicker than in 2004.
Sea-ice thickness distributions of the meridional profiles between Alert and 84˚N in 2004 and 2005 (thick lines in Fig. 1). The grey-shaded distribution Shows the results of the ground-based measurements in 2004 for comparison.
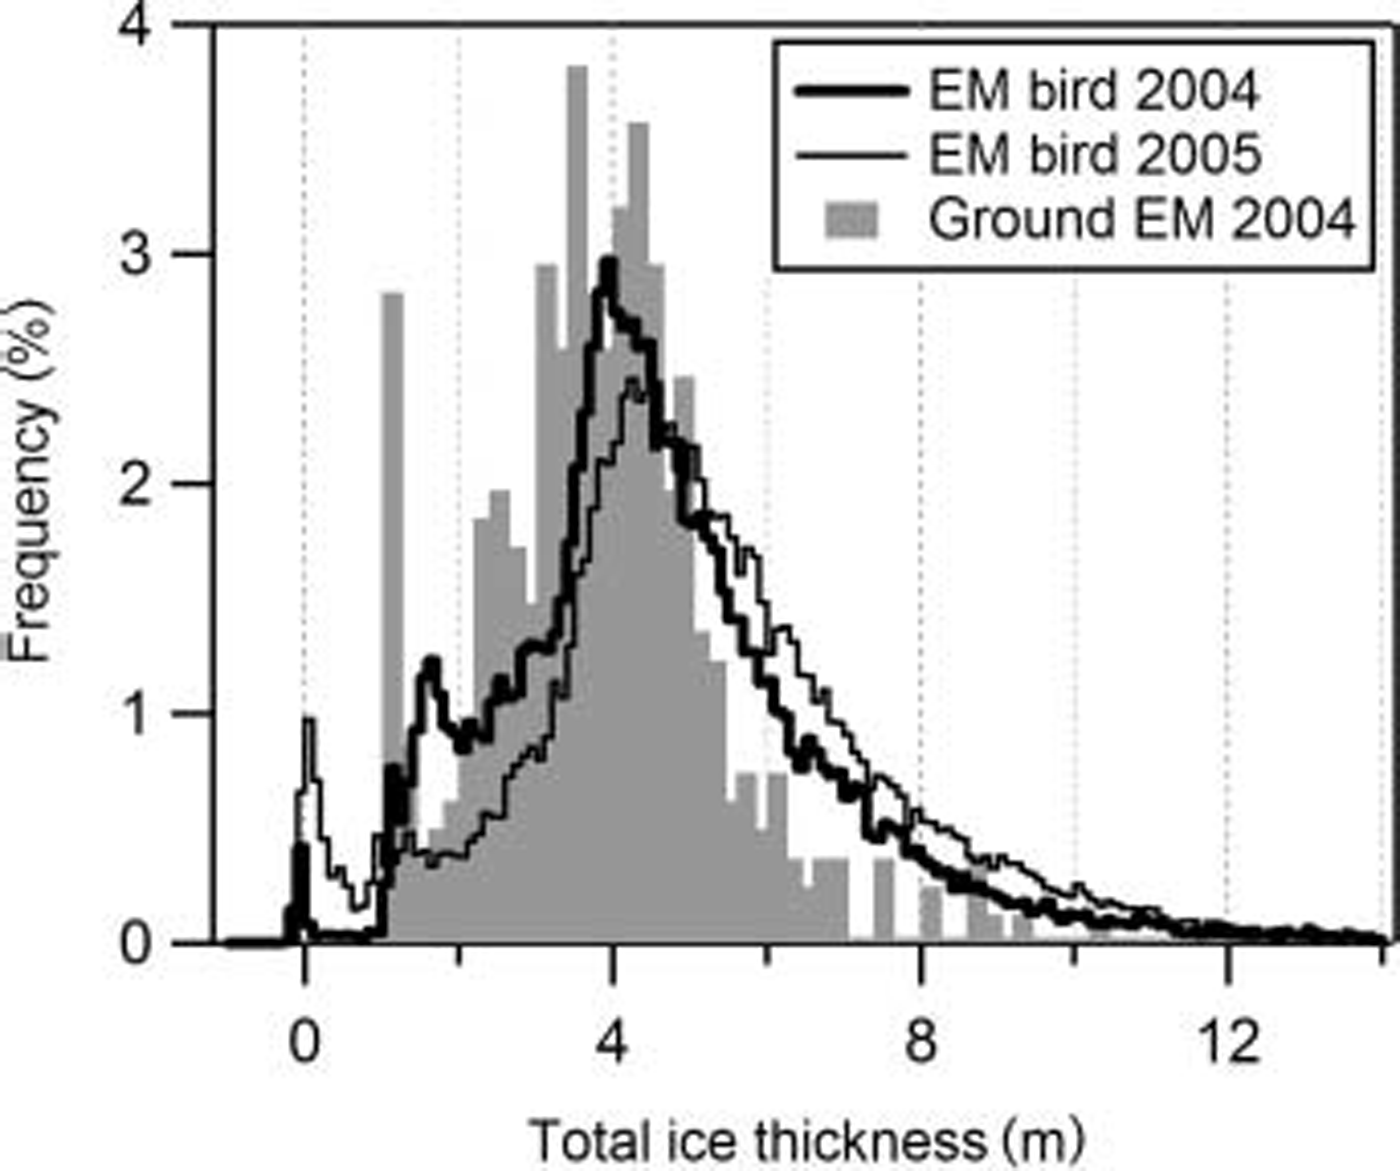
Figure 5 also includes the thickness distribution obtained from the ground-based measurements for comparison. while there is quite large Scatter in the details due to the limited, unrepresentative number of Samples of only 406 point measurements, in general there is good agreement between Some modes representative of certain widespread ice types and ages. in particular, the ground-based measurements are dominated by a large refrozen lead with a thickness of 1.0 m.
This was used as the runway of the ice camp. ice of the Same origin is also visible in the 2004 hem thickness distribution. the ground-based data also have Strong modes between thicknesses of 3.4 and 4.2 m, in good agreement with the main mode in the hem data of 3.9 m.
Modal and mean Snow thickness on multi-year ice amounted to 0.18 and 0.30±0.19m in 2004 (426 measurements on four floes). in 2005, the modal Snow thickness on multi-year ice was 0.28 m, with a mean of 0.35±0.16m (144 measurements on three floes). however, the number of measurements was too Small to yield Statistically reliable Snow thickness distributions, and therefore there were large Secondary modes at 0.40 m in 2004 and 0.16 and 0.42 m in 2005. a 50 m long Snow thickness profile on first-year fast ice in nares Strait had a mode of 0.16 m, with a mean of 0.13 ±0.07 m in 2005.
Between 22 may 2004 and 21 april 2005, the four buoys drifted South by 83 ±18km towards the coast of ellesmere island and nares Strait. although this would Suggest a compression of the ice pack, the area of the buoy array actually increased from 12 152km2 to 14207km2. the area increase was mainly due to an expansion towards the east, with the eastern buoy drifting 66 km eastwards while the western buoy only moved 5 km east. unfortunately the internal behaviour of the buoy array is less relevant for the interpretation of our thickness observations, as in 2005 only the region South of the array could be Surveyed. in the region of our 2005 measurements, the area between alert and a line formed by the three Southernmost buoys decreased by 26% (from 130 567 to 96 218 km2), and the distance between the easternmost buoy and alert decreased by 32% (from 262 to 179 km).
Discussion
Our observations reveal very thick ice, probably among the thickest ice in the arctic ocean, and Show Some interannual variability in the region. the buoy drift trajectories provide Strong evidence that the Same ice regimes have been Sampled between 62˚w and 68˚w in both years (Fig. 1). however, our interannual comparison refers to an eulerian reference frame in the region South of 84˚ n. we assume that there are no Significant zonal thickness gradients, as is Shown for the zonal transect in 2004 (Fig. 1; Table 1). under the Specific circulation regime between may 2004 and 2005 with Strongly to Slightly negative indices of the northern annular mode, mean ice thickness including open water increased by as much as 8%, and 9% for multi-year ice thicker than 3m. the modal thickness of multi-year ice increased by 11%. it Should be noted, however, that because our thickness estimates represent total thickness, Some of the observed variability at least of modal ice thickness could result from variable modal thicknesses of Snow. taking the main modal thickness of Snow into account, and assuming that it represents Snow on the multi-year ice, the modal thickness increase between 2004 and 2005 reduces to 0.2 m or 5%, from 3.72 m to 3.92 m. however, we assume that this is Still well above the accuracy of our ice-thickness measurements.
While the observed thickening was generally <10%, a rough calculation of the buoy motion Showed that the area between the buoys and alert decreased by 26%, while the distance between the closest buoy and alert decreased by 32%. this Suggests a mass-balance disagreement between the actual compression of the ice pack and the observed thickness increase. this disagreement is due to two factors. firstly, nares Strait is one of the main ice-drainage paths for ice exported from the arctic ocean through the canadian arctic archipelago. Secondly, there is probably also Some Strong Shear along the coast of ellesmere island, which is not resolved by our four buoys. with this Shear, much ice will also be exported westward or eastward, as Suggested by Several periods in the buoy trajectories (e.g. at the very end; Fig. 1).
We have Shown that first-year modal ice thickness in the lincoln Sea amounts to 0.9–1.6 m. Salt released during this ice formation will impact the ocean Salinity in the region, and has to be taken into account with investigations of the fresh-water balance in nares Strait (Reference Münchow, Melling and FalknerMünchow and others, in press).
While deformation would account for an increase in mean ice thickness and deformed ice fraction, as can also be Seen in the 2005 thickness distribution (Fig. 5), it cannot easily explain the increase in modal thickness of 0.2–0.3 m. the latter Should be more Sensitive to changes in thermodynamic boundary conditions. application of Simple Sensitivity equations given by Reference ThorndikeThorndike (1992, equation 32; See also rothrock and others, 1999) Shows that a modal thickness increase of 0.3 m can be due to a 1wm–2 decrease of ocean heat flux, a 5wm–2 decrease of downwelling Shortwave radiation or a 3wm–2 decrease of atmospheric poleward heat transport, between our observations. unfortunately, we are lacking data of ocean Surface Salinity and temperature or melt-pond coverage, which would better explain our results.
Hem data are very Suitable for characterizing ice types and ice regimes, and their interannual variability. although the accuracy of the measurements cannot easily be demonstrated directly, there is plenty of evidence for a thickness accuracy of ±0.1m for level ice. ice regimes can be clearly distinguished (Fig. 3), and the data are very consistent (Table 1). the thickness retrieval illustrated in Figure 2 assumes laterally homogeneous level ice within the footprint of the instrument, and negligible ice conductivity (Reference Haas, Gerland, Eicken and MillerHaas and others, 1997). under the Studied conditions, the errors resulting from these assumptions are actually very Small. the open-water modes in Figures 4 and 5 are very narrow and centred at 0m as expected. Similarly, other modes are also very Sharp (e.g. Fig. 4), demonstrating the low noise of the derived thickness profiles. it is remarkable that, despite the underestimation of ridge thickness, the 2005 data Show a pronounced higher fraction of ridged ice as Suggested by the buoy motion data. hem data are therefore probably also well able to detect relative changes in the thickness and amount of ridged ice.
Conclusions
We have presented a unique Sea-ice thickness dataset from the lincoln Sea and adjacent arctic ocean. results Show very thick ice in the region, and Some interannual ice- and Snow-thickness variability. the variability can partially be explained by the ice-motion regime of Strong Southward drift, and our results therefore confirm the Sensitivity of the region to changes in circulation regimes (Reference Hilmer and LemkeHilmer and lemke, 2000; holloway and Sou, 2002). ice dynamics in the lincoln Sea are complicated by ice export through nares Strait: estimating this requires ice-drift data with high Spatial resolution. these could be gathered, for example, by passive and active Satellite microwave imagery (e.g. Reference KwokKwok, 2005).
Our results demonstrate the usefulness of hem Surveys for regional ice-thickness Studies. we plan to continue and extend the measurements off alert in coming years to extend investigations of interannual variability. the Surveys will also Serve as validation for icesat and cryosat-2 Sea-ice Surface elevation measurements. as Such, the region north of ellesmere island is actually very Suitable, because the interannual variability clearly exceeds the expected accuracy levels of both missions, thus hopefully being well detectable from Space.
Acknowledgements
All measurements were performed within the european union-funded project greenice (greenlandic arctic Shelf ice and climate experiment evk2-ct-2002-00156). we thank p. wadhams and r. forsberg for coordinating the field campaigns, as well as veco polar resources Staff, g. Stewart of canadian forces alert, and universal helicopters newfoundland pilots for outstanding logistical Support. helicopters were provided through the polar continental Shelf project. S. goebell and j. lobach are acknowledged for their help during the campaigns, as well as a. mittermeier for data processing and t. busche for Sar image preparation. editorial comments by i. allison improved the paper further.



