

I. INTRODUCTION
The chalcopyrite semiconductor
 ${\rm{CuI}}{{\rm{n}}_x}{\rm{G}}{{\rm{a}}_{1 - x}}{\rm{S}}{{\rm{e}}_2}$
(CIGS) is considered as the most promising material for high efficiency thin film solar cells. Recently, the efficiency of CIGS solar cells has reached 21.7%.
Reference Jackson, Hariskos, Wuerz, Kiowski, Bauer, Friedlmeier and Powalla1
The absorber layers for high-efficiency CIGS solar cells are deposited by co-evaporation
Reference Jager-Waldau2
in tradition, but the small areas of evaporation sources make uniformity for large films difficult to achieve, and the simultaneous control over four separate sources is complex. For this reason, a two-step method, selenization after sputtering stacked metal layers (SML) was applied.
Reference Koo, Jeon, Oh, Cho, Son and Kim3
Magnetron sputtering is a preferred method for depositing many large-area, precise control needed films and in general has advantages in scalability to large areas without sacrificing uniformity.
Reference Frantz, Myers, Bekele, Nguyen, Sadowski, Maximenko, Walters and Sanghera4
In spite of the fact that there are many reports about the two-step method, Reference Park and Kim5–Reference Han, Liao, Jiang, Xie, Zhao and Besland7 some problems still exist in it. One is that the selenized CIGS films were lacking in homogeneity due to the inhomogeneous sputtered metal layers Reference Chung, Kim, Kim, Adurodija, Yoon and Song8 which were often presented as indium hillocks on a smooth background. In addition, phase segregation was observed after selenization. Reference Başol, Kapur, Halani, Leidholm, Sharp, Sites, Swartzlander, Matson and Ullal9 To solve these problems, an optimized scalable method is needed in fabricating qualified SML for high efficiency CIGS solar cells.
The morphology and structure of SML can be easily affected by the stacking methods, which also impact the selenized CIGS layers directly and hence the cell’s performance. Herein SML for CIGS solar cells were deposited by co-sputtering and sequential sputtering, and the influence of different stacking sequences and single layer thickness to the SML and selenized CIGS layers were investigated in detail.
II. EXPERIMENTAL PROCEDURES
Prior to the deposition of SML, nearly 1 μm thick Mo thin films were deposited on soda-lime glass (SLG) substrates by three-step sputtering. SLG substrates were cleaned ultrasonically in acetone, dehydrated alcohol, and de-ionized water sequentially. The Mo films on SLG side and CIGS side were deposited at a relatively high working pressure for good adhesive and the middle layer was at low pressure to achieve low resistivity. A magnetron sputtering system equipped with three centripetal dip cylindrical magnetrons operating with DC/RF power supplies was used to sputter CuGa (Ga 28 at.%) and pure In targets. The base pressure of the sputtering system was
 $4 \times {10^{ - 4}}\;{\rm{Pa}}$
and the working pressure was kept at 0.3 Pa with 20 sccm Ar flow. The sputtering power density of CuGa and indium targets was maintained at around 0.57 and 1.25 W/cm2 under which the deposition rate of the two targets were kept the same. The SML deposition processes by sequential sputtering or co-sputtering could be controlled through operating the baffle plates on targets and the deposition time of each layer was controlled at 3, 5, 8, and 10 min when sputtering sequentially. The total thickness of the SML was around 500 nm, and no heating process was applied during all sputtering procedure. The substrate temperature was monitored by a thermocouple closed to but no-touch with the substrate.
For selenization, a rapid thermal process equipment integrated with the sputtering system was applied, which comprises a quartz tube, ten infrared (IR) lamps, and a turbo pump. The annealing processes were carried out under the base pressure of
 $8 \times {10^{ - 4}}\;{\rm{Pa}}$
and a graphite crucible was used for keeping a relatively stable selenium steam pressure around the samples. Samples and sufficient amount of selenium powder were encapsulated in the graphite crucible and then annealed by a two-step method. Temperature rose up to 240 °C with a low heating rate, then ramped up to 550 °C at the rate of 2 °C/s. During the whole annealing process, the pressure in the quartz tube was kept below
 $1 \times {10^{ - 2}}\;{\rm{Pa}}$
and the selenization time was 5 min.
The surface and cross-sectional morphology and compositions were examined using a thermal field emission environment scanning electron microscope (Philips Quanta 400 FEG; FEI Company, Eindhoven, The Netherlands) operated at 20 kV and energy dispersive x-ray spectrometer (EDS; Oxford INCA). The structure information was collected using x-ray diffraction (XRD; Empyrean) with Cu Kα1 radiation
 $(\lambda = 1.54056\,{{\AA})}}$
. The surface roughness was scanned by Veeco Instruments (Wyko 9100, Plainview, New York) 3D morphology profiler. Hall measurements were taken place using Hall Effect Measurement System (PhysTech RH 2035, PhysTech GmbH, Moosburg, Germany).
III. RESULTS AND DISCUSSION
A. Growth behaviors of the SML
The SEM images of co-sputtered SML are presented in Fig. 1(a). It shows a typical structure of the SML, hillocks of indium distributed on a relatively smooth metallic background. The cashew-like indium-rich hillocks had diameters over 5 μm in average which is different from the results of other groups Reference Park, Kim, Lee, Koo, Lee, Jeon, Yoon and Kim10 and resulted in the nodules on the CIGS surface after selenization that is shown in Fig. 1(b). The formation of indium-rich hillocks has been studied by many groups, Reference Wider, Gimple, Evenson, Schatz, Jaworski, Prokop and Marszalek11,Reference Wei, Zhang, Liu, Huang and Zhang12 indium atoms and clusters tend to separate out and aggregate into hillocks owing to its low melting point and compressive stress. While co-sputtering, indium hillocks grew continually and only when the indium atoms accrete thin enough the growth of hillocks can be suppressed. Thus, the method of stacking indium layers and copper-gallium layers sequentially is more reasonable.
SEM images of (a) co-sputtered SML and (b) CIGS layers after selenization.

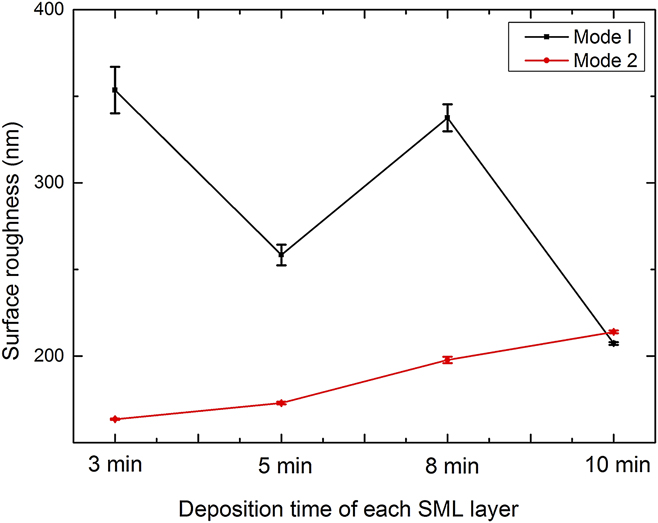
The stacking sequence and thickness of each layer can be regulated in sequential sputtering. The stacking mode I means the SML deposition beginning with CuGa alloy layer (CuGa/In⋯CuGa/In) and the mode II refers to depositing indium layer first (In/CuGa⋯In/CuGa). The low magnification SEM images of SML in two modes are presented in Figs. 2 and 3, respectively. As we can see from the surface morphology of the SML, the growth of indium hillocks was controlled to some extent and the average diameter of hillocks decreased to less than 3 μm. There was no regularity in the surface roughness evolution for mode I, as shown in Fig. 2. Figure 4 demonstrates the surface roughness evolution with increasing deposition time of each metal layer, which also reflects the irregularity in the distribution of indium hillocks in mode I.
SEM images of the SML prepared at different deposition times for each layer in mode I. (a) 3 min, (b) 5 min, (c) 8 min, and (d) 10 min.

SEM images of the SML prepared at different deposition times for each layer in mode II. (a) 3 min, (b) 5 min, (c) 8 min, and (d) 10 min.

Surface roughness of the SML.
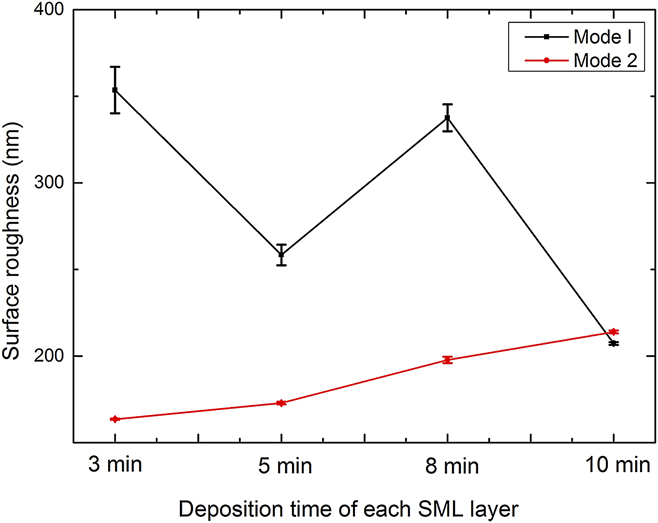
Compared with mode I, the hillocks of indium on the surface seemed greater in number and showed much smaller average size in mode II as presented in Fig. 3. Very regularly, the hillocks grew larger with the deposition time of each layer increasing and the intervals between hillocks expanded, indicating the raise of surface roughness which is also illustrated in Fig. 4.
For stacking mode II (In/CuGa⋯In/CuGa), the indium layer was deposited first and its growth mode dominated the distribution of indium hillocks. With the deposition time of each layer increasing, indium hillocks grew bigger, and the SML tended to form a rougher surface which corresponds to the results of the other group. Reference Wei, Zhang and Huang13
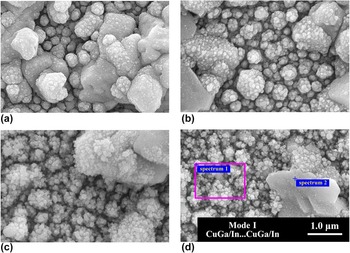
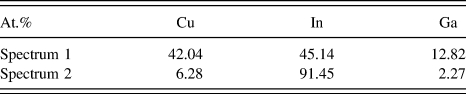
High magnification images of SML focusing on the background between indium hillocks are displayed in Figs. 5 and 6. The background of SML also showed a relatively rough morphology. For mode I, the background evolved rougher with increasing deposition time for each layer. When the deposition time of each layer fixed at 3 min, the background was composed of dense nodules as shown in Fig. 5(a), and then some small pellets appeared on the surface of nodules [Figs. 5(b) and (c)]. Finally, the surface morphology of background evolved to a loose one with dispersed pellets [Fig. 5(d)]. Table I shows the section EDS results (sections were marked in Fig. 5). The result of spectrum 2 proved that the hillocks were indium rich with indium occupying 91.45% in composition (other elements were not detected) and the background was composed of Cu–In alloy as shown in the result of spectrum 1.
High magnification SEM images of SML prepared at various deposition times for each layer in mode I. (a) 3 min, (b) 5 min, (c) 8 min, and (d) 10 min.

High magnification SEM images of SML prepared at various deposition times for each layer in mode II. (a) 3 min, (b) 5 min, (c) 8 min, and (d) 10 min.

EDS results of SML prepared at the deposition time of 10 min for each layer. The standard deviation of measurements at the same location is ±0.05 at.%.

For mode II, the evolution of the background morphology was not so significant. When the deposition time of each layer was 3 min, the background seemed smooth and tight, and after increasing deposition time the morphology of background remained nearly the same (Fig. 6).
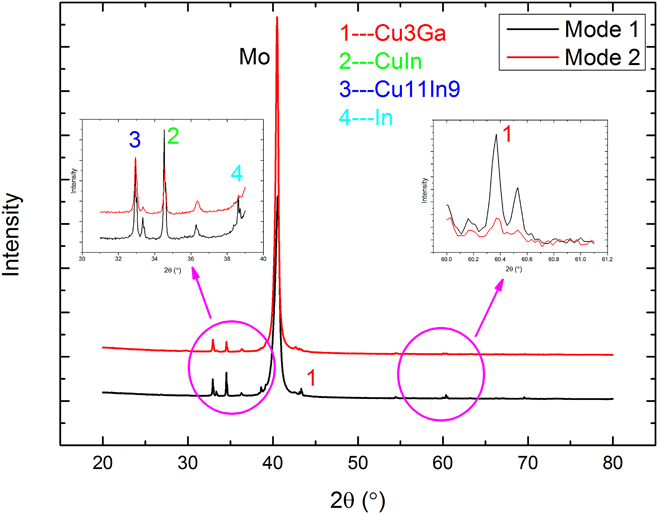
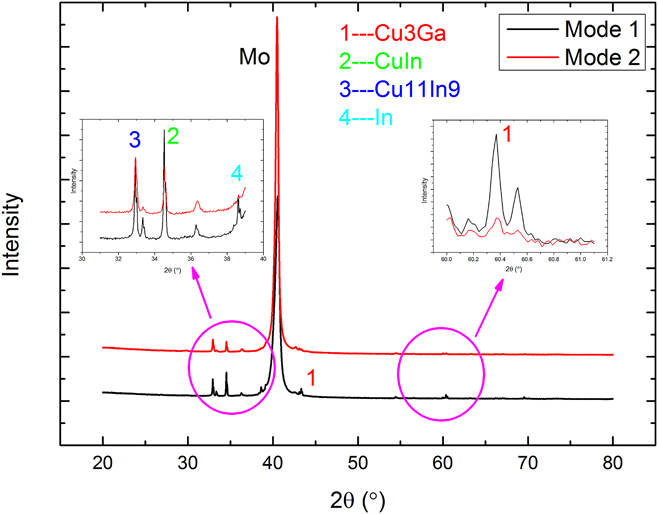
The XRD patterns of SML with 5 min deposition time for each layer are shown in Fig. 7. The FWHM value of peaks marked in mode I were lower than that in mode II, which indicated better crystallinity of pure indium and copper–gallium alloy in mode I (Mode I: peak 1 in 43.325°–0.094, peak 1 in 60.364°–0.082, peak 2 in 34.524°–0.081, peak 3 in 32.924°–0.099, peak 4 in 38.597–0.117; Mode II: peak 1 in 43.325°–0.139, peak 1 in 60.366°–0.108, peak 2 in 34.535°–0.088, peak 3 in 32.935°–0.123, peak 4 in 38.625°–0.154). Considering that the indium hillocks in mode I were larger in dimensions, we conclude that there was more indium phase accumulating at the surface of SML in mode I and thus leading to phase segregation.
XRD patterns of SML in two different modes prepared at 5 min for each layer.
The sputtered In and CuGa alloy layers showed quite different properties. The indium layer was loose and rough on Mo substrate with a deposition rate of nearly 16 nm/min. On the contrary the CuGa alloy layer was dense and smooth and contributed little in the thickness increasing with much atoms embedded into the In layers while sequential sputtering. It can be predicted that changing the first layer on glass leads to different growth modes of the SML. Indium growth on molybdenum and copper-gallium layers tend to be island-like, which may be due to the high substrate temperature and high deposition rate of indium. The cluster of indium tent to gather as spheres to decrease surface energy rather than react with molybdenum or copper–gallium alloy to form metallic compounds which can also speculated from the low enthalpy change of copper–indium compounds. Reference Theron, Ndwandwe, Lombaard and Pretorius14 In mode I, CuGa layer formed a smooth surface on glass, thus sequentially sputtered indium atoms had long enough diffusion length for island-like growth and with more indium atoms accumulated into hillocks; the alloy layer in the intervals showed thinner and thus enhanced the hillocks growth in the sequent sputtering processes. On the other hand, indium layers on Mo films as the first layer was quite rough and was resulting in a mixed growth mode under which the hillocks and background grew equally. The adhesive for all SML was similar and no spalling phenomenon was observed.
B. Structure of the selenized CIGS layers
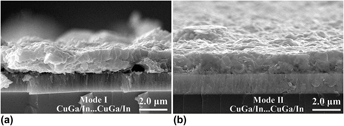
The cross-sectional SEM images of the CIGS selenized from the 5 min SML in two modes are displayed in Fig. 8. The surface of (a) for mode I seems rougher on the side view and (b) for mode II was relatively smooth which corresponded to the SML morphology.
Cross-sectional SEM images of CIGS layer selenized from the SML stacked in two modes, (a) 5 min in mode I and (b) 5 min in mode II.

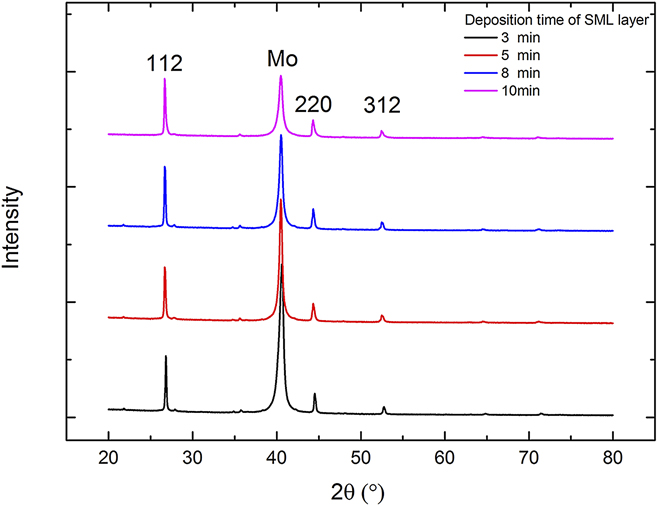
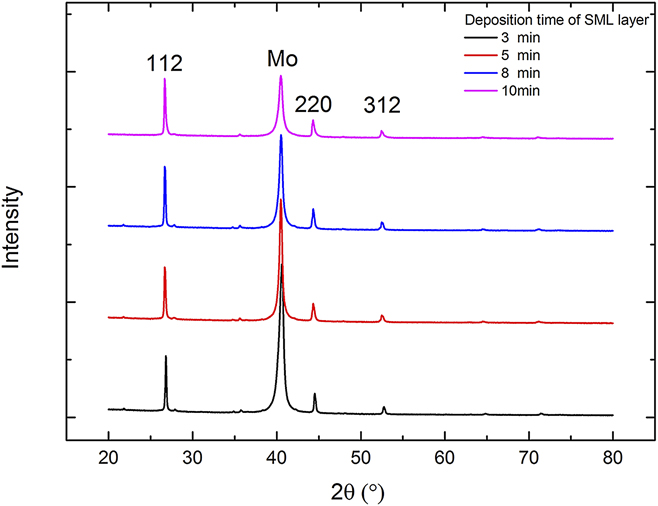
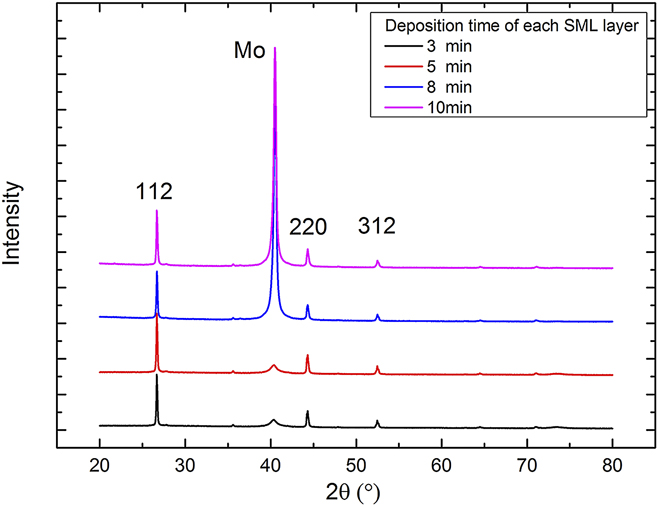
The XRD patterns of CIGS layers from mode I are shown in Fig. 9. The peaks in 26.676°, 44.305°, and 52.465° correspond to the (112), (220), and (312) peaks in CIGS (JCPDS PDF#35–1102); however, the peaks location shifted toward the slightly lower 2θ value compared with the standard peak position of
 ${\rm{CuI}}{{\rm{n}}_{0.7}}{\rm{G}}{{\rm{a}}_{0.3}}{\rm{S}}{{\rm{e}}_2}$
[26.897° for (112) peak] and maintained their location whatever the SML were. According to the peak shifting, the amount of gallium incorporation was 0.179 in stoichiometry (4.475 at.%) using linear fit. At the same time, EDS results indicated that there was only 1.73 at.% gallium on the surface. As reported,
Reference Baji, Lábadi, Molnár, Pécz, Tóth, Tóth, Csik and Bársony15
phase segregation could be observed in all CIGS layers which indicated little Ga incorporation into the CIS lattice. Thus, the peak shifting was resulted from the bottom gallium-rich phases, and the top layer was a dense CIS layer with little gallium incorporation.
XRD patterns of CIGS layer selenized for mode I (CuGa/In⋯CuGa/In) SML.
The phase segregation is due to the solid reaction processes Reference Han, Liao, Gautron, Jiang, Xie, Zhao and Besland16,Reference Mainz, Weber, Rodriguez-Alvarez, Levcenko, Klaus, Pistor, Klenk and Schock17 and different reaction activities of selenium with indium and gallium. Reference Hanket, Shafarman, McCandless and Birkmire18 The stacking mode I (CuGa/In⋯CuGa/In) limits the copper out diffusion and enhances gallium accumulation on the bottom. Thus the secondary layer occupies nearly half the CIGS layer and its small grains and poor adhesion may encumber the efficiency of modules.
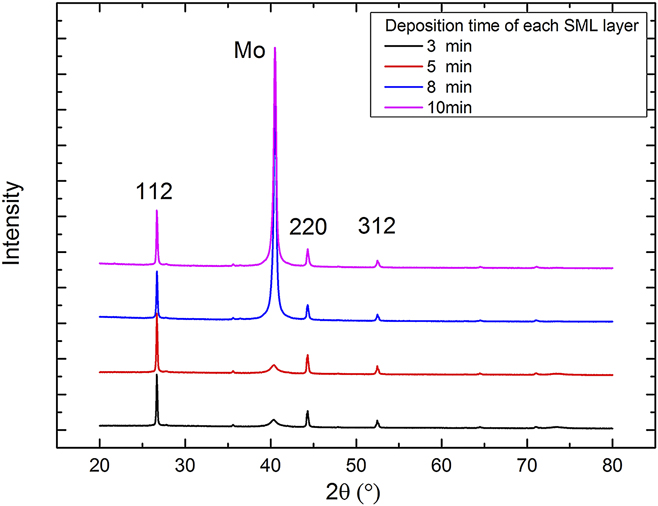
For mode II, the evolution of surface roughness corresponded to the regularity of the SML (spotted from the SEM images which are not shown here) and the secondary layer was quite thin comparing with the former results. This indicated that the stacking mode II (n/CuGa⋯In/CuGa) catered to the vapor–liquid–solid phase transition kinetic Reference Klenk, Walter, Schock and Cahen19 in the CIGS crystal growth and the EDS results showed 2.41 at.% gallium atoms on the surface, which meant this stacking mode also enhanced the gallium out diffusion.
The XRD patterns of CIGS layer in mode II are illustrated in Fig. 10. The 112 peak position remained the same as the former stacking mode at 26.676° and phase distribution was also similar.
XRD patterns of CIGS layer selenized for mode II (In/CuGa⋯In/CuGa) SML.
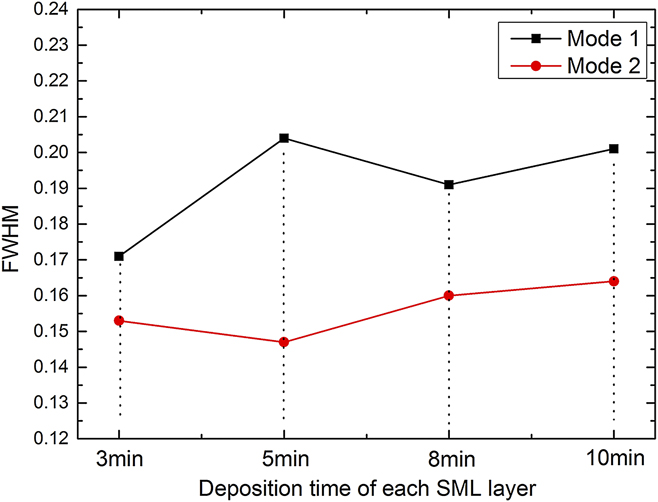
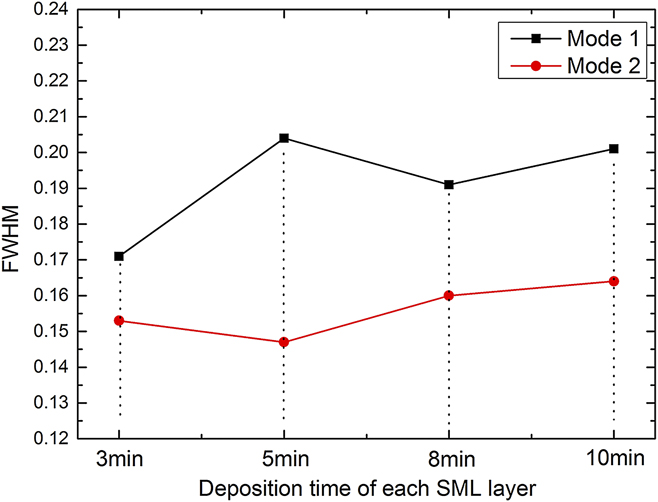
The FWHM values of 112 peak in all cases are illustrated in Fig. 11. With indium layer as the first layer, the value was lower and when deposition time of each SML layer was 5 min (the thickness of indium layer was approximately 83 nm), the value reached the lowest point. This indicated that the crystallinity was improved when indium was deposited first, and was consistent with the observation in the cross-sectional SEM images.
FWHM value of 112 peak of CIGS.
C. Electrical properties of the CIGS layers
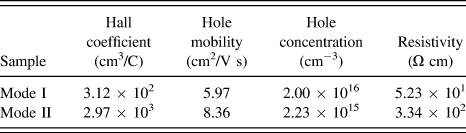
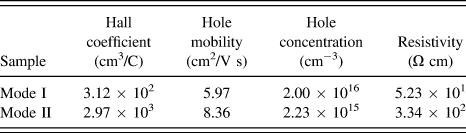
For hall measurement, the SML were deposited directly on the SLG substrates and deposition parameter of 5 min for each layer in two modes was chosen. The results are shown in Table II. The positive hall coefficients of the two samples indicated that the CIGS layers were both p-type materials, and samples in mode II had higher hole mobility compared with mode I. The intrinsic defects in bulk play an important role in the conductivity type and carrier concentration of CIGS materials and defects located in grain boundaries mainly limit the hole mobility. Reference Liu, Xiang Wei, Zhao and Yan20 Corresponding with the upper results, CIGS layers in mode II had better crystallinity which led to a higher hole mobility of 8.36 cm2/V s.
The electrical properties of the selenized CIGS layers.
IV. CONCLUSION
Sequential sputtering has advantages in controlling indium hillocks compared with co-sputtering while depositing SML and the first layer makes significant influence in the growth mode of SML. When the CuGa was placed on the first layer (mode I), the successive growth of SML was island-like mode, resulting in large and random distributed indium hillocks. However, when indium layer was at the bottom (mode II), the mixed mode dominated the sequential layer growth which led to a controllable SML morphology. After selenization, the CIGS layers from stacking mode II also exhibited controllable morphology and the phase segregation was suppressed effectively which led to larger grains and more gallium incorporation. When the thickness of indium layer was fixed at approximately 83 nm (5 min for each layer) in mode II, the CIGS layers gained was optimal. The hole concentration and hole mobility of the optimized CIGS layer were
 $2.23 \times {10^{15}}\;{\rm{c}}{{\rm{m}}^{ - 3}}$
and 8.36 cm2/V s, respectively.
ACKNOWLEDGMENT
This work was financially supported by Department of Education of Guangdong Province [Grant No. 2013CXZDA002] and Guangdong Science and Technology Department [Grant No. 2014A010106009].